

Paper Menu >>
Journal Menu >>
 Int. J. Communications, Network and System Sciences, 2012, 5, 684-690 http://dx.doi.org/10.4236/ijcns.2012.510071 Published Online October 2012 (http://www.SciRP.org/journal/ijcns) Detection the Spectrum Holes in the Primary Bandwidth of the Cognitive Radio Systems in Presence Noise and Attenuation Ahmed S. Kadhim, Haider M. AlSabbagh Department of Electrical Engineering, College of Engineering, Basra University, Basra, Iraq Email: [email protected], [email protected] Received July 23, 2012; revised August 20, 2012; accepted September 3, 2012 ABSTRACT Cognitive Radio (CR) and Dynamic Spectrum Access (DSA) represent two complementary developments that will re- fashion the world of wireless communication. In order to investigate the roles of knowledge representation and reason- ing technologies in this domain, we have developed an experimental cognitive radio simulation environment. That is, a conventional radio when operating in a particular communications mode always follows the same procedure and either succeeds or fails at a given task. A cognitive radio, by contrast, can use knowledge of radio technology and policy, rep- resentations of goals, and other contextual parameters to reason about a failed attempt to satisfy a goal and attempt al- ternate courses of action depending upon the circumstances. Keywords: Cognitive Radio (CR); Power Spectral Density (PSD); Primary User (PU); Secondary User (SU) 1. Introduction Most of today’s radio systems are not aware of their ra- dio spectrum environment and operate in a specific fre- quency band using a specific spectrum access system [1]. Investigations of spectrum utilization indicate that not all the spectrum is used in space (geographic location) or time. A radio, therefore, that can sense and understand its local radio spectrum environment, to identify temporarily vacant spectrum and use it, has the potential to provide higher bandwidth services; increasing spectrum effi- ciency lead to minimizing the need for centralized spec- trum management. This could be achieved by a radio that can make autonomous (and rapid) decisions about how it accesses spectrum. Cognitive radios have the potential to do this. Cognitive radios have the potential to jump in and out of un-used spectrum gaps to increase spectrum efficiency and provide wideband services. In some loca- tions and/or at some times of the day, 70 percent of the allocated spectrum may be sitting idle [2]. The FCC has recently recommended that significantly greater spectral efficiency could be realized by deploying wireless de- vices that can coexist with the licensed users [3]. Figure 1 shows the unusing of cognitive radio for the spectral holes [4]. In this paper we simulated the basics of cognitive radio enabling dynamic spectrum access at run time. The spec- trum is utilized efficiently by cognitive users and take the priority to the primary user if they return to use the spec- trum also take the effect of noise and attenuation on the spectrum. This paper is organized as follows: in Section 2 a com- plete description for PSD is given. Section 3 explains Spectrum Concentration. Section 4 illustrates the system performance with the block diagram. The simulation re- sults are presented in Section 5. Section 6 concludes the achievements from this study. 2. Power Spectral Density Detection The power spectral density (PSD) is intended for con- tinuous spectra [4-8]. An important attribute of random noise is its power spectral density (PSD). The estimation of the power spectral density (PSD) by the function call- ed periodogram function. The periodogram for a sequence 1n x x is given by: 2 1 1 ee 2π N j jn n n Sx N (1) The periodogram is 2 2π 1 1es f j n NF n n s Sf x FN (2) where ω is in radians/sample. Frequency in Hz and the Fs are the sampling frequency. Periodogram is the PSD estimate of the signal defined by sequence 1n x x. C opyright © 2012 SciRes. IJCNS 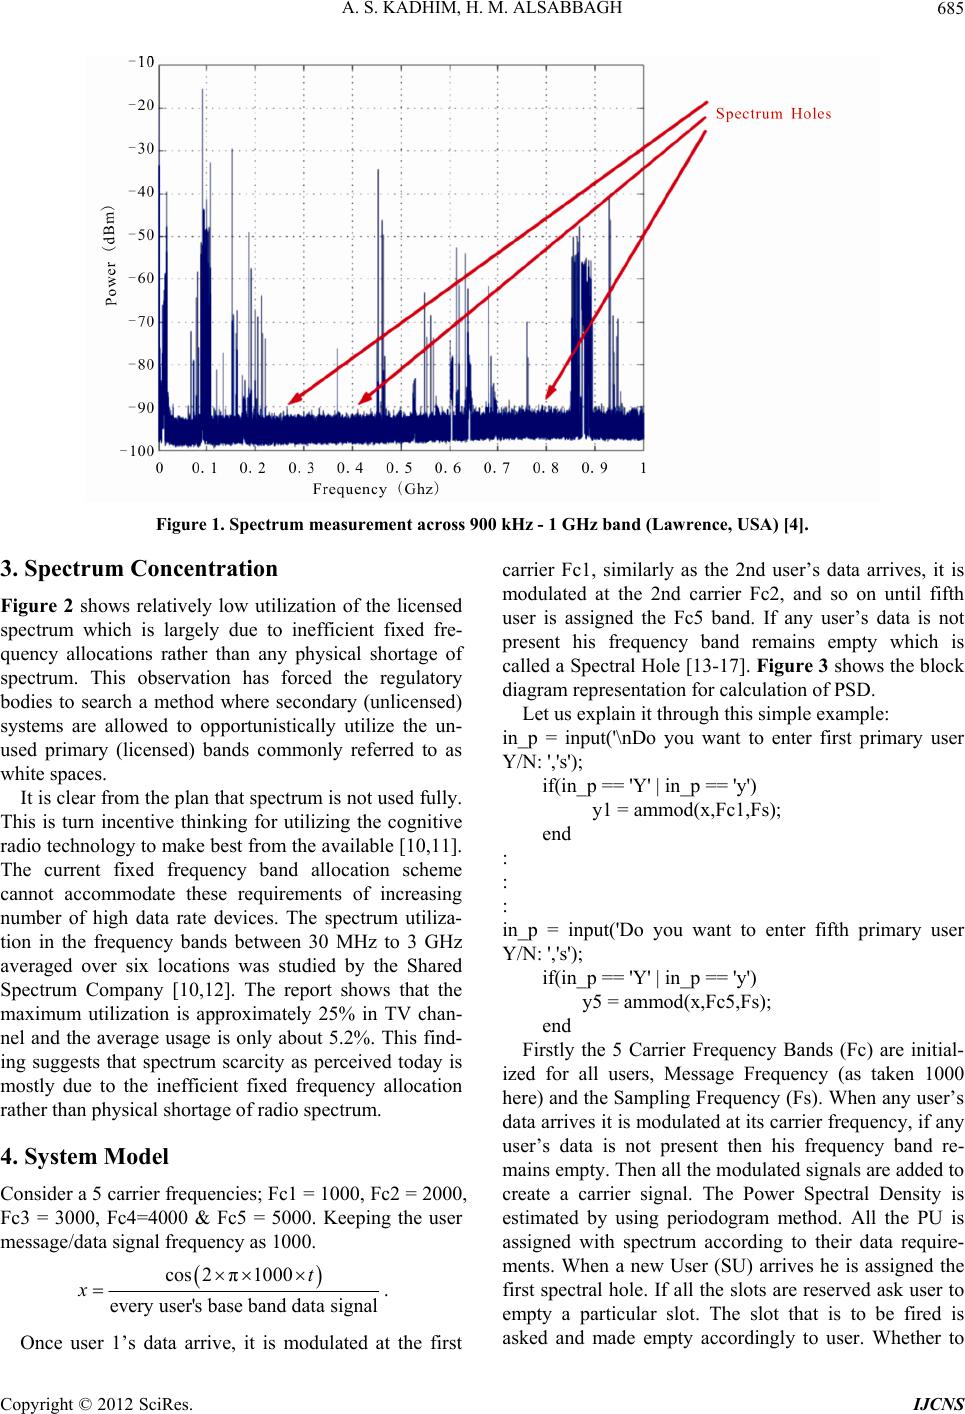 A. S. KADHIM, H. M. ALSABBAGH 685 Figure 1. Spectrum measurement across 900 kHz - 1 GHz band (Lawrence, USA) [4]. 3. Spectrum Concentration Figure 2 shows relatively low utilization of the licensed spectrum which is largely due to inefficient fixed fre- quency allocations rather than any physical shortage of spectrum. This observation has forced the regulatory bodies to search a method where secondary (unlicensed) systems are allowed to opportunistically utilize the un- used primary (licensed) bands commonly referred to as white spaces. It is clear from the plan that spectrum is not used fully. This is turn incentive thinking for utilizing the cognitive radio technology to make best from the available [10,11]. The current fixed frequency band allocation scheme cannot accommodate these requirements of increasing number of high data rate devices. The spectrum utiliza- tion in the frequency bands between 30 MHz to 3 GHz averaged over six locations was studied by the Shared Spectrum Company [10,12]. The report shows that the maximum utilization is approximately 25% in TV chan- nel and the average usage is only about 5.2%. This find- ing suggests that spectrum scarcity as perceived today is mostly due to the inefficient fixed frequency allocation rather than physical shortage of radio spectrum. 4. System Model Consider a 5 carrier frequencies; Fc1 = 1000, Fc2 = 2000, Fc3 = 3000, Fc4=4000 & Fc5 = 5000. Keeping the user message/data signal frequency as 1000. cos 2π1000 every user'sbase band data signal t x . Once user 1’s data arrive, it is modulated at the first carrier Fc1, similarly as the 2nd user’s data arrives, it is modulated at the 2nd carrier Fc2, and so on until fifth user is assigned the Fc5 band. If any user’s data is not present his frequency band remains empty which is called a Spectral Hole [13-17]. Figure 3 shows the block diagram representation for calculation of PSD. Let us explain it through this simple example: in_p = input('\nDo you want to enter first primary user Y/N: ','s'); if(in_p == 'Y' | in_p == 'y') y1 = ammod(x,Fc1,Fs); end : : : in_p = input('Do you want to enter fifth primary user Y/N: ','s'); if(in_p == 'Y' | in_p == 'y') y5 = ammod(x,Fc5,Fs); end Firstly the 5 Carrier Frequency Bands (Fc) are initial- ized for all users, Message Frequency (as taken 1000 here) and the Sampling Frequency (Fs). When any user’s data arrives it is modulated at its carrier frequency, if any user’s data is not present then his frequency band re- mains empty. Then all the modulated signals are added to create a carrier signal. The Power Spectral Density is estimated by using periodogram method. All the PU is assigned with spectrum according to their data require- ments. When a new User (SU) arrives he is assigned the first spectral hole. If all the slots are reserved ask user to empty a particular slot. The slot that is to be fired is asked and made empty accordingly to user. Whether to Copyright © 2012 SciRes. IJCNS  A. S. KADHIM, H. M. ALSABBAGH 686 Figure 2. Inefficient use of spectrum [9]. Figure 3. Block diagram for PSD calculation. Copyright © 2012 SciRes. IJCNS  A. S. KADHIM, H. M. ALSABBAGH 687 add or not the Noise and in how much amount is asked to user. The output is plotted. The attenuation and % age of attenuation is asked to be added and plotted accordingly [4,10,12,18]. 5. Results We design our system to have 5 different frequency channels and each user is assigned a particular frequency band. Once the program is run it l asks to add a user and assign it a particular band in the ascending order. In Figure 4 the users 2, 3 and 5 are not entered, thus their respective bands are still un-allocated. The power spectral density behavior of the carrier signal is shown in Figure 5. Now, with another user is adding as shown in Figure 6, the system will search the first available gap in the spec- trum and automatically assign it to the new user. As the first available gap was after User 1 as User 2 was not sending any data so the band reserved for User 2 at start is now assigned to this new User. From Figure 7 it can be seen that the first spectral gap has been filled by assigning it the new incoming user’s data. The first spectral gap belonged was that of User 2. Figure 4. Command widow showing entry of u sers. Figure 5. PSD graph. Figure 6. Command window. Figure 7. PSD graph. With adding another user the list look is as shown in Figure 8. As user 3’s data was not present the spectral gap of User 3 has been filled by the next incoming user as shown in Figure 9. Now we have just one empty slot left which will get filled by addition of another Primary User as depicted in Figure 10. Figure 11 shows the power spectral density of the signal and all of the frequency bands are efficiently in use after the addition of the last incoming user. Once all the slots are being assigned our system will entertain no other Users will be able to free up the slots one by one as shown in Figure 12. If it is required to empty a slot it will remove the data in the first slot and make it ready for the next assignment. Similarly, noise and attenuation parameter can be added to analyze the channel characteristics, as illustra- ted in Figure 13. Therefore, noise is added to the signal. The resulting noisy carrier’s power spectral graph is given depicted in Figure 14. Then, attenuating the carrier the system will ask for the percentage of attenuation required, as shown in Figure 15. Copyright © 2012 SciRes. IJCNS  A. S. KADHIM, H. M. ALSABBAGH 688 Figure 8. Command window. Figure 9. PSD graph. Firgure 10. Command windows. Here it is seen that the effect of adding attenuation to the signal in Figure 16. As the level of the signal de- pends upon the % age of attenuation is added. 6. Conclusion This paper takes the problem of in-efficient spectrum Figure 11. PSD graph shows All of the bands are in use. Figure 12. command window. Figure 13. Command window. utilization i.e. shown by FCC that the spectrum is not scarce but it is not used efficiently with maximizing the utilizations. A PSD is introduced to test the portion of the spectrum which is not used by PU at a time to be allo- cated for SUs. The priority to PUs and accordingly the left sots are allocated to SUs is presented. Then, addi- Copyright © 2012 SciRes. IJCNS  A. S. KADHIM, H. M. ALSABBAGH 689 Figure 14. Noisy channel’s power spe c tral density graph. Figure 15. Command window. Figure 16. Noisy and attenuated Carrier’s power spectral density graph. tional noise and attenuation are considered to evaluate their effects on the availability of the signal. The ob- tained results show that such simulation is capable to illustrate a wide range of results and different case of pa- rameters. REFERENCES [1] D. Cabric, S. M. Mishra and R. W. Brodersen, “Imple- mentation Issues in Spectrum Sensing for Cognitive Ra- dios,” Proceedings of the 38th Asilomar IEEE Confer- ence on Signals, Systems and Computers, Vol. 1, 2004, pp. 772-776. [2] “Spectrum Occupancy Measurements, Loring Commerce Centre, Limestone, Maine,” 18-20 September 2007. [3] S. J. Kim, E. C. Kim, S. Park and J. Y. Kim, “Dynamic Spectrum Allocation with Variable Bandwidth for Cogni- tive Radio Systems,” Proceedings of the 9th IEEE Con- ference on International Symposium on Communication and Information Technology, Seoul, 28-30 September 2009, pp. 106-109. [4] A. M. Wyglinski, “Cognitive Radio: A Flexible Wireless Platform for Transceiver Optimization,” 2007. http:// www.ittc.ku.edu/~ alexw [5] J. Mitola, “An Integrated Agent Architecture for Software Defined Radio,” Ph.D. Thesis, Royal Institute of Tech- nology (KTH), Stockholm, 2000. [6] M. Haddad, A. M. Hayar and M. Debbah, “Spectral Effi- ciency of Cognitive Radio Syetems,” Mobile Communi- cations Group Institut Eurecom, France, 17 March 2007. [7] A. Ginsberg, J. D. Poston and W. D. Horne, “Experi- ments in Cognitive Radio and Dynamic Spectrum Access Using an Ontology-Rule Hybrid Architecture,” The MI- TRE Corporation, McLean, 2008. [8] S. Haykin, “Cognitive Radio: Brain-Empowered Wireless Communications,” IEEE Journal on Selected Areas Com- munication, Vol. 23, No. 2, 2005, pp. 201-220. doi:10.1109/JSAC.2004.839380 [9] A. Shahzad, et al., “Comparative Analysis of Primary Transmitter Detection Based Spectrum Sensing Tech- niques in Cognitive Radio Systems,” Australian Journal of Basic and Applied Sciences, Vol. 4, No. 9, 2010, pp. 4522-4531. [10] Q. Zhao and A. Swami, “A Decision-Theoretic Frame- work for Opportunistic Spectrum Access,” IEEE Wireless Communication Magazine Special Issue on Cognitive Wireless Networks, Vol. 14, No. 4, 2007, pp. 14-20. [11] M. A. McHenry, “NSF Spectrum Occupancy Measure- ments Project Summary,” Shared Spectrum Company Report, National Radio Astronomy Observatory (NRAO) Green Bank, West Virginia, 2005. [12] R. Etkin, A. Parekh and D. Tse, “Spectrum Sharing for Unlicensed Bands,” IEEE Journal of Selected Areas Com- munication, Vol. 25, No. 3, 2007, pp. 517-528. doi:10.1109/JSAC.2007.070402 [13] E. Hossain, “Cognitive Wireless Communication Net- works,” Springer, New York, 2007. [14] A. A. El-Saleh, M. Ismail, O. B. A. Ghafoor and A. H. Ibrahim, “Comparison between Overlay Cognitive Radio and Underlay Cognitive Ultra Wideband Radio for Wire- less Communications,” Procedings of the 5th IASTED (AsiaCSN 2008), Langkawi, 2-4 April 2008, pp. 41-45. [15] IEEE 802.11 Wireless RAN, “Functional Requirements for the WRAN Standard, IEEE 802.11 05/0007r46,” 2005. [16] Z. Chair and P. K. Varshney, “Optimal Data Fusion in Multiple Sensor Detection Systems,” IEEE Transactions Copyright © 2012 SciRes. IJCNS  A. S. KADHIM, H. M. ALSABBAGH Copyright © 2012 SciRes. IJCNS 690 on Aerospace and Electronic Systems, Vol. 22, 1986, pp. 98-101. [17] P. K. Varshney, “Distributed Detection and Data Fusion,” Springer, New York, 1997. doi:10.1007/978-1-4612-1904-0 [18] A. Ghasemi and E. S. Sousa, “Fundamental Limits of Spectrum Sharing in Fading Environments,” IEEE Tran- sactions of Wireless Communication, Vol. 6, No. 2, 2007, pp. 649-658. doi:10.1109/TWC.2007.05447 |