

Paper Menu >>
Journal Menu >>
 Journal of Modern Physics, 2012, 3, 1523-1529 http://dx.doi.org/10.4236/jmp.2012.310188 Published Online October 2012 (http://www.SciRP.org/journal/jmp) Similarity Criteria, Galactic Scales, and Spectra Georgy S. Golitsyn A. M. Obukhov Institute of Atmospheric Physics, Russian Academy of Sciences, Moscow, Russia Email: [email protected] Received August 7, 2012; revised September 6, 2012; accepted September 13, 2012 ABSTRACT An old topic of dimensional analysis in astrophysics is presented and new results, or quantitative explanations of some observational facts are obtained, in particular, on the base of the supernova, SN, explosions. The presentation starts with the derivation of two similarity criteria for astrophysical objects constructed out of four measurable quantities: mass, M, luminosity, Lb, velocity U, size R, and gravitational constant G. The first well known criterium describes the virial prin- ciple and the other one seems to be new and is based on the Tully-Fisher observational relationship between luminosity and velocity. The energy generated by SN explosions allows one to estimate well the interstellar turbulent velocities and magnetic field in our Galaxy, resulting in 3 to 4 microgauss. It is found that for z ≥ 0.6 the observed distant galactic clusters are far from virial equilibrium and the degree of disequilibrium is increasing with z. It means that to reach such an equilibrium the cluster age should be of order ten dynamical time scales, see Equation (7). For all considered galaxy clusters the second similarity criterium was found to be constant with a precision of about ten per cent. Therefore it could be considered as a general law, though for different classes of objects the numerical coefficient may vary. Some scales are proposed and two of them are tested for galactic clusters by finding numerical coefficients with accuracies of about 20 percent or better: e.g. observed luminocities of clusters are 52 32 1b WL a MR G11.25 0.22a with for the first eleven objects from the Table for which the virial equilibrium is found with the same accuracy. The square root of the two criteria ratio 12 321 3 15 UWG explains the Tully-Fisher law and is constant for all 32 available clusters from [1,2] and is equal to 1.8 ± 0.2. This is because has not global values of total mass and size. Keywords: Dimensional Analysis; Galaxy Clusters; Virial Evolution; Tully-Fisher Law; Turbulence and Magnetic Fields 1. Introduction Dimensional relationships between the measured quanti- ties [3-7] are the base of studies of complex phenomena, certainly for astrophysics. Here we present such an analy- sis for quantities measured in astrophysics, find similar- ity criteria they may form, elucidate their meaning and possible applications, and present certain scales some of which are new ones, or at least used rarely. This analysis systemizes our knowledge of this methodology, presents some new results and may serve at least a methodologi- cal and educational purpose. For our Galaxy we estimate turbulent gas velocities and magnetic fields in interstellar medium basing on the power supplied by supernova, SN, explosions. At dis- tances galactic clusters are found to be far from the virial equilibrium between kinetic and potential ener- gies and the degree of disequilibrium increases with z. This is in contrast with what this author was told by some professionals less than ten years ago that the virial equi- librium must not to be questioned. This believe prevented this author from exploring the subject for many years, through recently another authority in cosmology and as- trophysics told me that the absence of such an equilib- rium for early objects is selfevident. How this processes evolves is shown in this paper. Thanks to the invitation to present a paper for this Special Issue of the magazine this text has been written with a methodological goal to re- new interest for the old subject which has been so pro- ductive in older times. 0.6z L In astrophysics the measured quantities are mass, M, velocity, V, luminosity, M or b, and sizes, R (in abso- lute units, if distances to objects are known). Gravity fields are characterized by the constant G = 6.672 × 10⁻¹² m3·kg−1·s−2. Distances in astrophysics are measured in parsecs: 1 pc = 3.08 × 10¹⁶ m = 3.26 light years. Our four measured quantities plus the gravity constant G are de- termined by three independent dimensions: mass, length, and time. It follows from here that from these five quan- C opyright © 2012 SciRes. JMP  G. S. GOLITSYN 1524 tities one can form two dimensionless values, the simi- larity criteria [3-7]. We choose the following as such criteria: 12 M G RU , (1) 35 225 M G RW 1 1 ,3 5 n WU n 51 WUG . (2) The first value may be naturally called the virial crite- rium because it is formed by quantites entering the virial theorem applied to the central gravity field. It is belived that after sufficient time this theorem is true for an arbi- trary number of interacting bodies. Then 1, if we would know with good precision all quantities entering (1), aside G, which we know with a relatively great pre- cision. If 1 it would demonstrate inaccuracies in our knowledge of masses, velocities, orbital and/or tur- bulent ones, negligence of some factors, e.g. dark matter or energy, an incompleteness of virialization of suffi- ciently large size objects, etc. Our Table below will demonstrate this for clusters of distant galaxies. The second similarity criterium for the clusters is of order unity. This demonstrates a close connection among the quantities entering it, i.e. mass, size and brightness united by the gravity field. To this author’s knowledge such a criterium have not yet been introduced. The long-known Tully-Fisher [8] relationship is a hint of such a connection: , (3) The upper limit for the exponent n is an immediate consequence from these variables dimensions: , (4) where from the velocity scale is 15 UWG . (5) Numerical constants entering (4) and (5) should be determined experimentally and are expected to be of or- der unity as was noted by P. Bridgman [4] referring to Albert Einstein. Exponents n lesser than 5 are evidenc that other similarity criteria act in the determination of the velocity scale (see [7]). e.g. if we take 15 1 1 UW 3 WUG we obtain . From Equations (1), (2) and (4) one may form the nondimensional simi- larity criterium as 12 321 15 1 cUWG c 1 c , (4’) where 1 is a numerical coefficient (see the end of Sec- tion 5), or 31 . The case that three quantities with three independent dimensions are forming a nondimen- sional criterium is a special case revealing a kind of the phenomenon degeneration. The only other case well known is the fine structure constant 21137ec causing some conceptual problems in quantum electro- dynamics. Such situations are discussed by P. Bridgman [4] in Chapter 8. Knowing the size and the velocity scale we determine the time scale from (1): 12 3 dRR TUMG 3 , (6) M which with the mass density scale R equals to 12 d TG . (7) The last time scale, obvious from dimensions of G and , can be found in the book by M. Rees [9] where it is called the dynamical time scale. It is compared there with the cooling time c of the earlier gas by recombination, transfer of energy between various atomic levels, etc. leading to the energy emission and gas cooling. If cd T TT , then primordial gas cloud is either compressed to its center, or fragmented into smaller objects, which may lead to formation of galaxy clusters. 2. Galactic Scales The observational situation is such that, all four quanti- ties W, U, M, R are very rarely determined simultane- ously for the same object. At the same time if we meas- ure only two values out of four, together with the gravity constant G we may still form some useful scales. As an example, let as choose mass M, size R and G. Then the velocity scale is, as from (1): 12 1 UMGR , (8) the time scale is 12 32 2πTRMG 2π (9) and is taken for the time of the full revolution of the object around the gravity center. The brightness, the power scale is 52 3252 WMGR 24 wMGR , (10) the energy density in the unit volume, dimension of pressure, is , (11) and the power density per unit mass is 32 3252 MGR 11 410 30 210 kgM 26 410 WW . (12) For our Galaxy with stars with the solar mass and brightness we obtain 240 MyT380 msU, , , 3 38 1.6 10WW 42 1.6 10ms , 93 210 Jmw . First three scales Copyright © 2012 SciRes. JMP  G. S. GOLITSYN 1525 are rather close to the observed ones. But the last value requires a comment. It is known [10] that for our Galaxy the volume den- sity of cosmic rays energy is close to 3 3 0.6 1 10 0.5 eVcm3 Jm The energy density of the galactic interstellar magnetic field is 212 8π10H erg/cm313 110 3 Jm6 510H 21 wMUR 33 310 at Gauss. The kin- etic energy density of turbulent gas motions are of the same order of magnitude, as well as the energy density of the star EM emissions and even the density of the relict emission [10]. The last could be a chance coincidence. At the same time Equation (11) gives a four magnitudes higher value. This may be explained by rewriting Equa- tion (11) using (8) as showing that it is the energy volume density of the large scale orbital mo- tions. But we are interested in small scales. The cosmic rays, CR, and galactic magnetic fields are generated by SN explosions. SN explode in our Galaxy two-three times in a century and 1052 - 1053 Jouls are generated at each explosion [10]. In Watts it corresponds to W. This and the CR energy volume density and direct use of the notion of the spectrum are enough to explain the observed shape of the CR spectrum [11,12]. With the velocity of light c and the Stefan-Bolzmann constant one may define the temperature scale g T using the volume energy density w as: 14 3 4π gwc T, (13) where 4π3 13 3 10 Jm 3.35 is the area of a unit sphere. With we obtain g Tw K. This is close to relict temperature 2.7 K. This is a single scale with the hint of the quantum mechanics because 24 32 23 1 π5.67 10 60 1.3810J K. k hc k 82 4 WLK, 33 1.0610J s 11 is the Bolzmann constant, is the Planck constant. h M. Rees [9] has introduced the notion of virtual tem- perature as a measure of kinetic energy in the object of consideration. It is defined from Equation (1) at . Then 2 mMG m TU kR k 27 1.66 10 m v, (14) where m is the mean atomic weight in the gas cloud. In its primordial composition protons are about 90 percent and helium is of order 10 percent. The mass of proton is kg. Therefore in Equation (14) p m kg. 27 10 30 210 26 410 1.9 Let us consider what these scales are for a star like our Sun with mass M kg and luminosity W. Then the linear scale determined by its mass and lu- minosity is 25 35 RMWG 13 3.6 10 58 710km 710mR 11 2 210U 1 , (15) and is equal to m = 240 a.u., astronomic units. It seems that this was the size of the original cloud from which the Sun and the Solar system were formed. The mass of the cloud was several times larger than the mass of the Sun, therefore the size of cloud was accordingly larger as Equation (15) is demonstrating. The virial simi- larity criterium Equation (1) for the Sun at is . At 1 5 4.510 m/sU we have 450 km/s . We see that the vi- rial criterium to the single star is not applicable. On the other hand a reasonable estimate is produced by Equation (5): 15 UWG s 2.3km, which is characteristic for the convective velocities in the photosphere. One can write formulas for the scales as Equations (8)-(12) for any oth- er couple of measured quantities like size R and luminos- ity W, or mass and luminosity, etc. We see from the above examples that the purely dimensional analysis is still able to produce useful results, at least, of educational value. One may note a very high dependence of luminosity in Equation (10) on mass and size as 52 MR . It may ex- plain the high luminosities of compact quasars. If we know only the luminosity W we may estimate the ratio M R for the virialized objects as 25 35 aW G 0.93 0.20a1 which 1 estimated from eleven first lines of our Table. The similarity criterium 3 is found to be unexpect- edly close to a constant value for all objects of our Table. The coefficient a varies from 0.50 to 0.65 with the mean value and dispersion 0.56 0.04a 0.34a even accounting for the cluster No. 12 for which . It makes us think that this cluster is somewhat unusual having a small mass at a comparatively high luminosity [1]. The addition of ten objects from [2] for which the val- ue of 3 can be calculated does not change noticeably the value of 0.56a . Therefore the similarity criterium 15 UWG 11.8 0.2a 3 is equal to for the ga- lactic clusters. For other objects it may vary. Certainly the similarity criterium 3 is of more universal mean- ing than 1 since it does not depend on the global pa- rameters of a system like its mass and size determining the system virial equilibrium between the kinetic and potential energies. The paper [2] has some detailed information on 13 nearly clusters with 0.23z . However only for ten of them the criteria 1 and 3 can be evaluated using the larger values for mass, size and temperature, see eq. (18). One can not directly compare such data with the parameters from our Table. Using what we have we compute the virial criterium 1 to be 0.44 0.04 in- stead of 1. This is mainly caused by the factor M R, evidently by overestimating the size of an object which is Copyright © 2012 SciRes. JMP  G. S. GOLITSYN 1526 still can be measured but contains only a small fraction of the total mass. The criterium 3 is close to 1.8 sub- stantiating the results from the Table. 26 210 W 37 810W 33 310 72 3 310 ms For the Sun at , at a = 0.56 the value For our Galaxy at W as from stars like Sun and at the mean or- bital velocities U = 300 km/s we 31.35 . It looks like that for similar single objects the similarity erium 3 cou 5750 KW ry. e T 37 11 0 ld va 41 find crit 3. Turbulence of a Galactic Interstellar Gas Energy generation for the turbulent gas motions comes from the SN explosions. The power of this process is estimated above as W for our Galaxy [10]. During explosions the shock waves tear off the external shells of SN and spread their matter from random places in the Galaxy and at random times. Random shock waves in space accelerate CR particles according to Fermi me- chanism. We assume the mass of the interstellar gas as M = 1040 kg. This is two order of magnitude less than the gravity mass of the Galaxy where over 90 percent is the dark matter, i.e. the mass of the gas is an order magni- tude less than the mass of the stars. The SN energy pow- er for the unit gas mass will be . This is the energy rate of generation of the matter perturbation and in the statistically stationary case it will be also the rate of the energy dissipation. Armstrong et al. [15] have shown that the spatial en- ergy spectrum for the electron density fluctuations in the interstellar gas is proportional to 53 k where 2πkr is the spatial wave number up to distances . The velocity fluctuations have the same structure up to 100 pc [10]. For the velocity fluctuations A. N. Kolmogorov have proposed in 1941 the structure function 500 pcr 19 1.5 10m 223 r uxbr u Dr ux (15) where the numerical coefficient b is close to 2 as it was later obtained from a great number of various measure- ments (see [14]). With the above estimated and 18 0m 1031r 0pc we obtain 12 20 ur uD m/s, a value close to the observed velocity fluctuations in our Galaxy. 4. Magnetic Field in the Galaxy To describe this field we determine the structure function using the same arguments as A. M. Obukhov has used in 1949 (see [1]) for the description of the statistical struc- ture of a passive scalar. But instead of the magnetic field induction i H we shall do it for the modulus of the Al- ven velocity 4π 1 VH 213 23 AA A DrVxr VxNr . Then , (16) where the rate of magnetic energy generation/dissipation is defined as 22 dd d2d 8π A VH Ntt . (17) Since the volume density of the magnetic energy is the same as the energy of velocity fluctuations, see above, and both are due to SN explosions, the time scales for both quantities should be of the same order. Then 23 13231235 432 310ms510 msN . For 18 100 pc310mr we will have from Equation (16) 2822 10 mcV 60 3 10 mV A. The mean density of the interstellar gas at is equal to 24 3 10g cmMV 6 3.5 10H , or of an order less than one proton on cm−3. Coming from the square of the Alven velocity to the magnetic field we obtain, at this density of matter, Gauss. The observed values of the magnetic field in our Galaxy vary from 3 to 5 microgauss. Its fluctuations in space should also be described by the Kolmogorov-Obukhov 53 k 7 2.5 10 7 1810 K 14 10 M spectrum. Such spectra have been obtained for the magnetohydrodynamic turbulence by Frick and Sokolov [2]. The last two subsections, just described, relate well the observed velocity fluctuations and magnetic fields to the observed rate of SN explosions in our Galaxy. 5. Clusters of Galactics and Their Similarity Criteria This author was a reviewer of A. A. Vikhlinin’s D.Sc. Dissertation “The observational Cosmology and the In- tergalactic Medium Studies by X-ray Spectra of Galactic Clusters” [1]. It has a detailed analysis of X-ray and op- tical data for 21 distant clusters at z from 0.4 to 1.26. A later paper [2] presents 13 relaxed closer clusters with z ≤ 0.23 and necessary references. Table 1 has all the data from [1] needed for the subsequent analysis. The last three columns are calculated by us. In the Table 1 z is the red shift, the difference between the length of the registered emission and emitted one related to the length of the emitted wave, temperatures T in keV from 2.2 to 14 keV, i.e. from to , bolometric luminosity W from 2 to 260 times 1037 W, the mass is from 0.2 to 8.77 times 44 21022 310 kg, the spectral radius in Mpc, 1 Mpc m. It was assumed that the gas velocities observed by the broadening of spectral lines are the thermal ones and the temperature can be restored from them as 2 3 p mU TkA , (18) Copyright © 2012 SciRes. JMP 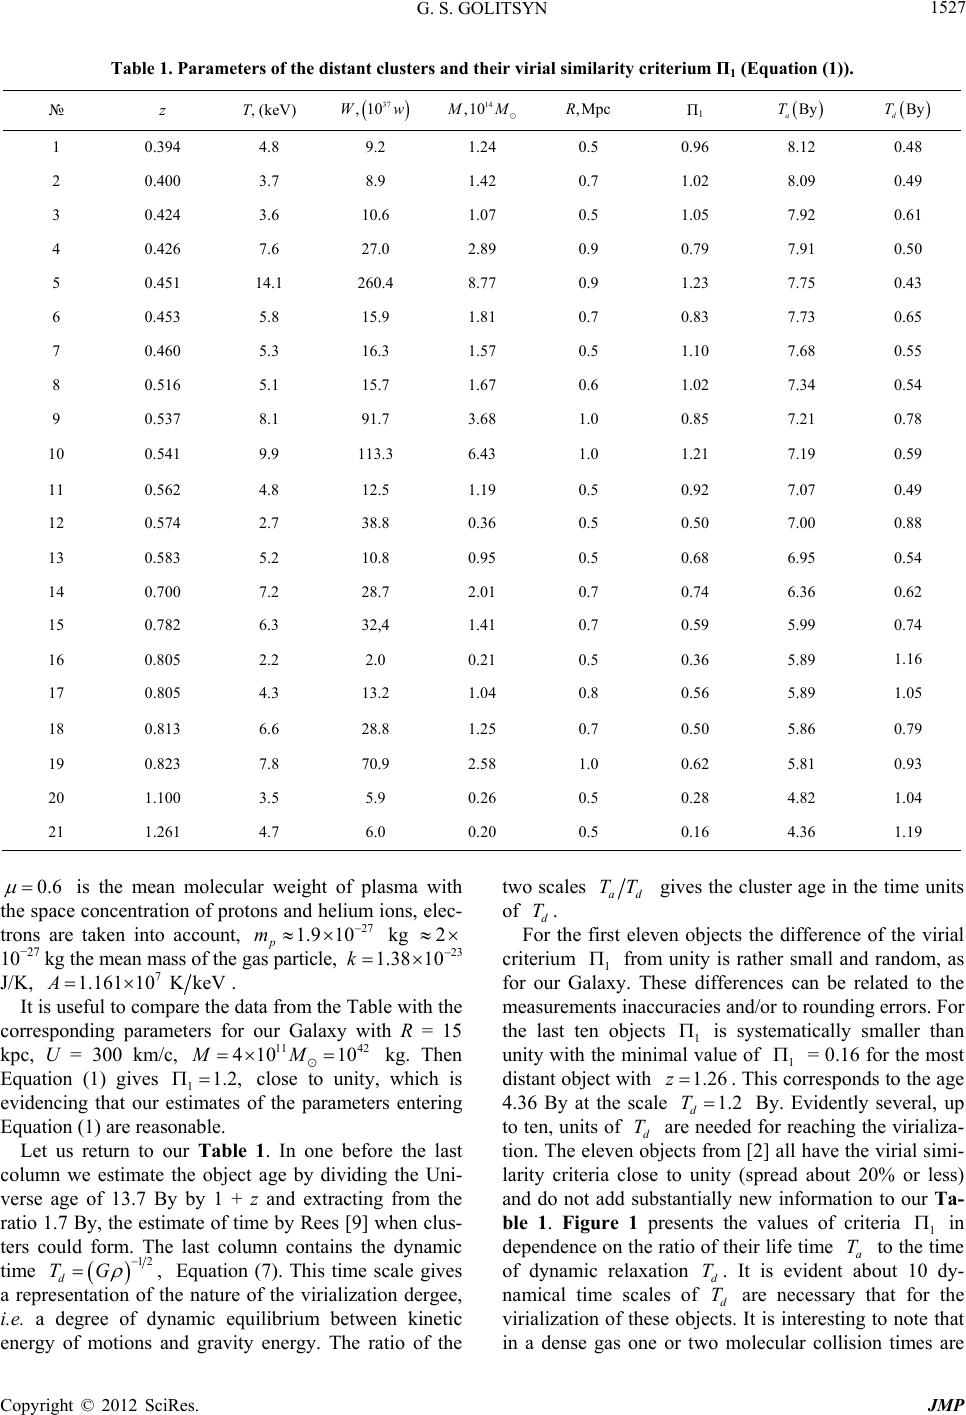 G. S. GOLITSYN ht © 2012 SciRes. JMP 1527 Table 1. Parameters of the distant clusters and their virial similarity criterium П1 (Equation (1)). № z T, (keV) 37 ,10Ww14 ,10 M M,MpcR П1 By a T By d T 1 0.394 4.8 9.2 1.24 0.5 0.96 8.12 0.48 2 0.400 3.7 8.9 1.42 0.7 1.02 8.09 0.49 3 0.424 3.6 10.6 1.07 0.5 1.05 7.92 0.61 4 0.426 7.6 27.0 2.89 0.9 0.79 7.91 0.50 5 0.451 14.1 260.4 8.77 0.9 1.23 7.75 0.43 6 0.453 5.8 15.9 1.81 0.7 0.83 7.73 0.65 7 0.460 5.3 16.3 1.57 0.5 1.10 7.68 0.55 8 0.516 5.1 15.7 1.67 0.6 1.02 7.34 0.54 9 0.537 8.1 91.7 3.68 1.0 0.85 7.21 0.78 10 0.541 9.9 113.3 6.43 1.0 1.21 7.19 0.59 11 0.562 4.8 12.5 1.19 0.5 0.92 7.07 0.49 12 0.574 2.7 38.8 0.36 0.5 0.50 7.00 0.88 13 0.583 5.2 10.8 0.95 0.5 0.68 6.95 0.54 14 0.700 7.2 28.7 2.01 0.7 0.74 6.36 0.62 15 0.782 6.3 32,4 1.41 0.7 0.59 5.99 0.74 16 0.805 2.2 2.0 0.21 0.5 0.36 5.89 1.16 17 0.805 4.3 13.2 1.04 0.8 0.56 5.89 1.05 18 0.813 6.6 28.8 1.25 0.7 0.50 5.86 0.79 19 0.823 7.8 70.9 2.58 1.0 0.62 5.81 0.93 20 1.100 3.5 5.9 0.26 0.5 0.28 4.82 1.04 21 1.261 4.7 6.0 0.20 0.5 0.16 4.36 1.19 Copyrig 0.6 27 1.9 10m 2 is the mean molecular weight of plasma with the space concentration of protons and helium ions, elec- trons are taken into account, p kg 23 1.38 10 10−27 kg the mean mass of the gas particle, k J/K, 7 10K keV1.161A 11 42 410 10MM . It is useful to compare the data from the Table with the corresponding parameters for our Galaxy with R = 15 kpc, U = 300 km/c, kg. Then Equation (1) gives 1 close to unity, which is evidencing that our estimates of the parameters entering Equation (1) are reasonable. 1.2, Let us return to our Table 1. In one before the last column we estimate the object age by dividing the Uni- verse age of 13.7 By by 1 + z and extracting from the ratio 1.7 By, the estimate of time by Rees [9] when clus- ters could form. The last column contains the dynamic time 12,TG d Equation (7). This time scale gives a representation of the nature of the virialization dergee, i.e. a degree of dynamic equilibrium between kinetic energy of motions and gravity energy. The ratio of the two scales ad TT T gives the cluster age in the time units of . d For the first eleven objects the difference of the virial criterium 1 from unity is rather small and random, as for our Galaxy. These differences can be related to the measurements inaccuracies and/or to rounding errors. For the last ten objects 1 is systematically smaller than unity with the minimal value of 1 = 0.16 for the most distant object with 1.26z . This corresponds to the age 4.36 By at the scale d1.2T By. Evidently several, up to ten, units of d are needed for reaching the virializa- tion. The eleven objects from [2] all have the virial simi- larity criteria close to unity (spread about 20% or less) and do not add substantially new information to our Ta- ble 1. Figure 1 presents the values of criteria 1 T in dependence on the ratio of their life time a to the time of dynamic relaxation . It is evident about 10 dy- namical time scales of d T are necessary that for the virialization of these objects. It is interesting to note that in a dense gas one or two molecular collision times are T d T 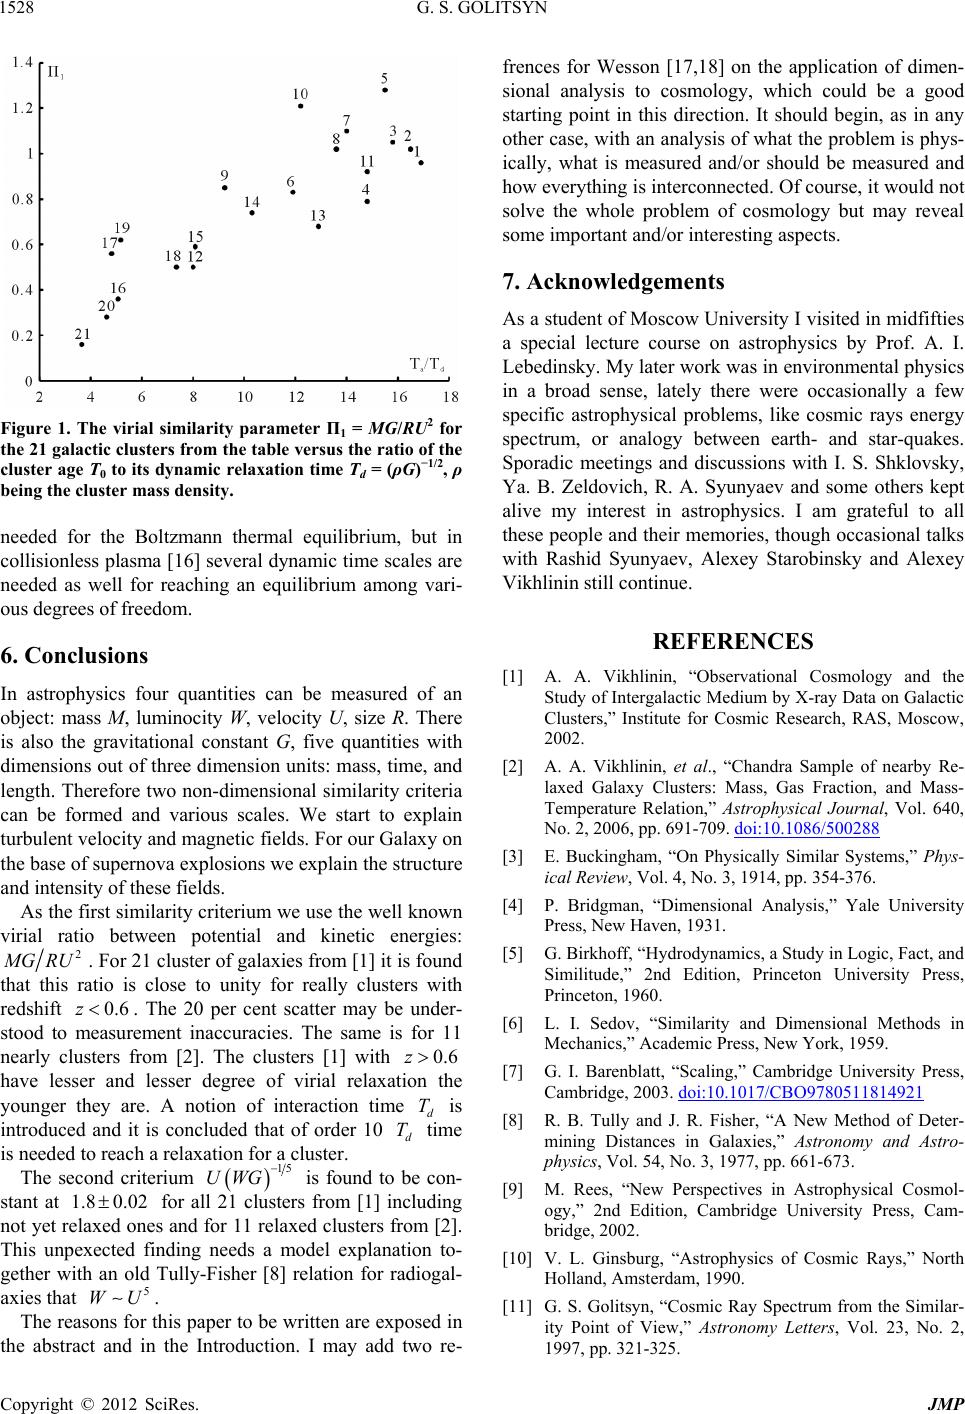 G. S. GOLITSYN 1528 Figure 1. The virial similarity parameter П1 = MG/RU2 for the 21 galactic clusters from the table versus the ratio of the cluster age T0 to its dynamic relaxation time Td = (ρG)−1/2, ρ being the cluster mass density. needed for the Boltzmann thermal equilibrium, but in collisionless plasma [16] several dynamic time scales are needed as well for reaching an equilibrium among vari- ous degrees of freedom. 6. Conclusions In astrophysics four quantities can be measured of an object: mass M, luminocity W, velocity U, size R. There is also the gravitational constant G, five quantities with dimensions out of three dimension units: mass, time, and length. Therefore two non-dimensional similarity criteria can be formed and various scales. We start to explain turbulent velocity and magnetic fields. For our Galaxy on the base of supernova explosions we explain the structure and intensity of these fields. As the first similarity criterium we use the well known virial ratio between potential and kinetic energies: 2 M GRU 0.6z z T d T . For 21 cluster of galaxies from [1] it is found that this ratio is close to unity for really clusters with redshift . The 20 per cent scatter may be under- stood to measurement inaccuracies. The same is for 11 nearly clusters from [2]. The clusters [1] with have lesser and lesser degree of virial relaxation the younger they are. A notion of interaction time d is introduced and it is concluded that of order 10 time is needed to reach a relaxation for a cluster. 0.6 The second criterium 15 UWG 1.8 is found to be con- stant at for all 21 clusters from [1] including not yet relaxed ones and for 11 relaxed clusters from [2]. This unpexected finding needs a model explanation to- gether with an old Tully-Fisher [8] relation for radiogal- axies that . 0.02 5 WU The reasons for this paper to be written are exposed in the abstract and in the Introduction. I may add two re- frences for Wesson [17,18] on the application of dimen- sional analysis to cosmology, which could be a good starting point in this direction. It should begin, as in any other case, with an analysis of what the problem is phys- ically, what is measured and/or should be measured and how everything is interconnected. Of course, it would not solve the whole problem of cosmology but may reveal some important and/or interesting aspects. 7. Acknowledgements As a student of Moscow University I visited in midfifties a special lecture course on astrophysics by Prof. A. I. Lebedinsky. My later work was in environmental physics in a broad sense, lately there were occasionally a few specific astrophysical problems, like cosmic rays energy spectrum, or analogy between earth- and star-quakes. Sporadic meetings and discussions with I. S. Shklovsky, Ya. B. Zeldovich, R. A. Syunyaev and some others kept alive my interest in astrophysics. I am grateful to all these people and their memories, though occasional talks with Rashid Syunyaev, Alexey Starobinsky and Alexey Vikhlinin still continue. REFERENCES [1] A. A. Vikhlinin, “Observational Cosmology and the Study of Intergalactic Medium by X-ray Data on Galactic Clusters,” Institute for Cosmic Research, RAS, Moscow, 2002. [2] A. A. Vikhlinin, et al., “Chandra Sample of nearby Re- laxed Galaxy Clusters: Mass, Gas Fraction, and Mass- Temperature Relation,” Astrophysical Journal, Vol. 640, No. 2, 2006, pp. 691-709. doi:10.1086/500288 [3] E. Buckingham, “On Physically Similar Systems,” Phys- ical Review, Vol. 4, No. 3, 1914, pp. 354-376. [4] P. Bridgman, “Dimensional Analysis,” Yale University Press, New Haven, 1931. [5] G. Birkhoff, “Hydrodynamics, a Study in Logic, Fact, and Similitude,” 2nd Edition, Princeton University Press, Princeton, 1960. [6] L. I. Sedov, “Similarity and Dimensional Methods in Mechanics,” Academic Press, New York, 1959. [7] G. I. Barenblatt, “Scaling,” Cambridge University Press, Cambridge, 2003. doi:10.1017/CBO9780511814921 [8] R. B. Tully and J. R. Fisher, “A New Method of Deter- mining Distances in Galaxies,” Astronomy and Astro- physics, Vol. 54, No. 3, 1977, pp. 661-673. [9] M. Rees, “New Perspectives in Astrophysical Cosmol- ogy,” 2nd Edition, Cambridge University Press, Cam- bridge, 2002. [10] V. L. Ginsburg, “Astrophysics of Cosmic Rays,” North Holland, Amsterdam, 1990. [11] G. S. Golitsyn, “Cosmic Ray Spectrum from the Similar- ity Point of View,” Astronomy Letters, Vol. 23, No. 2, 1997, pp. 321-325. Copyright © 2012 SciRes. JMP  G. S. GOLITSYN Copyright © 2012 SciRes. JMP 1529 [12] G. S. Golitsyn, “Phenomenological Explanation of the Spectrum of Cosmic Rays with Energies E > 10 GeV,” Astronomy Letters, Vol. 31, No. 7, 2005, pp. 500-505. [13] A. S. Monin and A. M. Yaglom. “Statistical Hydrody- namics,” Vol. 2. MIT Publishing, Cambrisge, 1975. [14] P. Frick and D. Sokolov, “Cascade and Dynamo Action in a Shell Model of Magnetohydrodynamic Turbulence,” Physical Review E, Vol. 57, No. 4, 1998, pp. 4155-4164. doi:10.1103/PhysRevE.57.4155 [15] J. W. Armstrong, J. M. Cordes and B. J. Rickert, “Density Power Spectrum in the Local Interstellar Medium,” Na- ture, Vol. 291, 1981, pp. 561-564. doi:10.1038/291561a0 [16] B. B. Kadomtsev, “Collective Phenomena in Plasma,” Fizmatlit Publishing House, Moscow, 1976. [17] P. Wesson, “Cosmology and Geophysics,” D. Reidel. Dordrecht, Holland, 1978. [18] P. Wesson, “The Application of Dimensional Analysis to Cosmology,” Space Science Reviews, Vol. 27, No. 2, 1980, pp. 109-153. doi:10.1007/BF00212237 |