

Paper Menu >>
Journal Menu >>
 Modern Economy, 2012, 3, 780-785 http://dx.doi.org/10.4236/me.2012.36099 Published Online October 2012 (http://www.SciRP.org/journal/me) Labor Productivity Parity vs Trend of Exchange Rate Marcin Jedrzejczyk Accounting Department, Cracow University of Economics, Cracow, Poland Email: [email protected] Received September 18, 2012; revised October 13, 2012; accepted October 20, 2012 ABSTRACT Translation, understood as a process of restating the value from a particular currency to another currency, is based on the market exchange rate. So in practice, almost every value in terms of goods, assets, liabilities, and wages is converted to US dollars according to the current exchange rate. A fundamental method of translation was originated by Balassa and Samuelson in 1964 who explained that the main driver of the exchange rate is productivity, which is higher in de- veloped countries and lower in poor countries. That is why these differences must be eliminated in order to make the exchange rate useful. However, different research verifying the Balassa-Samuelson approach, especially in the long run, had revealed some inconsistencies. Recently the Balassa-Samuelson theory has been enriched by more precise determi- nation of productivity; specifically, an appropriate ratio for the translation procedure has appeared labor productivity Q defined as quotient of real GDP to cost of labor. The main aim of the paper is to present statistical verification of labor productivity parity as the main driver of the exchange rate. In the research, there will be an estimation of parameters of linear function in which the dependent variable represents the average exchange rate for the period between a particular country and the USA, and the independent variable is the average hourly pay quotient modified by labor productivity parity. If the linear function parameters describe the y = x relation, the theory of labor productivity as the determinant of exchange rate behavior will be confirmed. Keywords: Exchange Rate; Labor Productivity; Conversion; Translation 1. Introduction Contemporary practice of the translation process is based on the exchange rate, understood as the equilibrium point on the foreign trade market between supply and demand for a particular currency. On the other hand, the ex- change rate could be defined as the relationship between two money units. In practice, one can go to the exchange and buy one US dollar for 3 Polish zlotys. In the analysis of the exchange rate behavior, scientists rarely explain the nature of the monetary unit, whose value mainly de- termines the rate of exchange between currencies. This relationship, however, is widely used in economic prac- tice by economists and practitioners to translate prices of goods, costs of living, wages, or in some cases GDP or GDP per capita. The dilemma we face is whether it is possible to use the relationship between two monetary units to the conversion of economic values and if the value received in this process can be treated as objective and fair. What is worth mentioning is that the consolidation process in the case of international capital groups uses the exchange rate to translate all assets, liabilities, reve- nues, and expenses to functional currency as stated in accounting standards IAS 21 and FAS 52. In the latest papers [1], it was proved that direct use of the exchange rate in the consolidation process is problematic and pro- duces misleading results. In everyday life, there are also some symptoms of misunderstanding the role and nature of the exchange rate. In the news we sometimes hear that the inhabitants of several poor countries must live on half a dollar a day. Could this be true, or has the wrong procedure of inter- national comparisons been applied? For reasonable eco- nomists, comparing remunerations with the direct use of the exchange rate does not produce any useful informa- tion. However, most people still use the exchange rate for this purpose, and what is worse, they formulate their wage expectations by multiplying the wages from abroad by the current market exchange rate. The direct use of the exchange rate can easily be re- futed through simple examples concerning two countries with different labor productivity. Let us consider two electrical engines with the same technical characteristics and same utility matters [2]. The chosen engines have power of 1.5 kW and are produced and sold in the US by Baldor Electric and in Poland by S. A. Tamel. The tech- nical data has been provided in Table 1. This example presented two electric engines, one pro- duced in Poland by Tamel Company and the other pro- C opyright © 2012 SciRes. ME 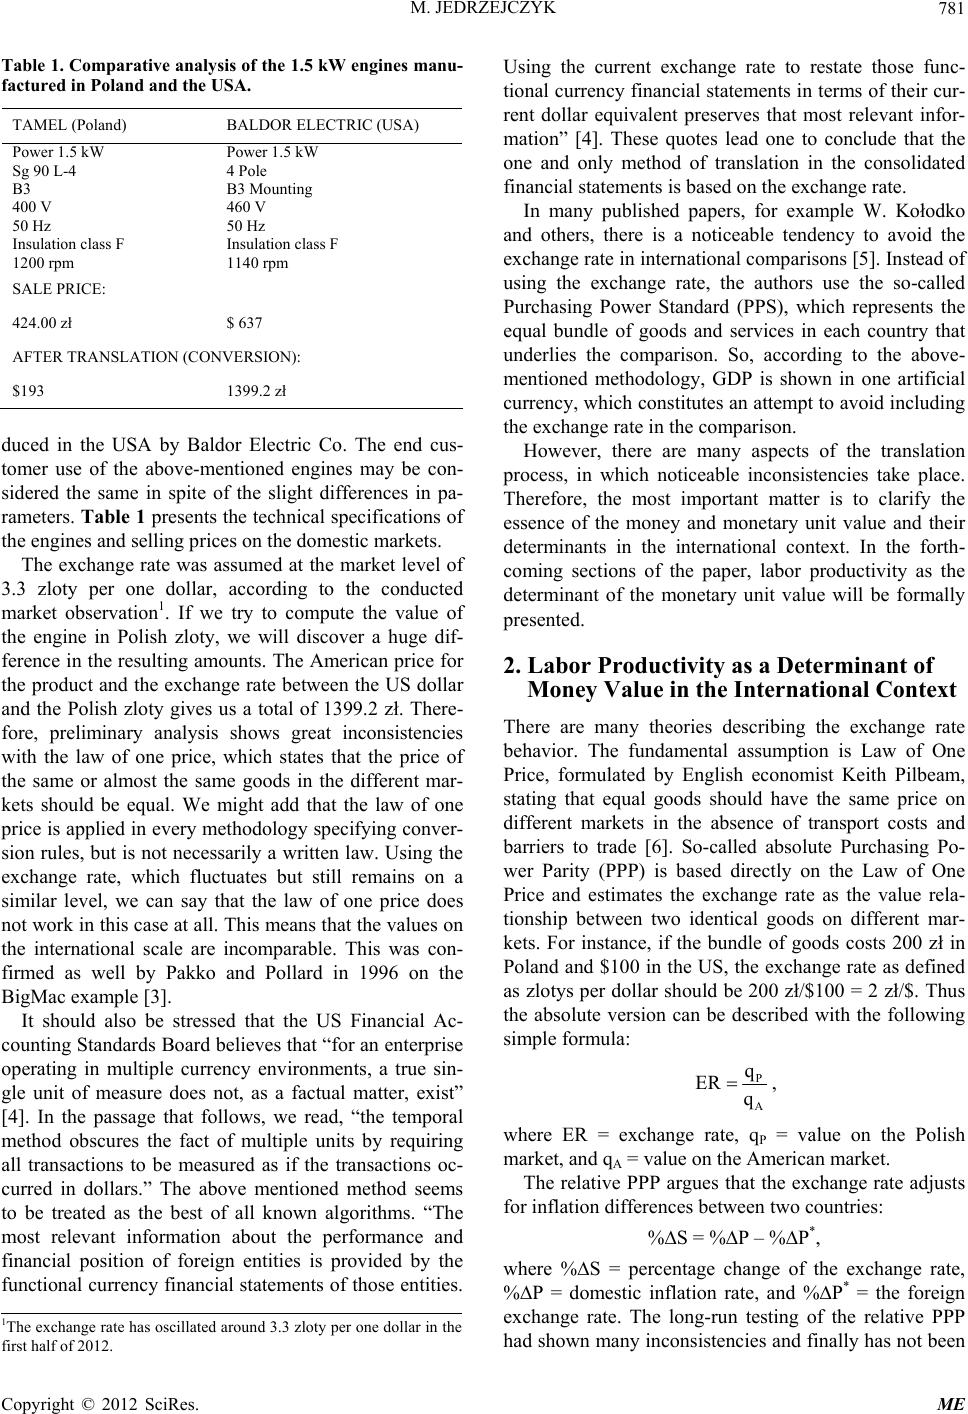 M. JEDRZEJCZYK 781 Table 1. Comparative analysis of the 1.5 kW engines manu- factured in Poland and the USA. TAMEL (Poland) BALDOR ELECTRIC (USA) Power 1.5 kW Sg 90 L-4 B3 400 V 50 Hz Insulation class F 1200 rpm Power 1.5 kW 4 Pole B3 Mounting 460 V 50 Hz Insulation class F 1140 rpm SALE PRICE: 424.00 zł $ 637 AFTER TRANSLATION (CONVERSION): $193 1399.2 zł duced in the USA by Baldor Electric Co. The end cus- tomer use of the above-mentioned engines may be con- sidered the same in spite of the slight differences in pa- rameters. Table 1 presents the technical specifications of the engines and selling prices on the domestic markets. The exchange rate was assumed at the market level of 3.3 zloty per one dollar, according to the conducted market observation1. If we try to compute the value of the engine in Polish zloty, we will discover a huge dif- ference in the resulting amounts. The American price for the product and the exchange rate between the US dollar and the Polish zloty gives us a total of 1399.2 zł. There- fore, preliminary analysis shows great inconsistencies with the law of one price, which states that the price of the same or almost the same goods in the different mar- kets should be equal. We might add that the law of one price is applied in every methodology specifying conver- sion rules, but is not necessarily a written law. Using the exchange rate, which fluctuates but still remains on a similar level, we can say that the law of one price does not work in this case at all. This means that the values on the international scale are incomparable. This was con- firmed as well by Pakko and Pollard in 1996 on the BigMac example [3]. It should also be stressed that the US Financial Ac- counting Standards Board believes that “for an enterprise operating in multiple currency environments, a true sin- gle unit of measure does not, as a factual matter, exist” [4]. In the passage that follows, we read, “the temporal method obscures the fact of multiple units by requiring all transactions to be measured as if the transactions oc- curred in dollars.” The above mentioned method seems to be treated as the best of all known algorithms. “The most relevant information about the performance and financial position of foreign entities is provided by the functional currency financial statements of those entities. Using the current exchange rate to restate those func- tional currency financial statements in terms of their cur- rent dollar equivalent preserves that most relevant infor- mation” [4]. These quotes lead one to conclude that the one and only method of translation in the consolidated financial statements is based on the exchange rate. In many published papers, for example W. Kołodko and others, there is a noticeable tendency to avoid the exchange rate in international comparisons [5]. Instead of using the exchange rate, the authors use the so-called Purchasing Power Standard (PPS), which represents the equal bundle of goods and services in each country that underlies the comparison. So, according to the above- mentioned methodology, GDP is shown in one artificial currency, which constitutes an attempt to avoid including the exchange rate in the comparison. However, there are many aspects of the translation process, in which noticeable inconsistencies take place. Therefore, the most important matter is to clarify the essence of the money and monetary unit value and their determinants in the international context. In the forth- coming sections of the paper, labor productivity as the determinant of the monetary unit value will be formally presented. 2. Labor Productivity as a Determinant of Money Value in the International Context There are many theories describing the exchange rate behavior. The fundamental assumption is Law of One Price, formulated by English economist Keith Pilbeam, stating that equal goods should have the same price on different markets in the absence of transport costs and barriers to trade [6]. So-called absolute Purchasing Po- wer Parity (PPP) is based directly on the Law of One Price and estimates the exchange rate as the value rela- tionship between two identical goods on different mar- kets. For instance, if the bundle of goods costs 200 zł in Poland and $100 in the US, the exchange rate as defined as zlotys per dollar should be 200 zł/$100 = 2 zł/$. Thus the absolute version can be described with the following simple formula: P A q ER q , where ER = exchange rate, qP = value on the Polish market, and qA = value on the American market. The relative PPP argues that the exchange rate adjusts for inflation differences between two countries: %∆S = %∆P – %∆P*, where %∆S = percentage change of the exchange rate, %∆P = domestic inflation rate, and %∆P* = the foreign exchange rate. The long-run testing of the relative PPP had shown many inconsistencies and finally has not been 1The exchange rate has oscillated around 3.3 zloty per one dollar in the first half of 2012. Copyright © 2012 SciRes. ME 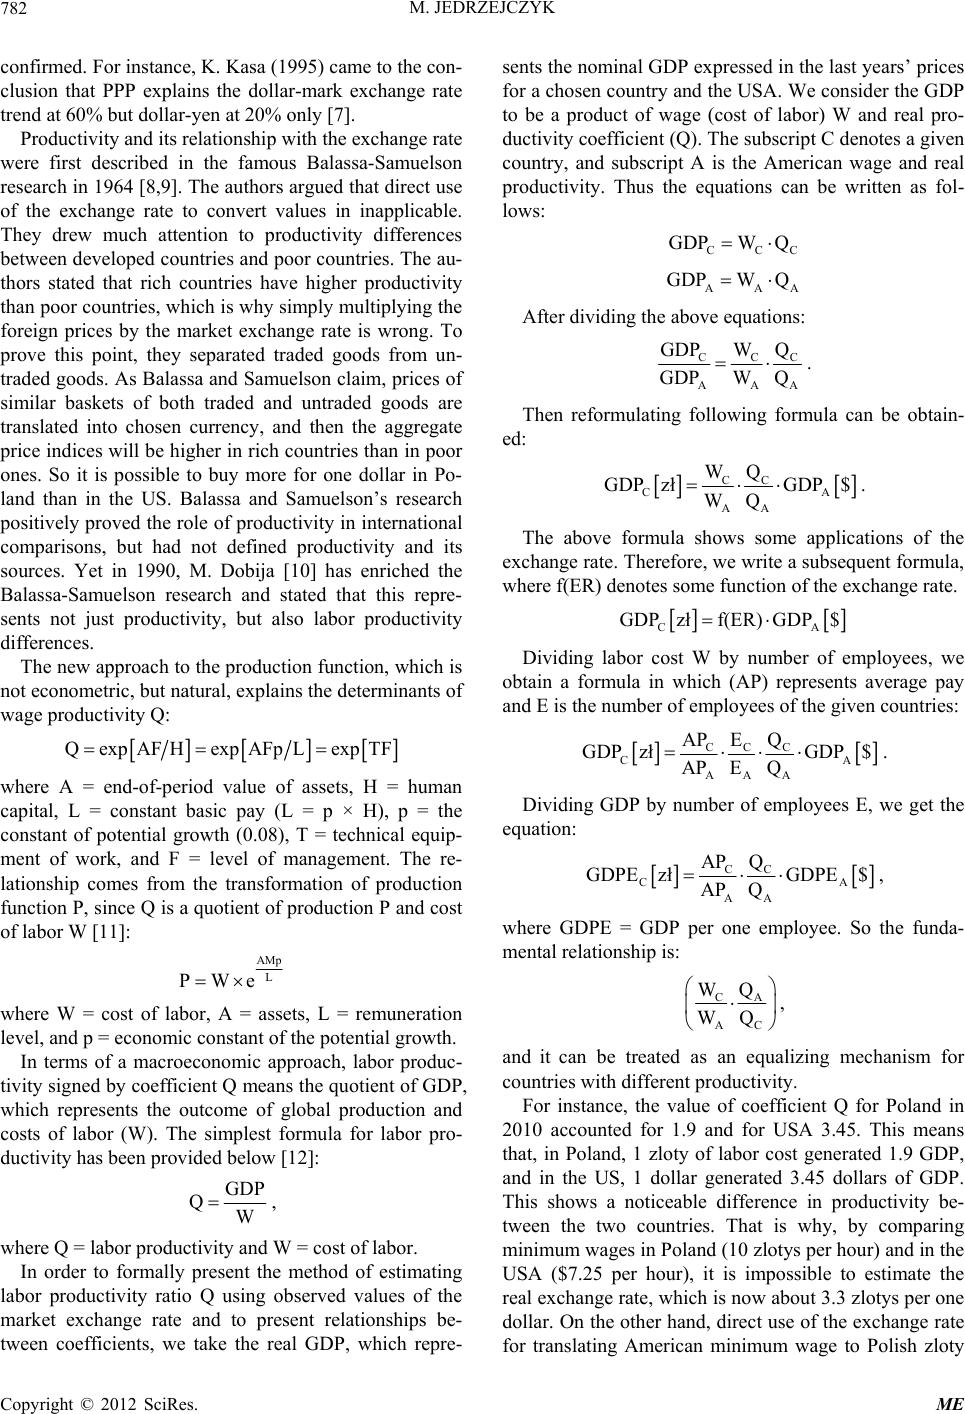 M. JEDRZEJCZYK 782 confirmed. For instance, K. Kasa (1995) came to the con- clusion that PPP explains the dollar-mark exchange rate trend at 60% but dollar-yen at 20% only [7]. Productivity and its relationship with the exchange rate were first described in the famous Balassa-Samuelson research in 1964 [8,9]. The authors argued that direct use of the exchange rate to convert values in inapplicable. They drew much attention to productivity differences between developed countries and poor countries. The au- thors stated that rich countries have higher productivity than poor countries, which is why simply multiplying the foreign prices by the market exchange rate is wrong. To prove this point, they separated traded goods from un- traded goods. As Balassa and Samuelson claim, prices of similar baskets of both traded and untraded goods are translated into chosen currency, and then the aggregate price indices will be higher in rich countries than in poor ones. So it is possible to buy more for one dollar in Po- land than in the US. Balassa and Samuelson’s research positively proved the role of productivity in international comparisons, but had not defined productivity and its sources. Yet in 1990, M. Dobija [10] has enriched the Balassa-Samuelson research and stated that this repre- sents not just productivity, but also labor productivity differences. The new approach to the production function, which is not econometric, but natural, explains the determinants of wage productivity Q: QexpAF HexpAFpLexp TF where A = end-of-period value of assets, H = human capital, L = constant basic pay (L = p × H), p = the constant of potential growth (0.08), T = technical equip- ment of work, and F = level of management. The re- lationship comes from the transformation of production function P, since Q is a quotient of production P and cost of labor W [11]: AMp L PWe where W = cost of labor, A = assets, L = remuneration level, and p = economic constant of the potential growth. In terms of a macroeconomic approach, labor produc- tivity signed by coefficient Q means the quotient of GDP, which represents the outcome of global production and costs of labor (W). The simplest formula for labor pro- ductivity has been provided below [12]: GDP QW CCC GDPW Q , where Q = labor productivity and W = cost of labor. In order to formally present the method of estimating labor productivity ratio Q using observed values of the market exchange rate and to present relationships be- tween coefficients, we take the real GDP, which repre- sents the nominal GDP expressed in the last years’ prices for a chosen country and the USA. We consider the GDP to be a product of wage (cost of labor) W and real pro- ductivity coefficient (Q). The subscript C denotes a given country, and subscript A is the American wage and real productivity. Thus the equations can be written as fol- lows: AAA GDPW Q After dividing the above equations: CCC AAA GDPW Q GDPW Q . Then reformulating following formula can be obtain- ed: CC CA AA WQ GDP złGDP $ WQ . The above formula shows some applications of the exchange rate. Therefore, we write a subsequent formula, where f(ER) denotes some function of the exchange rate. CA GDP złf(ER) GDP$ Dividing labor cost W by number of employees, we obtain a formula in which (AP) represents average pay and E is the number of employees of the given countries: CC C CA AA A AP EQ GDP złGDP $ AP EQ . Dividing GDP by number of employees E, we get the equation: CC CA AA AP Q GDPE złGDPE $ AP Q , where GDPE = GDP per one employee. So the funda- mental relationship is: CA AC WQ WQ , and it can be treated as an equalizing mechanism for countries with different productivity. For instance, the value of coefficient Q for Poland in 2010 accounted for 1.9 and for USA 3.45. This means that, in Poland, 1 zloty of labor cost generated 1.9 GDP, and in the US, 1 dollar generated 3.45 dollars of GDP. This shows a noticeable difference in productivity be- tween the two countries. That is why, by comparing minimum wages in Poland (10 zlotys per hour) and in the USA ($7.25 per hour), it is impossible to estimate the real exchange rate, which is now about 3.3 zlotys per one dollar. On the other hand, direct use of the exchange rate for translating American minimum wage to Polish zloty Copyright © 2012 SciRes. ME 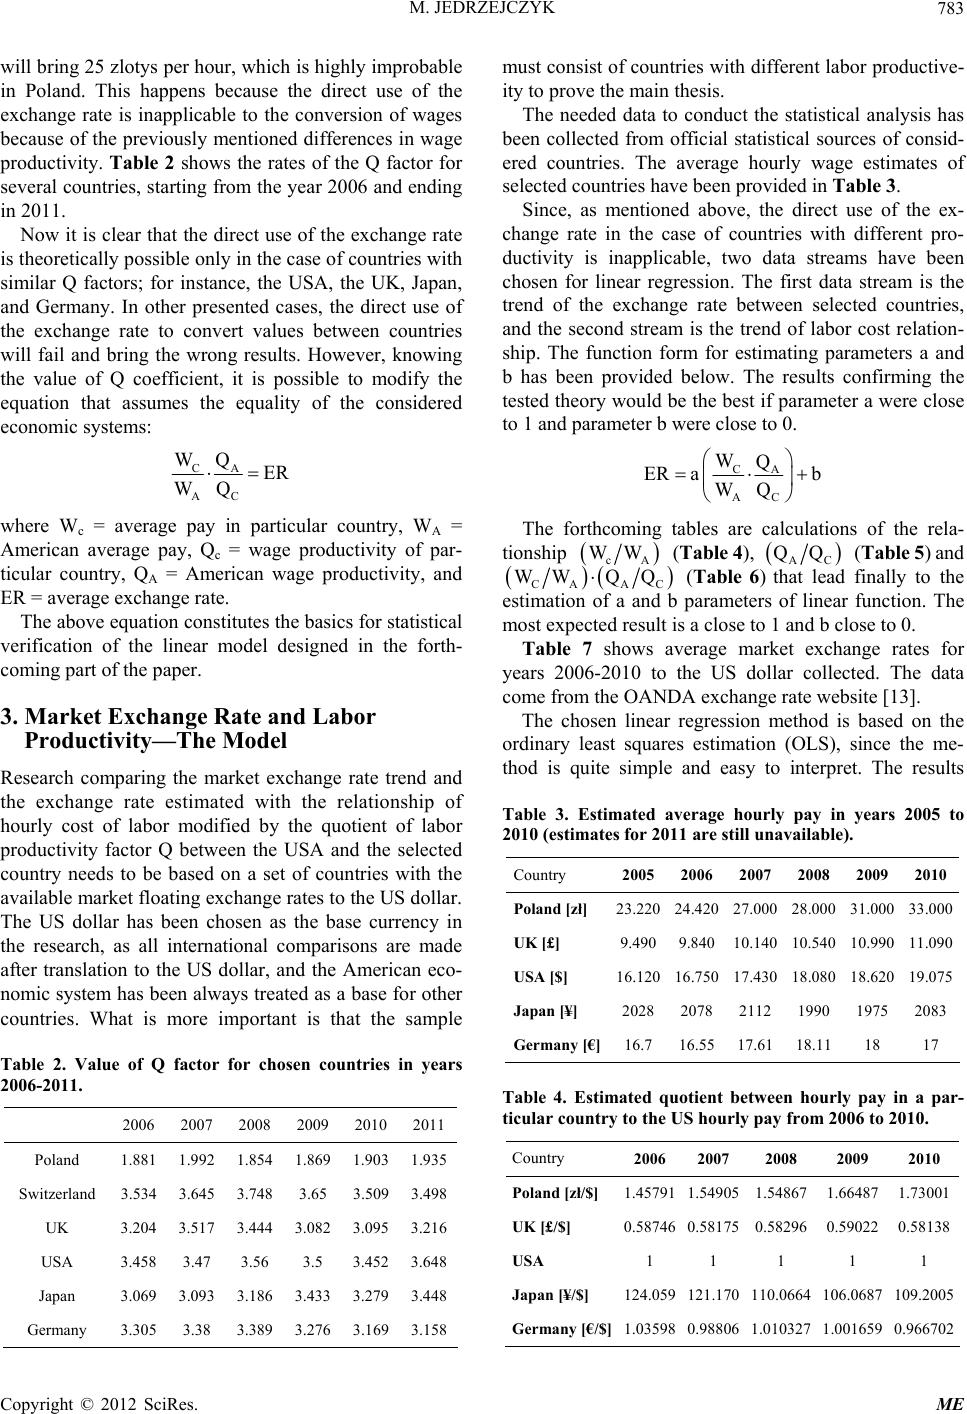 M. JEDRZEJCZYK 783 will bring 25 zlotys per hour, which is highly improbable in Poland. This happens because the direct use of the exchange rate is inapplicable to the conversion of wages because of the previously mentioned differences in wage productivity. Table 2 shows the rates of the Q factor for several countries, starting from the year 2006 and ending in 2011. Now it is clear that the direct use of the exchange rate is theoretically possible only in the case of countries with similar Q factors; for instance, the USA, the UK, Japan, and Germany. In other presented cases, the direct use of the exchange rate to convert values between countries will fail and bring the wrong results. However, knowing the value of Q coefficient, it is possible to modify the equation that assumes the equality of the considered economic systems: CA AC QER WQ W where Wc = average pay in particular country, WA = American average pay, Qc = wage productivity of par- ticular country, QA = American wage productivity, and ER = average exchange rate. The above equation constitutes the basics for statistical verification of the linear model designed in the forth- coming part of the paper. 3. Market Exchange Rate and Labor Productivity—The Model Research comparing the market exchange rate trend and the exchange rate estimated with the relationship of hourly cost of labor modified by the quotient of labor productivity factor Q between the USA and the selected country needs to be based on a set of countries with the available market floating exchange rates to the US dollar. The US dollar has been chosen as the base currency in the research, as all international comparisons are made after translation to the US dollar, and the American eco- nomic system has been always treated as a base for other countries. What is more important is that the sample Table 2. Value of Q factor for chosen countries in years 2006-2011. 2006 2007 2008 2009 2010 2011 Poland 1.881 1.992 1.854 1.869 1.903 1.935 Switzerland 3.534 3.645 3.748 3.65 3.509 3.498 UK 3.204 3.517 3.444 3.082 3.095 3.216 USA 3.458 3.47 3.56 3.5 3.4523.648 Japan 3.069 3.093 3.186 3.433 3.279 3.448 Germany 3.305 3.38 3.389 3.276 3.169 3.158 must consist of countries with different labor productive- ity to prove the main thesis. The needed data to conduct the statistical analysis has been collected from official statistical sources of consid- ered countries. The average hourly wage estimates of selected countries have been provided in Table 3. Since, as mentioned above, the direct use of the ex- change rate in the case of countries with different pro- ductivity is inapplicable, two data streams have been chosen for linear regression. The first data stream is the trend of the exchange rate between selected countries, and the second stream is the trend of labor cost relation- ship. The function form for estimating parameters a and b has been provided below. The results confirming the tested theory would be the best if parameter a were close to 1 and parameter b were close to 0. CA AC WQ ER ab WQ The forthcoming tables are calculations of the rela- tionship cA WW (Table 4), QQ AC (Table 5) and WWQQ CA AC (Table 6) that lead finally to the estimation of a and b parameters of linear function. The most expected result is a close to 1 and b close to 0. Table 7 shows average market exchange rates for years 2006-2010 to the US dollar collected. The data come from the OANDA exchange rate website [13]. The chosen linear regression method is based on the ordinary least squares estimation (OLS), since the me- thod is quite simple and easy to interpret. The results Table 3. Estimated average hourly pay in years 2005 to 2010 (estimates for 2011 are still unavailable). Country 2005 2006 2007 2008 2009 2010 Poland [zł] 23.220 24.420 27.000 28.000 31.000 33.000 UK [£] 9.4909.84010.140 10.540 10.990 11.090 USA [$] 16.120 16.750 17.430 18.080 18.620 19.075 Japan [¥] 2028 2078 2112 1990 1975 2083 Germany [€]16.716.55 17.61 18.11 18 17 Table 4. Estimated quotient between hourly pay in a par- ticular country to the US hourly pay from 2006 to 2010. Country 2006 2007 2008 2009 2010 Poland [zł/$] 1.457911.54905 1.54867 1.664871.73001 UK [£/$] 0.587460.58175 0.58296 0.590220.58138 USA 1 1 1 1 1 Japan [¥/$] 124.059 121.170 110.0664 106.0687 109.2005 Germany [€/$]1.03598 0.98806 1.010327 1.001659 0.966702 Copyright © 2012 SciRes. ME 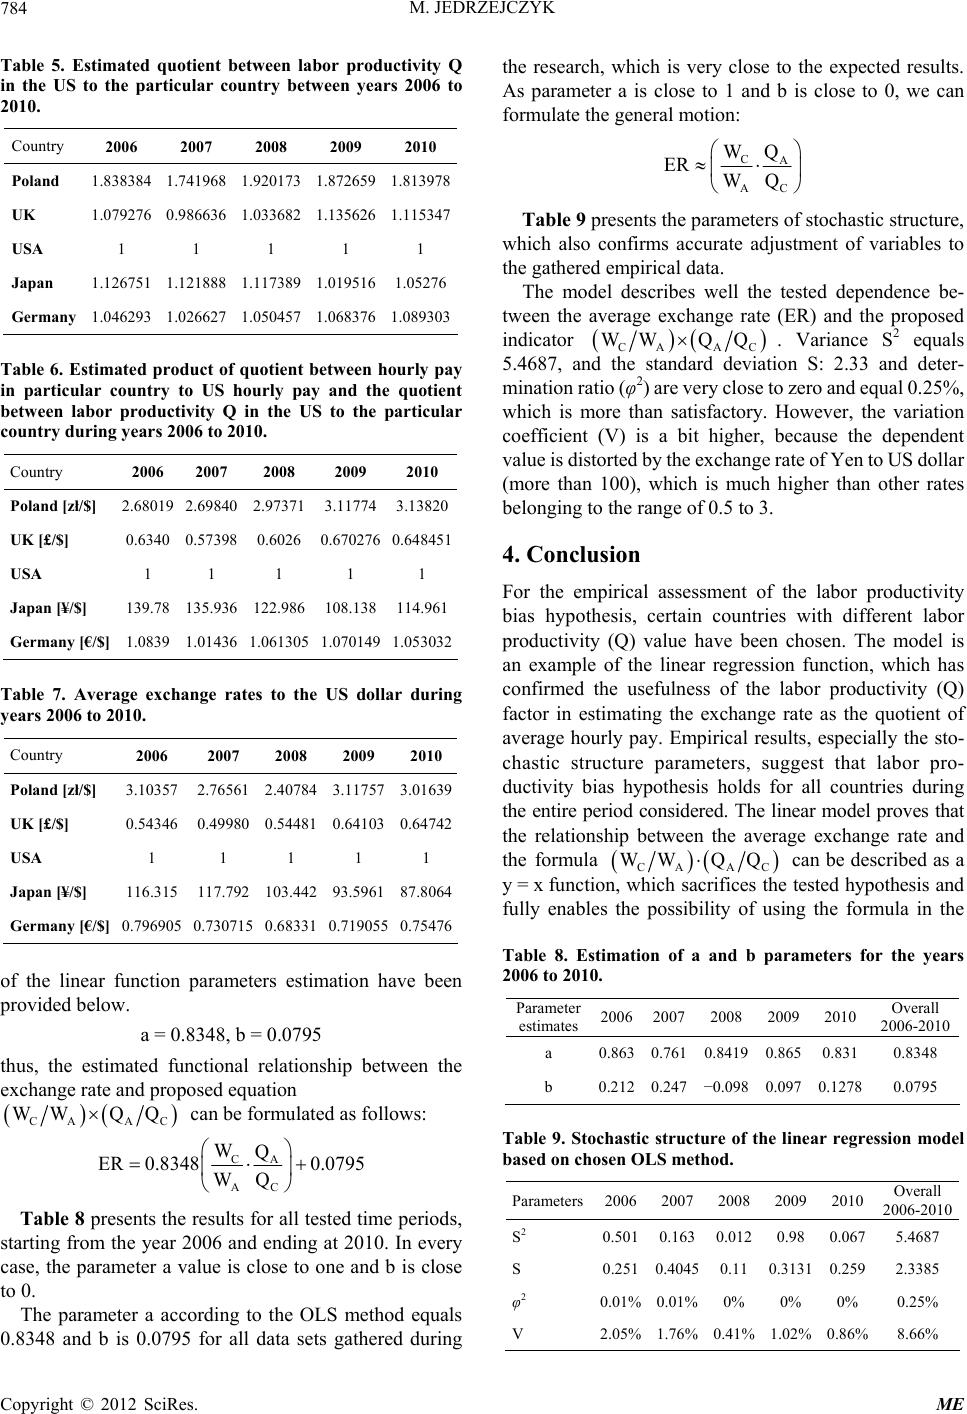 M. JEDRZEJCZYK 784 Table 5. Estimated quotient between labor productivity Q in the US to the particular country between years 2006 to 2010. Country 2006 2007 2008 2009 2010 Poland 1.838384 1.741968 1.920173 1.872659 1.813978 UK 1.079276 0.986636 1.033682 1.135626 1.115347 USA 1 1 1 1 1 Japan 1.126751 1.121888 1.117389 1.019516 1.05276 Germany 1.046293 1.026627 1.050457 1.068376 1.089303 Table 6. Estimated product of quotient between hourly pay in particular country to US hourly pay and the quotient between labor productivity Q in the US to the particular country during years 2006 to 2010. Country 2006 2007 2008 2009 2010 Poland [zł/$] 2.68019 2.698402.97371 3.11774 3.13820 UK [£/$] 0.6340 0.573980.6026 0.6702760.648451 USA 1 1 1 1 1 Japan [¥/$] 139.78 135.936 122.986 108.138 114.961 Germany [€/$] 1.0839 1.014361.061305 1.0701491.053032 Table 7. Average exchange rates to the US dollar during years 2006 to 2010. Country 2006 2007 2008 2009 2010 Poland [zł/$] 3.10357 2.765612.40784 3.117573.01639 UK [£/$] 0.54346 0.499800.54481 0.641030.64742 USA 1 1 1 1 1 Japan [¥/$] 116.315 117.792103.442 93.596187.8064 Germany [€/$] 0.796905 0.730715 0.68331 0.719055 0.75476 of the linear function parameters estimation have been provided below. a = 0.8348, b = 0.0795 thus, the estimated functional relationship between the exchange rate and proposed equation CA A Q C WWQ can be formulated as follows: C W ER0.8348 WQ A AC Q0.0795 Table 8 presents the results for all tested time periods, starting from the year 2006 and ending at 2010. In every case, the parameter a value is close to one and b is close to 0. The parameter a according to the OLS method equals 0.8348 and b is 0.0795 for all data sets gathered during the research, which is very close to the expected results. As parameter a is close to 1 and b is close to 0, we can formulate the general motion: CA AC WQ ER WQ Table 9 presents the parameters of stochastic structure, which also confirms accurate adjustment of variables to the gathered empirical data. The model describes well the tested dependence be- tween the average exchange rate (ER) and the proposed indicator WWQ Q CA AC . Variance S2 equals 5.4687, and the standard deviation S: 2.33 and deter- mination ratio (φ2) are very close to zero and equal 0.25%, which is more than satisfactory. However, the variation coefficient (V) is a bit higher, because the dependent value is distorted by the exchange rate of Yen to US dollar (more than 100), which is much higher than other rates belonging to the range of 0.5 to 3. 4. Conclusion For the empirical assessment of the labor productivity bias hypothesis, certain countries with different labor productivity (Q) value have been chosen. The model is an example of the linear regression function, which has confirmed the usefulness of the labor productivity (Q) factor in estimating the exchange rate as the quotient of average hourly pay. Empirical results, especially the sto- chastic structure parameters, suggest that labor pro- ductivity bias hypothesis holds for all countries during the entire period considered. The linear model proves that the relationship between the average exchange rate and the formula WWQ Q CA AC can be described as a y = x function, which sacrifices the tested hypothesis and fully enables the possibility of using the formula in the Table 8. Estimation of a and b parameters for the years 2006 to 2010. Parameter estimates 20062007 2008 2009 2010 Overall 2006-2010 a 0.8630.7610.8419 0.865 0.831 0.8348 b 0.2120.247−0.098 0.097 0.1278 0.0795 Table 9. Stochastic structure of the linear regression model based on chosen OLS method. Parameters2006 2007 2008 2009 2010 Overall 2006-2010 S2 0.5010.1630.012 0.98 0.067 5.4687 S 0.2510.40450.11 0.3131 0.259 2.3385 φ2 0.01%0.01%0% 0% 0% 0.25% V 2.05% 1.76% 0.41% 1.02% 0.86% 8.66% Copyright © 2012 SciRes. ME 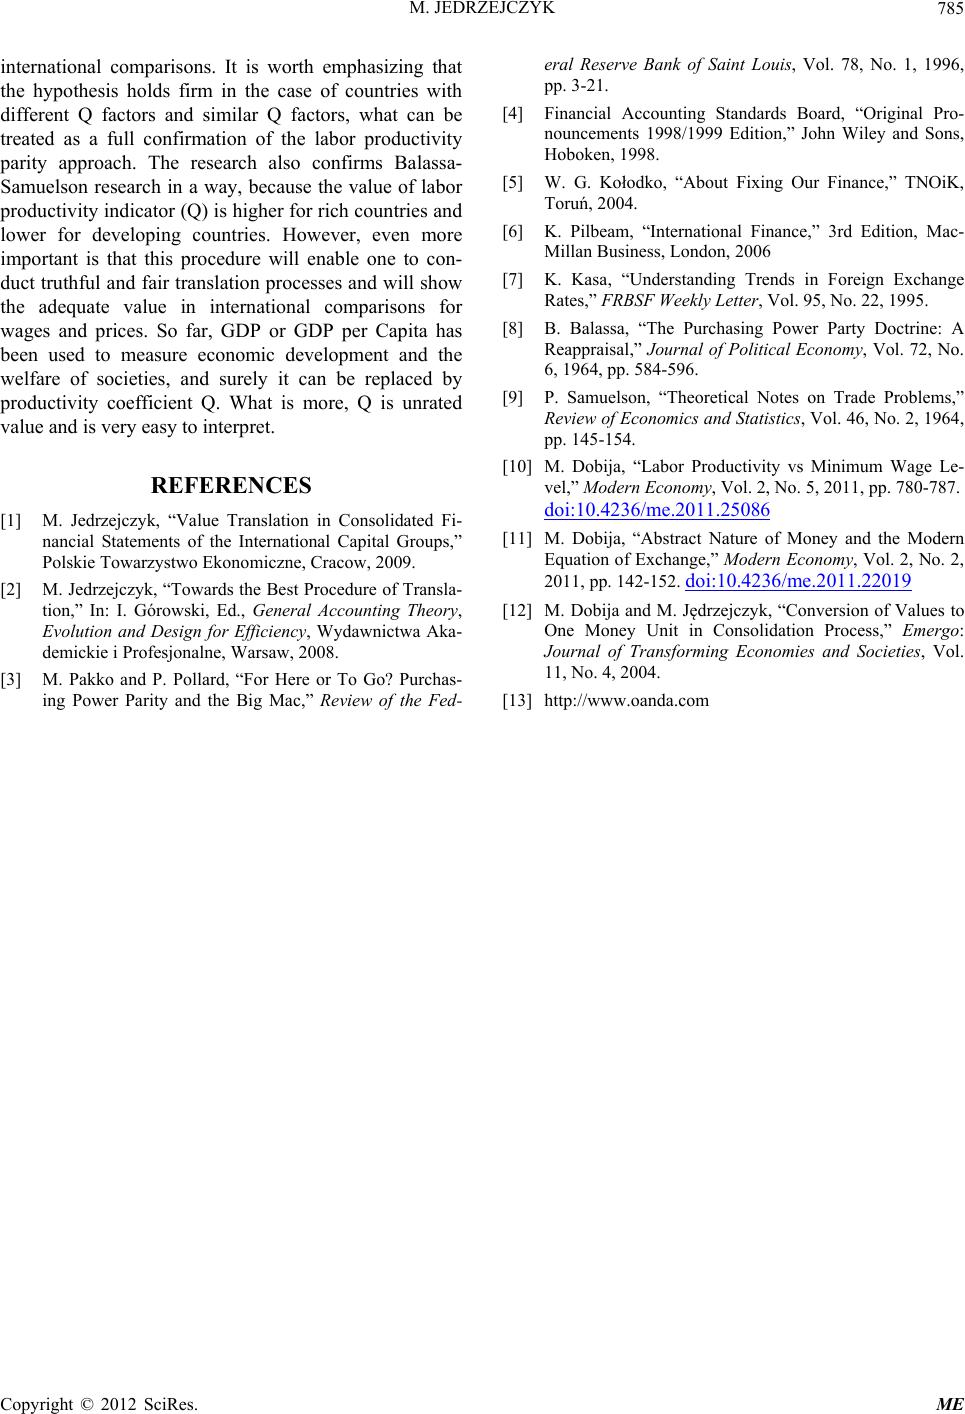 M. JEDRZEJCZYK Copyright © 2012 SciRes. ME 785 international comparisons. It is worth emphasizing that the hypothesis holds firm in the case of countries with different Q factors and similar Q factors, what can be treated as a full confirmation of the labor productivity parity approach. The research also confirms Balassa- Samuelson research in a way, because the value of labor productivity indicator (Q) is higher for rich countries and lower for developing countries. However, even more important is that this procedure will enable one to con- duct truthful and fair translation processes and will show the adequate value in international comparisons for wages and prices. So far, GDP or GDP per Capita has been used to measure economic development and the welfare of societies, and surely it can be replaced by productivity coefficient Q. What is more, Q is unrated value and is very easy to interpret. REFERENCES [1] M. Jedrzejczyk, “Value Translation in Consolidated Fi- nancial Statements of the International Capital Groups,” Polskie Towarzystwo Ekonomiczne, Cracow, 2009. [2] M. Jedrzejczyk, “Towards the Best Procedure of Transla- tion,” In: I. Górowski, Ed., General Accounting Theory, Evolution and Design for Efficiency, Wydawnictwa Aka- demickie i Profesjonalne, Warsaw, 2008. [3] M. Pakko and P. Pollard, “For Here or To Go? Purchas- ing Power Parity and the Big Mac,” Review of the Fed- eral Reserve Bank of Saint Louis, Vol. 78, No. 1, 1996, pp. 3-21. [4] Financial Accounting Standards Board, “Original Pro- nouncements 1998/1999 Edition,” John Wiley and Sons, Hoboken, 1998. [5] W. G. Kołodko, “About Fixing Our Finance,” TNOiK, Toruń, 2004. [6] K. Pilbeam, “International Finance,” 3rd Edition, Mac- Millan Business, London, 2006 [7] K. Kasa, “Understanding Trends in Foreign Exchange Rates,” FRBSF Weekly Letter, Vol. 95, No. 22, 1995. [8] B. Balassa, “The Purchasing Power Party Doctrine: A Reappraisal,” Journal of Political Economy, Vol. 72, No. 6, 1964, pp. 584-596. [9] P. Samuelson, “Theoretical Notes on Trade Problems,” Review of Economics and Statistics, Vol. 46, No. 2, 1964, pp. 145-154. [10] M. Dobija, “Labor Productivity vs Minimum Wage Le- vel,” Modern Economy, Vol. 2, No. 5, 2011, pp. 780-787. doi:10.4236 /me.2011.25086 [11] M. Dobija, “Abstract Nature of Money and the Modern Equation of Exchange,” Modern Economy, Vol. 2, No. 2, 2011, pp. 142-152. doi:10.4236/me.2011.22019 [12] M. Dobija and M. Jędrzejczyk, “Conversion of Values to One Money Unit in Consolidation Process,” Emergo: Journal of Transforming Economies and Societies, Vol. 11, No. 4, 2004. [13] http://www.oanda.com |