

Paper Menu >>
Journal Menu >>
 Modern Economy, 2012, 3, 759-765 http://dx.doi.org/10.4236/me.2012.36097 Published Online October 2012 (http://www.SciRP.org/journal/me) A Research on Interbank Loan Interest Rate Fluctuation Characteristics and the VaR Risk of China’s Commercial Banks Baoqian Wang, Cheng Wang, Xikun Zhang Business School, Hohai University, Nanjing, China Email: [email protected], hhucwa[email protected], [email protected] Received June 20, 2012; revised July 22, 2012; accepted August 1, 2012 ABSTRACT According to the historical time series data of commercial interbank, this paper examines the interest rate fluctuation distribution characteristics, indicating that EGARCH Model can b etter fit the rate volatility of th e interbank market in- terest. This paper calculates the value at risk (VaR) of five major commercial banks using EGARCH Model with such a conclusion that the difference that major commercial banks face is various. The interest risk of state-owned commercial banks and other financial institutions is more serious than the city commercial banks and foreign banks. The interest risk of rural credit cooperatives is the least serious. Keywords: GARCH Model; Interest Rate; VaR 1. Introduction Since 1996, the speed of China’s market interest rate process put fast gradually, letting go the interest rate of the inter-bank market interest treasury bonds and policy financial bonds. Domestic and foreign currency loans and large foreign currency deposit rates are also involved. Long-term RMB large deposit agreement is available and at the same time china gradually expands the floating range of RMB deposit and lending rates. With the market operation of china’s interest rate, the issue of interest rate risk measurement and management has become unavoi- dable. By using statistical knowledge and VaR model, this paper analyzes China’s interest rate market risk dis- tribution patterns and quantifies the interest rate risk of commercial banks in China. 2. Literature Review Since 1978, china’s commercial banks have experienced a series of management system reforms. But before 1993, commercial bank interest rate has always been under control, never out of the planned economic system. In this period, domestic focus is on the research of the regulation of commercial bank interest rate. Huang Jian- feng (2001) systematically expounds on the normative operations of the commercial bank deposit and loan in- terest rate [1]. Ge Qi (2003) systematically introduces foreign measurements and management methods on in- terest rates. In practice, he actively explores the advanced technologies and methods to be used in commercial banks’ interest rate risk management approach [2]. Dai Guoqiang (2005) uses the VaR method, the stochastic analysis method and the option pricing method to put forward the choice of benchmark interest rate of china’s commercial banks, together with the interest rate trend forecast in order to effectively control the interest rate risk, and enhance their own competitiveness [3]. China’s interbank market interest rate research begins relatively late. In the early days; it is primarily based on qualitative analysis, but in recent years it terms into quantitative analysis. Tang Qiming and Gao Xiang (2002): interbank market interest rate of different terms is in line with the expectations of interest rate term structure theory [4]. Xu Hanfei (2004): by using ECM model, Xu studies the transmission mechanism of central bank loan interest rate to interbank loan interest rate transmission, and finds that the transmission mechanism is asymmetric and dynamic, and the adjustment that cen- tral bank transmits to refinancing interest rate is only about 60% direct conducted to the inter-bank market interest rates [5]. Lin Hai, Zheng Zhenlong (2003): by integrating Vasicek model and CIR model into GARCH model, Lin and Zhang discusses china’s interest rates, but they don’t give a further research on rate volatility [6]. Dong Le (2006): Dong validates the dual asymmetry of china’s short-term interest rate in terms of mean ve- locity and the conditio nal variance. He gives the features that the correlation coefficient of the inter-bank market C opyright © 2012 SciRes. ME 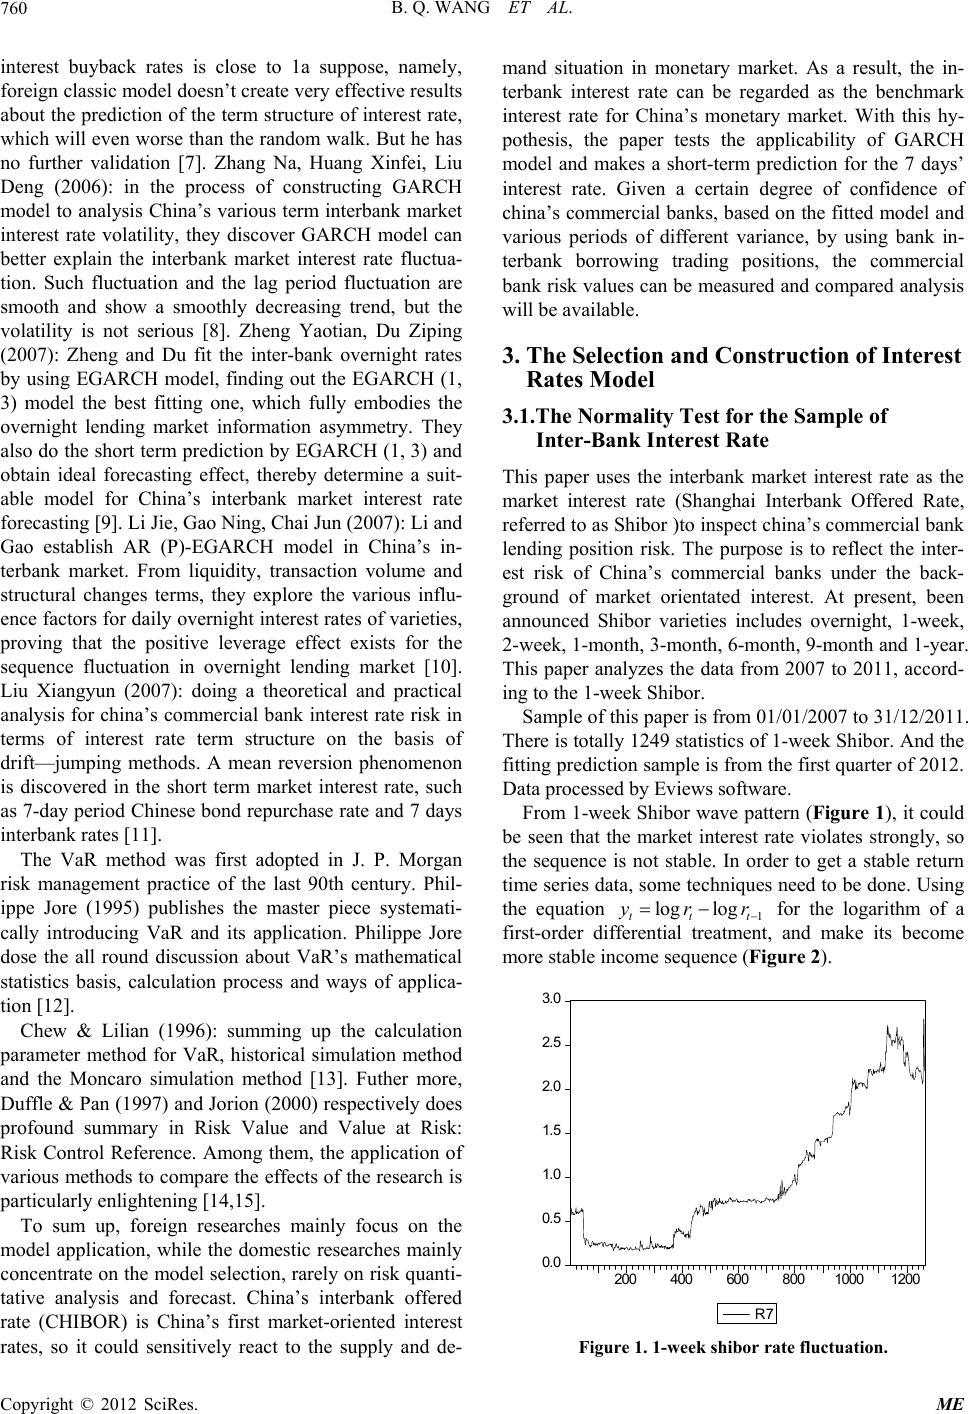 B. Q. WANG ET AL. 760 interest buyback rates is close to 1a suppose, namely, foreign classic model doesn’t create very effective results about the prediction of the term structure of interest rate, which will even worse than the random walk. But he has no further validation [7]. Zhang Na, Huang Xinfei, Liu Deng (2006): in the process of constructing GARCH model to analysis China’s various term interbank market interest rate volatility, they discover GARCH model can better explain the interbank market interest rate fluctua- tion. Such fluctuation and the lag period fluctuation are smooth and show a smoothly decreasing trend, but the volatility is not serious [8]. Zheng Yaotian, Du Ziping (2007): Zheng and Du fit the inter-bank overnight rates by using EGARCH model, finding out the EGARCH (1, 3) model the best fitting one, which fully embodies the overnight lending market information asymmetry. They also do the short term prediction by EGARCH (1, 3) and obtain ideal forecasting effect, thereby determine a suit- able model for China’s interbank market interest rate forecasting [9]. Li Jie, Gao Ning, Chai Jun (2007): Li and Gao establish AR (P)-EGARCH model in China’s in- terbank market. From liquidity, transaction volume and structural changes terms, they explore the various influ- ence factors for daily overnight interest rates of varieties, proving that the positive leverage effect exists for the sequence fluctuation in overnight lending market [10]. Liu Xiangyun (2007): doing a theoretical and practical analysis for china’s commercial bank interest rate risk in terms of interest rate term structure on the basis of drift—jumping methods. A mean reversion phenomenon is discovered in the short term market interest rate, such as 7-day period Chinese bond repurchase rate and 7 days interbank rates [11 ]. The VaR method was first adopted in J. P. Morgan risk management practice of the last 90th century. Phil- ippe Jore (1995) publishes the master piece systemati- cally introducing VaR and its application. Philippe Jore dose the all round discussion about VaR’s mathematical statistics basis, calculation process and ways of applica- tion [12]. Chew & Lilian (1996): summing up the calculation parameter method for VaR, historical simulation method and the Moncaro simulation method [13]. Futher more, Duffle & Pan (1 997) and Jorion (200 0) respectively does profound summary in Risk Value and Value at Risk: Risk Control Reference. Among them, the application of various methods to compare the effects of the research is particularly enlightening [14,15]. To sum up, foreign researches mainly focus on the model application, while the domestic researches mainly concentrate on the model selection , rarely on risk quanti- tative analysis and forecast. China’s interbank offered rate (CHIBOR) is China’s first market-oriented interest rates, so it could sensitively react to the supply and de- mand situation in monetary market. As a result, the in- terbank interest rate can be regarded as the benchmark interest rate for China’s monetary market. With this hy- pothesis, the paper tests the applicability of GARCH model and makes a short-term prediction for the 7 days’ interest rate. Given a certain degree of confidence of china’s commercial banks, based on the fitted model an d various periods of different variance, by using bank in- terbank borrowing trading positions, the commercial bank risk values can be measured and compared analysis will be available. 3. The Selection and Construction of Interest Rates Model 3.1.The Normality Test for the Sample of Inter-Bank Interest Rate This paper uses the interbank market interest rate as the market interest rate (Shanghai Interbank Offered Rate, referred to as Shibor )to inspect china’s commercial bank lending position risk. The purpose is to reflect the inter- est risk of China’s commercial banks under the back- ground of market orientated interest. At present, been announced Shibor varieties includes overnight, 1-week, 2-week, 1-month, 3-month, 6-month, 9-month and 1-year. This paper analyzes the data from 2007 to 2011, accord- ing to the 1-week Sh ibor. Sample of this paper is from 01/01/2007 to 31/12/2011. There is totally 1249 statistics of 1 -week Shib or. And the fitting prediction sample is from the first quarter of 2012. Data processed by Eviews software. From 1-week Shibor wave pattern (Figure 1), it could be seen that the market interest rate violates strongly, so the sequence is not stable. In order to get a stable return time series data, some techniques need to be done. Using the equation 1t log log tt yrr for the logarithm of a first-order differential treatment, and make its become more stable income sequence (Figure 2). 0.0 0.5 1.0 1.5 2.0 2.5 3. 0 200 400 600 8001000 1200 R7 Figure 1. 1-week shibor rate fluctuation. Copyright © 2012 SciRes. ME 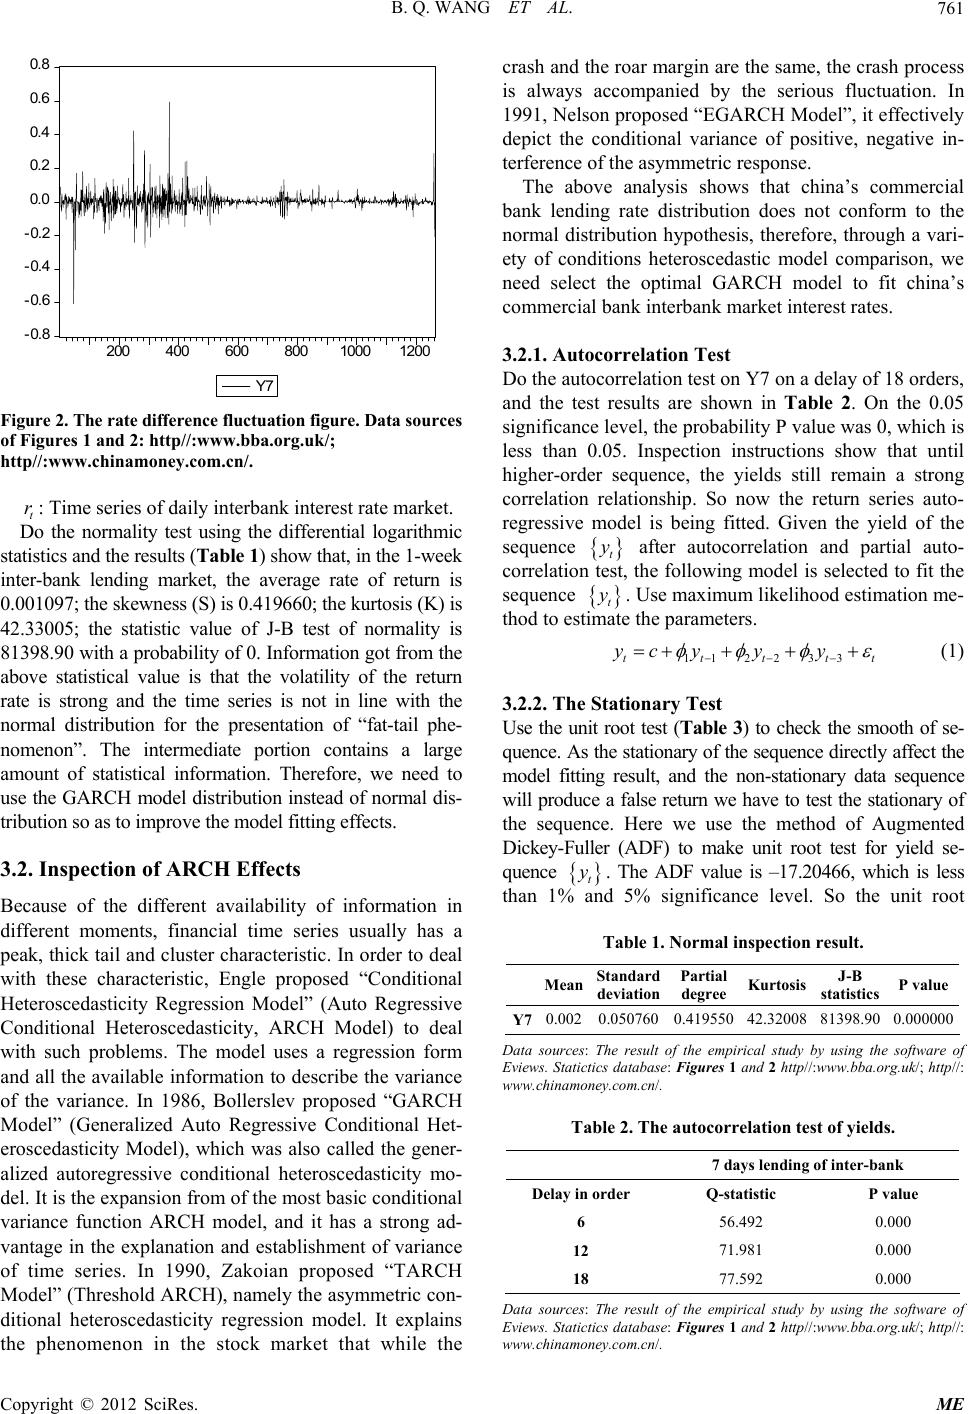 B. Q. WANG ET AL. 761 -0.8 -0.6 -0.4 -0.2 0.0 0.2 0.4 0.6 0.8 200 400 600 800 1000 1200 Y7 Figure 2. The rate difference fluct uation f i gure. Data sources : Time series of daily interbank interest rate market. st 3.2. Inspection of ARCH Effects of information in ina’s commercial ba 3.2.1. Autocorrel at i on Test Y7 on a delay of 18 orders, of Figures 1 and 2: http//:www.bba.org.uk/; http//:www.chinamoney.com.cn/. t r Do the normality test using the differential logarithmic atistics and the results (Table 1) show that, in the 1-week inter-bank lending market, the average rate of return is 0.001097; the skewness (S) is 0.419 660; t he k urt osi s (K) i s 42.33005; the statistic value of J-B test of normality is 81398.90 with a probability of 0. Information got from the above statistical value is that the volatility of the return rate is strong and the time series is not in line with the normal distribution for the presentation of “fat-tail phe- nomenon”. The intermediate portion contains a large amount of statistical information. Therefore, we need to use the GARCH model distribution instead of normal dis- tribution so as to im prove the model fitting effect s. Because of the different availability different moments, financial time series usually has a peak, thick tail and cluster characteristic. In order to deal with these characteristic, Engle proposed “Conditional Heteroscedasticity Regression Model” (Auto Regressive Conditional Heteroscedasticity, ARCH Model) to deal with such problems. The model uses a regression form and all the available in formation to describe the variance of the variance. In 1986, Bollerslev proposed “GARCH Model” (Generalized Auto Regressive Conditional Het- eroscedasticity Model), which was also called the gener- alized autoregressive conditional heteroscedasticity mo- del. It is the expansion from of the most basic conditional variance function ARCH model, and it has a strong ad- vantage in the explanation and establishment of variance of time series. In 1990, Zakoian proposed “TARCH Model” (Threshold ARCH), namely the asymmetric con- ditional heteroscedasticity regression model. It explains the phenomenon in the stock market that while the crash and the roar margin are the same, the crash process is always accompanied by the serious fluctuation. In 1991, Nelson propo sed “EGARCH Model”, it ef fectively depict the conditional variance of positive, negative in- terference of the asymmetric response. The above analysis shows that ch nk lending rate distribution does not conform to the normal distribution hypothesis, therefore, through a vari- ety of conditions heteroscedastic model comparison, we need select the optimal GARCH model to fit china’s commercial bank interb ank market interest rates. Do the autoco rr elatio n test on and the test results are shown in Table 2. On the 0.05 significance level, th e probability P valu e was 0, which is less than 0.05. Inspection instructions show that until higher-order sequence, the yields still remain a strong correlation relationship. So now the return series auto- regressive model is being fitted. Given the yield of the sequence t y after autocorrelation and partial auto- correlation the following model is selected to fit the sequence test, t y . Use maximum likelihood estimation me- thod to est the parameters. 112 2 yc yy imate 33tttt y t (1) 3.2.2. The Stationary Test 3) to check the smooth of se-Use the unit root test (Table quence. As the stationary of the sequence directly affect the model fitting result, and the non-stationary data sequence will produce a false return we have to test the stationary of the sequence. Here we use the method of Augmented Dickey-Fuller (ADF) to make unit root test for yield se- quence t y . The ADF value is –17.20466, which is less than 1% 5% significance level. So the unit root and Table 1. Normal inspection result. Mean Kurtosis st P value Standard Partial J-B deviation degree atistics Y7 0 0.0020.050760.41955042.32008 81398.900.000000 D sof Table 2. The autocorrelation test of yields. ata ources: The result f the empirical study by using the software o Eviews. Statictics database: Figures 1 and 2 http//:www.bba.org.uk/; http//: www.chinamoney.com.cn/. 7 days lending of inter-bank Delay in order e Q-statistic P valu 6 56.492 0.000 12 71.981 0.000 18 77.592 0.000 Data sour result of the estudy by using are of ces: Thempirical the softw Eviews. Statictics database: Figures 1 and 2 http//:www.bba.org.uk/; http//: www.chinamoney.com.cn/. Copyright © 2012 SciRes. ME  B. Q. WANG ET AL. 762 hypothesis are rejected by the test values, indicating that the sequence of yield t y is a stationary sequence. 3.2.3. ARC H T e st In order to see whether the Conditional Heteroscedastic exists in the return series t y , the paper uses Lagrange multiplier method to do thst. Make a 3 lag ARCH effect test for the residuals of the regression equation, and from the test results (Table 4), we could see that the F-statistic and the LM-statistic probability value is rela- tively 0.000227 and 0.000241, less than 0.05. The origi- nal assumptions rejected hence ARCH effect exists in the model. 3.3. Int e te erest Rate Model Selection nd TARCH mo- t Compare ARCH, GARCH, EGARCH a del in terms of the residuals, depending on the Akaike Information Criterion (AIC), Schwarz (SC) guidelines and the LL principle of maximum likelihood function value, and hence select the most suitable model. The modeling process: select the inter-bank lending of 1249 continuous-time series data and compare the re- siduals of ARCH (1), GARCH (1, 1), TGARCH (1, 1) and EGERCH (1, 1) (Appendix 1). The appendix shows the AIC and SC of EGARCH (2, 1) is the smallest; the LL value of TGARCH (1, 1) is smaller than EGARCH (2, 2); the fitting coefficients of EGARCH (2, 1) are higher than TGARCH (1, 1). Consider the overall results; EGARCH (2, 1) model is selected to fit the inter-bank interbank of fer ed rat e seque n ce According to the results of fitting model, the 7-day in- ter-bank lending yield model is: 0.11742 t y2 9t y (2) Table 3. The unit root test results. alue ADF statistics Critical v 1% –3.4384 5% –2.8643 Inter-bank 7 day lending –17.20466 10%–2.5682 Data sources: The result of the empirical studyng e of Eviews. Statictics database: Figures 1 and 2 http//:www.bba.org.uk/; http//: 4. ARCH effect test. by usithe softwar www.chinamoney.com.cn/. Table ARCH Test F-stat 20709 P 0.000227 istics 4.8 Inter-bank 7 day lending L M-statistics23.76079 P 0.000241 Da reicasthf Eviews. Statictics database: Figures 1 and 2 http//: www.bba.org.uk/; http//: ta sources: The sult of the empirl study by uing e software o www.chinamoney.com.cn/. 1 log0.642986 0.947445log tt hh 12 12 2 2 0.647886 0.125999 0.110117 tt tt t t hh h (3) Do the ARCH effect test for the above model, and the accom lly panied probability of the F-statistics and LM are bigger than 0.05. Test results indicate that the model can be accepted for there is not any Conditional Heterosce- dastic. In order to further empirically test the validity of EGARCH (2, 1) model, we selected 72 data of inter-bank lending ra te from January to March of 2012 to make p re- diction. Compare the pred ictive value with the true value (Figure 3). From the prediction results, we could see that the predicted rates fluctuate around the real rates, and the margin between them is very small. The trend of the fit- ted curve is in line with the real rates curve, and the pre- diction error is very small which also shows the applica- bility of the model. Consequently, EGARCH (2, 1) pre- diction is applicable in the lending and borrowing inter- est rate risk management of china’s commercial banks. 4. VaR Estimation of China’s Commercial Banks The size of commercial bank interest rate risk is usua measured by the value at risk VaR. The so-called value at risk is the maximum possible loss given a certain confi- dence interval and time interval. The equation is (given confidence level ): VaR WEr r 0 (4) In the equation, means the init cial asset or 0 W ial value of a finan- portfolio; Er means the expected rate of Figure 3. Predictive value compared with the actual val- ues. Copyright © 2012 SciRes. ME 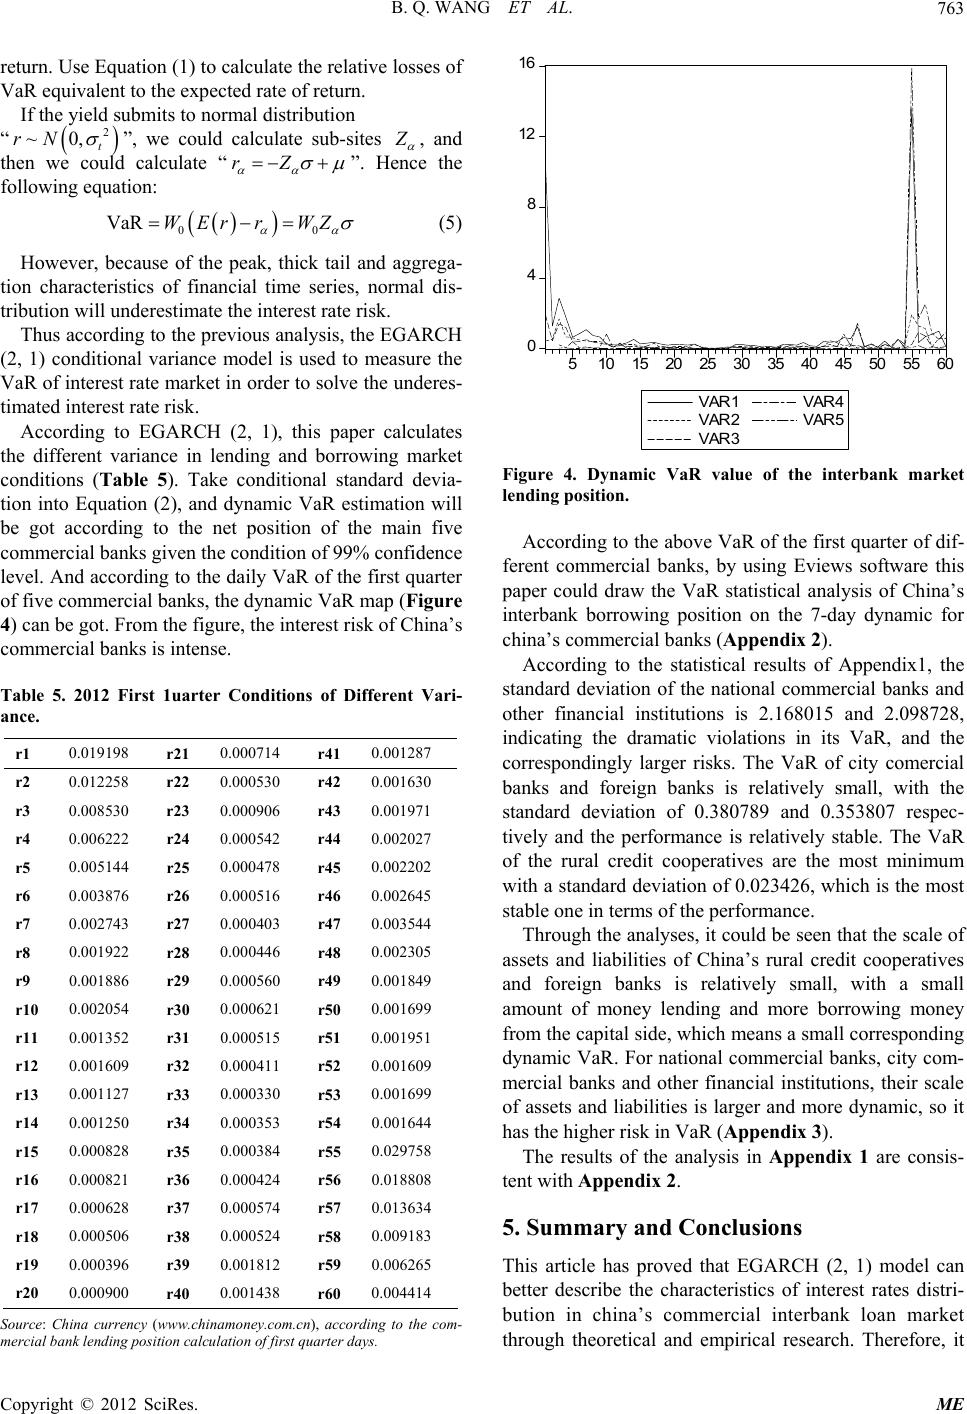 B. Q. WANG ET AL. 763 return. Use Equation (1) to calculate the relative losses of VaR equivalent to the expected rate of return. If the yield submits to normal distribution “ 2 ~0,rN t ”, we could calculate sub-sites Z , and then we could calculate “rZ ”. He the following equation: VaR WE nce 00 r rWZ (5) However, because of the peak, thick tail tion c onditions of Different Vari- nce. and aggrega- haracteristics of financial time series, normal dis- tribution will underestimate the interest rate risk. Thus according to the previous analysis, the EGARCH (2, 1) conditional variance model is used to measure the VaR of interest rate market in order to solve the underes- timated interest rate risk. According to EGARCH (2, 1), this paper calculates the different variance in lending and borrowing market conditions (Table 5). Take conditional standard devia- tion into Equation (2), and dynamic VaR estimation will be got according to the net position of the main five commercial banks given the condition of 99% confidence level. And according to the daily VaR of the first quarter of five commercial banks, the dynamic VaR map (Figure 4) can be got. From the figure, the interest risk of China’s commercial banks is intense. Table 5. 2012 First 1uarter C a r1 0.019198 r21 0.000714 r41 0.001287 r2 0.012258 r22 0.000530 r42 0.001630 r3 0.008530 r23 0.000906 r43 0.001971 r4 0.006222 r24 0.000542 r44 0.002027 r5 0.005144 r25 0.000478 r45 0.002202 r6 0.003876 r26 0.000516 r46 0.002645 r7 0.002743 r27 0.000403 r47 0.003544 r8 0.001922 r28 0.000446 r48 0.002305 r9 0.001886 r29 0.000560 r49 0.001849 r10 0.002054 r30 0.000621 r50 0.001699 r11 0.001352 r31 0.000515 r51 0.001951 r12 0.001609 r32 0.000411 r52 0.001609 r13 0.001127 r33 0.000330 r53 0.001699 r14 0.001250 r34 0.000353 r54 0.001644 r15 0.000828 r35 0.000384 r55 0.029758 r16 0.000821 r36 0.000424 r56 0.018808 r17 0.000628 r37 0.000574 r57 0.013634 r18 0.000506 r38 0.000524 r58 0.009183 r19 0.000396 r39 0.001812 r59 0.006265 r20 0.000900 r40 0.001438 r60 0.004414 So Ch(w hin)rdom- mbaositi lcuuday urce: ercial ina currency nk lending pww.c on caamoney.com.cn lation of first q, a cco arter ing to the c s. 0 4 8 12 16 510 15 20 25 30 35 40 45 50 55 60 VAR1 VAR4 VAR2 VAR3 VAR5 Figure 4. Dynamic VaR value of the interbank mark he above VaR of the first quarter of dif- onclusions (2, 1) model can et lending position. According to t ferent commercial banks, by using Eviews software this paper could draw the VaR statistical analysis of China’s interbank borrowing position on the 7-day dynamic for china’s commercial banks (Appendix 2). According to the statistical results of Appendix1, the standard deviation of the national commercial banks and other financial institutions is 2.168015 and 2.098728, indicating the dramatic violations in its VaR, and the correspondingly larger risks. The VaR of city comercial banks and foreign banks is relatively small, with the standard deviation of 0.380789 and 0.353807 respec- tively and the performance is relatively stable. The VaR of the rural credit cooperatives are the most minimum with a standard deviation of 0.023426, which is the most stable one in terms of the performance. Through the analyses, it could be seen that the scale of assets and liabilities of China’s rural credit cooperatives and foreign banks is relatively small, with a small amount of money lending and more borrowing money from the capital side, which means a small corresponding dynamic VaR. For national commercial banks, city com- mercial banks and other financial institutions, their scale of assets and liabilities is larger and more dynamic, so it has the higher risk in VaR (Appendix 3). The results of the analysis in Appendix 1 are consis- tent with Appe ndix 2. 5. Summary and C This article has proved that EGARCH better describe the characteristics of interest rates distri- bution in china’s commercial interbank loan market through theoretical and empirical research. Therefore, it Copyright © 2012 SciRes. ME 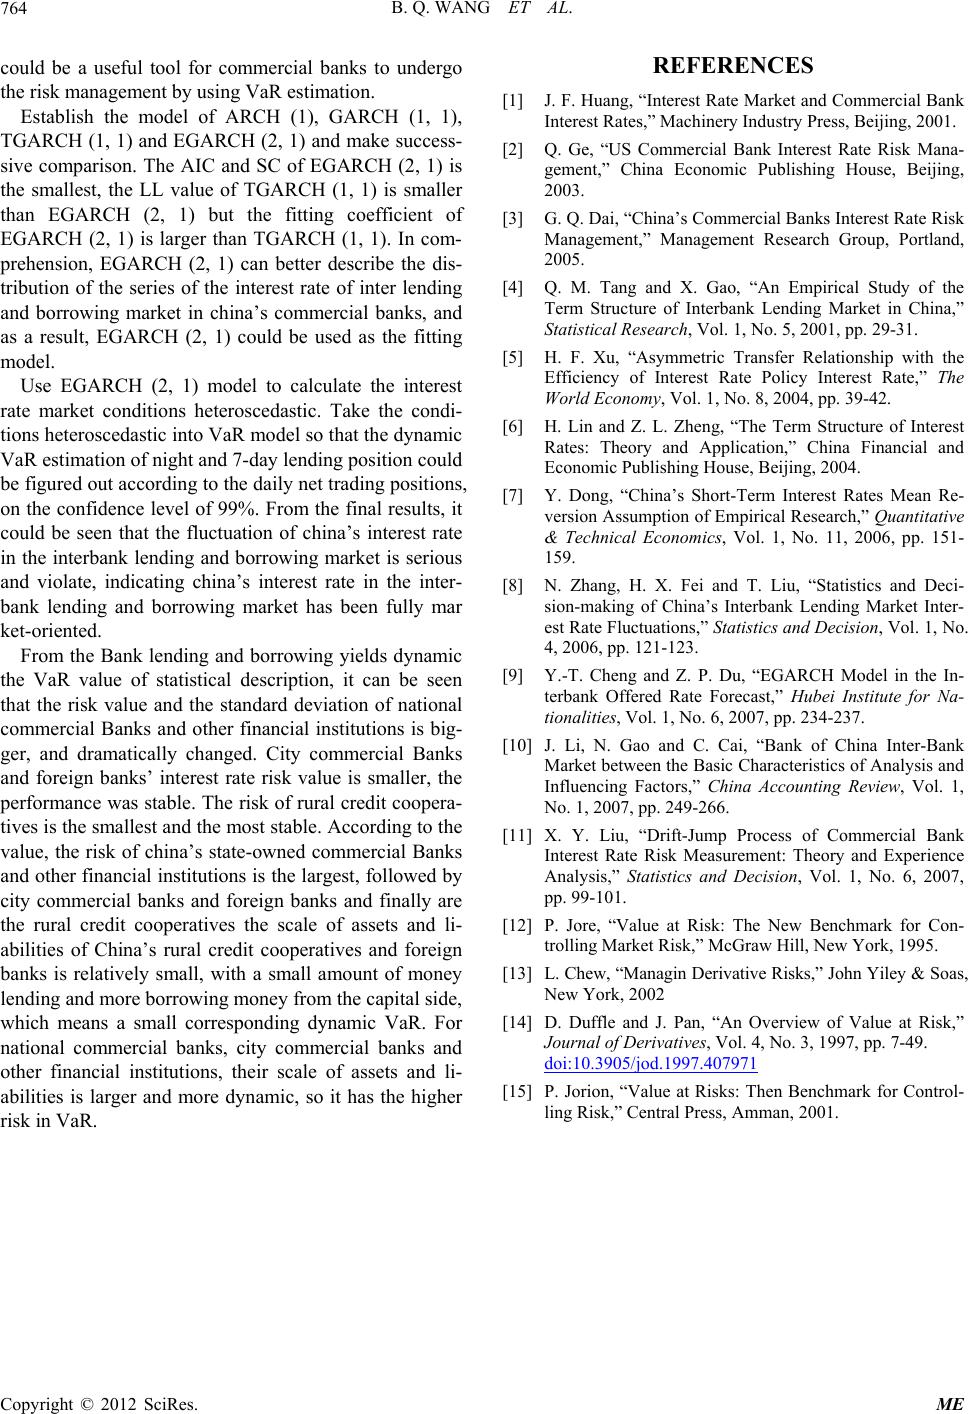 B. Q. WANG ET AL. Copyright © 2012 SciRes. ME 764 success si rket conditions heteroscedastic. Take the condi- tio e of statistical description, it can be th could be a useful tool for commercial banks to undergo the risk management by using VaR estimation. Establish the model of ARCH (1), GARCH (1, 1), TGARCH (1, 1) and EGARCH (2, 1) and make- [2 ve comparison. The AIC and SC of EGARCH (2, 1) is the smallest, the LL value of TGARCH (1, 1) is smaller than EGARCH (2, 1) but the fitting coefficient of EGARCH (2, 1) is larger than TGARCH (1, 1). In com- prehension, EGARCH (2, 1) can better describe the dis- tribution of the series of the interest rate of inter lending and borrowing market in china’s commercial banks, and as a result, EGARCH (2, 1) could be used as the fitting model. Use EGARCH (2, 1) model to calculate the interest rate ma ns heteroscedastic into VaR model so that the dynamic VaR estimation of night and 7-day lending position could be figured out according to the daily net trading positions, on the confidence level of 99%. From the final results, it could be seen that the fluctuation of china’s interest rate in the interbank lending and borrowing market is serious and violate, indicating china’s interest rate in the inter- bank lending and borrowing market has been fully mar ket-oriented. From the Bank lending and borrowing yields dynamic the VaR valuseen [9] Y.-T. Cheng and Z. P. Du, “EGARCH Model in the In- terbank Offered Rate Forecast,” Hubei Institute for Na- tionalities, Vol. 1, No. 6, 2007, pp. 234-237. at the risk value and the standard deviation of national commercial Banks and other financial institutions is big- ger, and dramatically changed. City commercial Banks and foreign banks’ interest rate risk value is smaller, the performance was stable. The risk of rural credit coopera- tives is the smallest and the most stable. According to the value, the risk of china’s state-owned commercial Banks and other financial institutions is the largest, followed by city commercial banks and foreign banks and finally are the rural credit cooperatives the scale of assets and li- abilities of China’s rural credit cooperatives and foreign banks is relatively small, with a small amount of money lending and more borrowing money from the capital side, which means a small corresponding dynamic VaR. For national commercial banks, city commercial banks and other financial institutions, their scale of assets and li- abilities is larger and more dynamic, so it has the higher risk in VaR. REFERENCES [1] J. F. Huang, “Interest Rate Market and Commercial Bank Interest Rates,” Machinery Industry Press, Beijing, 2001. ] Q. Ge, “US Commercial Bank Interest Rate Risk Mana- gement,” China Economic Publishing House, Beijing, 2003. [3] G. Q. Dai, “China’s Commercial Banks Interest Rate Risk Management,” Management Research Group, Portland, 2005. [4] Q. M. Tang and X. Gao, “An Empirical Study of the Term Structure of Interbank Lending Market in China,” Statistical Research, Vol. 1, No. 5, 2001, pp. 29-31. [5] H. F. Xu, “Asymmetric Transfer Relationship with the Efficiency of Interest Rate Policy Interest Rate,” The World Economy, Vol. 1, No. 8, 2004, pp. 39-42. [6] H. Lin and Z. L. Zheng, “The Term Structure of Interest Rates: Theory and Application,” China Financial and Economic Publishing House, Beijing, 2004. [7] Y. Dong, “China’s Short-Term Interest Rates Mean Re- version Assumption of Empirical Research,” Quantitative & Technical Economics, Vol. 1, No. 11, 2006, pp. 151- 159. [8] N. Zhang, H. X. Fei and T. Liu, “Statistics and Deci- sion-making of China’s Interbank Lending Market Inter- est Rate Fluctuations,” Statistics and Decision, Vol. 1, No. 4, 2006, pp. 121-123. [10] J. Li, N. Gao and C. Cai, “Bank of China Inter-Bank Market between the Basic Characteristics of Analysis and Influencing Factors,” China Accounting Review, Vol. 1, No. 1, 2007, pp. 249-266. [11] X. Y. Liu, “Drift-Jump Process of Commercial Bank Interest Rate Risk Measurement: Theory and Experience Analysis,” Statistics and Decision, Vol. 1, No. 6, 2007, pp. 99-101. [12] P. Jore, “Value at Risk: The New Benchmark for Con- trolling Market Risk,” McGraw Hill, New York, 1995. [13] L. Chew, “Managin Derivative Risks,” John Yiley & Soas, New York, 2002 [14] D. Duffle and J. Pan, “An Overview of Value at Risk,” Journal of Derivatives, Vol. 4, No. 3, 1997, pp. 7-49. doi:10.3905/jod.1997.407971 [15] P. Jorion, “Value at Risks: Then Benchmark for Control- ling Risk,” Central Press, Amman, 2001. 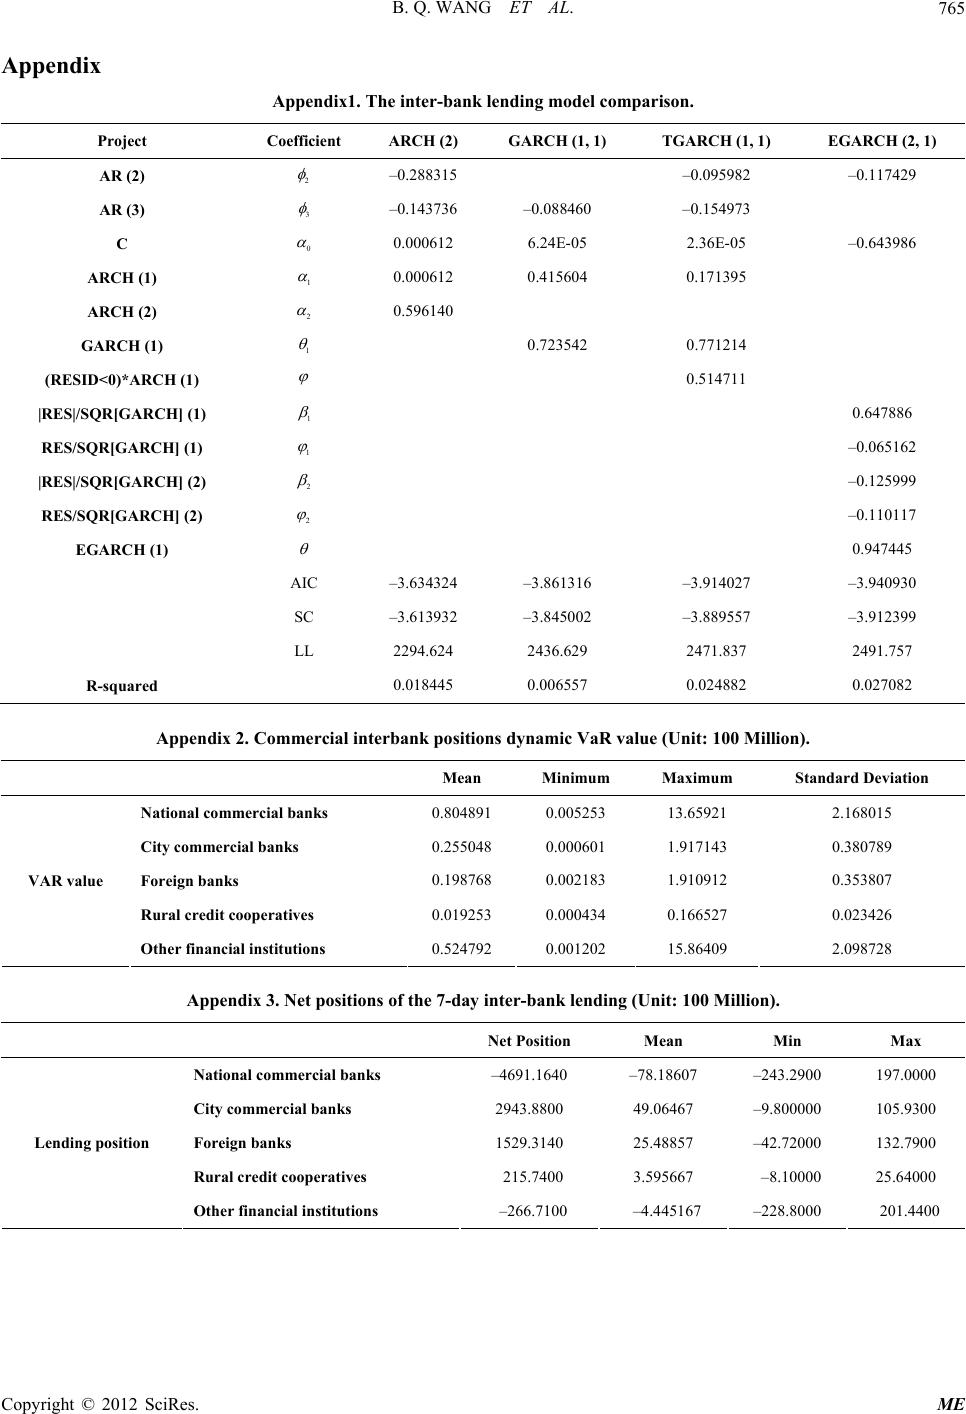 B. Q. WANG ET AL. 765 Appendix Appendix1. The inter-bank lending mode l c ompar ison. Project CH (1, 1) EGARCH (2, 1) Coefficient ARCH (2) GARCH (1, 1) TGAR AR (2) 2 –0.288315 –0.095982 –0.117429 AR (3) 3 –0.143736 –0.088460 –0.154973 C 0 0.000612 6.24E-05 2.36E-05 –0.643986 ARC) H (11 0.000612 0.415604 0.171395 ARCH (2) 2 0.596140 GARCH (1) 1 0.723542 0.771214 (RESID<0) )*ARCH (1 0.514711 |RES|/SQR[GARCH] (1) 1 0.647886 RES/SQR[GARCH] (1) 1 –0. |RES|/S 065162 QR[GARCH] (2) 2 –0.125999 RES/SQR[GARCH] (2) 2 –0.110117 EGARCH (1) 0.947445 AIC –3.634324 –3.861316 –3.914027 –3. R-squared 940930 SC –3.613932 –3.845002 –3.889557 –3.912399 LL 2294.624 2436.629 2471.837 2491.757 0.018445 0.006557 0.024882 0.027082 ppendix 2. Commrcial intertions dyR value (Uillion). dard Deviation Aebank posinamic Vanit: 100 M Mean Minimum Maximum Stan National commercial banks 0.804891 0.005253 13.65921 2.168015 City commercial banks 0.255048 0.000601 1.917143 0.380789 Foreign banks 0.198768 0.002183 1.910912 0.353807 Rural credit cooperatives VAR value 0.019253 0.000434 0.166527 0.023426 Other financial institutions 0.524792 0.001202 15.86409 2.098728 sitions of theer-bag (Unllion). in Max Appendix 3. Net po 7-day intnk lendinit: 100 Mi Net Position Mean M National commercial banks –243.197.–4691.1640 –78.18607 2900 0000 City commercial banks 2943.8800 49.06467 –9.800000 105.9300 Foreign banks 1529.3140 25.48857 –42.72000 132.7900 Rural credit cooperatives Lending position –266. –228. 215.7400 3.595667 –8.10000 25.64000 Other financial institutions 7100 –4.445167 8000 201.4400 Copyright © 2012 SciRes. ME |