

Paper Menu >>
Journal Menu >>
 Modern Economy, 2012, 3, 713-717 http://dx.doi.org/10.4236/me.2012.36091 Published Online October 2012 (http://www.SciRP.org/journal/me) Testing Business Cycles Asymmetry in Central and Eastern European Countries Viorica Chirila, Ciprian Chirila Faculty of Economics and Business Administration, University Alexandru Ioan Cuza, Iaşi, Romania Email: [email protected], [email protected] Received July 11, 2012; revised August 25, 2012; accepted September 18, 2012 ABSTRACT The idea of business cycles asymmetry is not new in economic theory. According to business cycles asymmetry, a country’s economy behaves differently during economic growth periods as compared to economic recession periods. The results achieved by business cycles asymmetry testing are far from unanimous: some are positive, others are nega- tive. Business cycles asymmetry has major econometric implications: business cycles cannot be modeled using linear models. This paper aims to test business cycles asymmetry in Central and Eastern European Countries, where few business cycles analyses, and especially business cycles asymmetry researches, have been conducted. The industrial production index was considered when testing business cycles asymmetry. We estimated business cycles using the Hodrick-Prescott filter and Mills’ test of asymmetry. Mira’s test was also employed to test results reliability. According to our results, business cycles in Central and Eastern European countries are not asymmetric. Keywords: Business Cycles; Asymmetry; Hodrick-Prescott Filter 1. Introduction Business cycles research enjoys a cyclical evolution itself. Papers on this topic are published mostly at times of economic recession. The explanation seems simple and it relies on the researchers’ intent to forecast future eco- nomic recessions likely to have a major negative impact on economy, which in its turn influences the population’s standard of living. The empirical characteristics of busi- ness cycles are vital in business cycles modeling and forecast. Therefore, special attention is paid to empirical characteristics. The concept of asymmetry as a business cycle characteristic is not new, yet converging results have not been achieved so far. Authors such as Mitchell [1], Keynes [2] Burns and Mitchell [3], and Hicks [4] have mentioned business cycles asymmetry in their eco- nomic theory papers. Business cycles asymmetry roughly means that econ- omy behaves differently during economic growth periods than during economic recession periods. Boldwin [5] argues that asymmetric business cycles only occur in the case where recessions and expansions are not mirror im- ages of each other. Business cycles asymmetry refers, on the one hand, to the fact that decrease due to economic recession is more abrupt than increase during economic growth periods and, on the other hand, to the fact that the minimum value reached at times of economic recession is greater in absolute value than the peak reached during economic growth. Siechel [6] defines the first type as steepness asymmetry and the second as deepness asym- metry and reckons that they may occur either simultane- ously or separately. These types of asymmetry are also called transversal and longitudinal asymmetry [7] or un- conditional and conditional asymmetry [8]. Business cycles asymmetry has serious implications on their econometric modeling: Business cycles cannot be described by linear models. Deepness asymmetry en- ables specialists to capture business cycles using a model involving asymmetric price adjustments (as positive de- mand shocks have greater relative negative impact on output than positive shocks, which have less impact on output). Steepness asymmetry allows capturing business cycles by an asymmetric costs model, which relies on the assumption that production may decrease very rapidly, yet its increase is much slower. The outcome of business cycles asymmetry testing is different. Nefci [9], Falk [10] and Mills [11] did not get positive results when testing business cycles asymmetry in industrial production. On the other hand, there are studies supporting the existence of asymmetry in a num- ber of economic series by Ramsey and Rothman [7], An- dreano and Savio [12] and Stanca [13]. Speight tests business cycles asymmetry [14] on a sample of 16 OECD countries considering their volume of industrial production, as he thinks that this variable “displays as much cyclical variation as possible”, based C opyright © 2012 SciRes. ME  V. CHIRILA, C. CHIRILA 714 on available data. The analyzed period is 1961:1-1994:4 for most countries, except for Spain, Greece and OECD aggregates. It uses Sichel’s methodology (1993), as well as Newey’s and West’s corrections [15] with two parzen windows: T/4 and T/3. Although negative asymmetry is present in very many countries, deepness asymmetry is significant, considering an up to 10% risk, only for Ger- many, Japan, Sweden and UK. He also achieves signifi- cant steepness asymmetry for Japan, Sweden and UK, taking an up to 10% risk. Business cycles asymmetry has not been tested for Central and Eastern European countries. Therefore, our study is designed to fill this gap. The following countries were included in our business cycles asymmetry analysis: Bulgaria, Croatia, Czech Republic, Estonia, Latvia, Li- thuania, Hungary, Poland, Romania, Slovenia and Slova- kia. The analyzed period was 1998.1-2011.3. We used the Hodrick-Prescott filter [16] to estimate business cy- cles, and the Mills test [17] and Mira test [18] to test asymmetry. The two estimation and testing variants al- lowed us to check the reliability of the reported results. The rest of the paper is structured as follows: the sec- ond section includes a synthetic presentation of, on the one hand, the methods employed to estimate business cycles and, on the other hand, the methods devoted to business cycles asymmetry testing; the third section de- scribes the data used, whereas the fourth section reveals the reported results. This paper ends with a set of conclu- sions. 2. Methodology When testing business cycles asymmetry, the cyclical component should be estimated first and the asymmetry tests should be conducted afterwards. Business cycles estimation relies on the general assumption that an un- seasonable variable may be decomposed in three com- ponents, namely the trend, cycle and random components. There are several methods applied to exclude the trend component. Nevertheless, none of them has been de- clared as the best variable trend exclusion method so far. Canova [19] provides a well-structured detailed presenta- tion of these methods. It is important to say that the pre- vious studies proved that the trend determination method may influence the results. Some of these trend exclusion methods consider the assumption according to which the variable only includes the trend and cycle components: ttt yxc where: t x is the non-stationary trend component and t is the cyclical stationary component, which is trend- dependent. c 2 2 -1-1 -2 12 tt ttttt tt cgggg In our paper, we decided to determine the cyclical component using the Hodrick-Prescott filter. Even if the Hodrick-Prescott filter was very much criticized by Rand and Tarp [20], it is also the most used in business cycles analysis. Therefore, we will also use it in our study. By means of the Hodrick-Prescott filter, the trend is determined by minimizing the expression: (1) where: * ln ln t cytyt * ln 1 t gyt * 1ln t g yt , , , * 2ln 1 t gyt * and y —the long-term trend of the variable y. The most frequent value used for the parameter in the case of quarterly data is 1600. To test the existence of the cyclical component for a time series we use the Ljung-Box test. The tested hy- potheses are the following: the null hypothesis H0 pre- supposes that the variable is a white noise and the alter- native hypothesis H1 presupposes that the variable is autocorrelated. The test statistics is calculated according to the relation: 2 1 ˆ 2 ki ki QTT Ti (2) For asymmetry testing purposes, we will consider the test proposed by Mills [17], which modifies the test pro- posed by Sichel [6] by a Newey-West adjustment of variance for lack of normality. The test relies on the following asymmetry coefficient 3 3/2 2 S (3) where j is the moment j of the cyclical component of the series. If the sample is large and the component is normal and independently distributed, the variance of the estimated asymmetry coefficient would be equal to 6/T. Yet, since these assumptions are not observed, we calcu- late variance S as follows: 2 653 34 22 3 169 935 4 SS KK T (4) where: 4 2 2 K is the kurtosis coefficient (Jaba, 2001), T is the sample volume. Mills [17] adjusts the variance as follows 22 1 2 1 l SS jj j lf T (5) where: is the autocorrelation coefficient j of the variable j Copyright © 2012 SciRes. ME 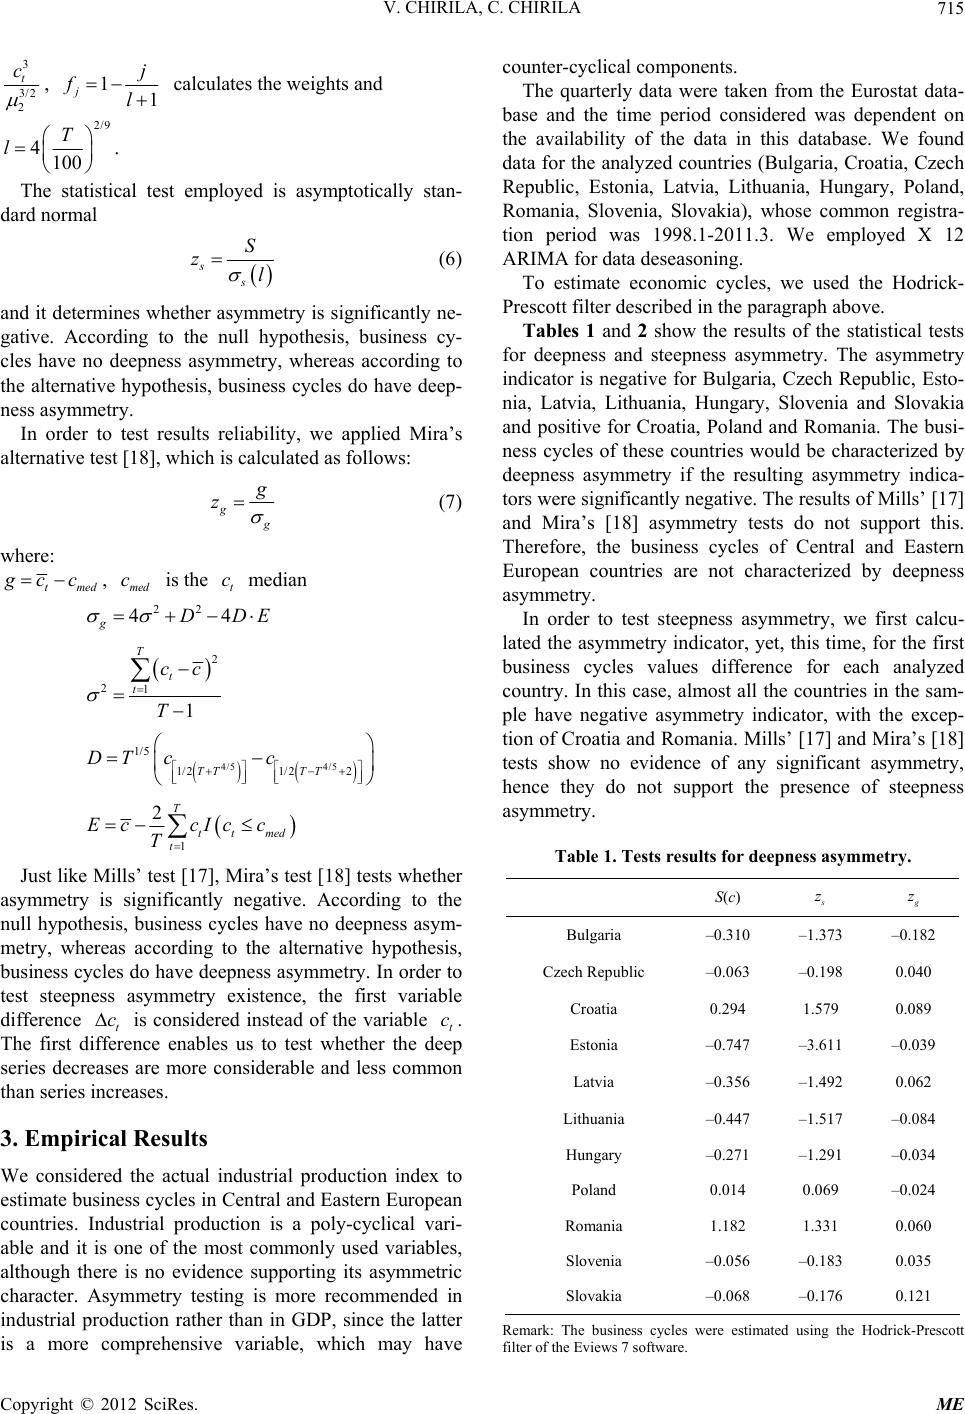 V. CHIRILA, C. CHIRILA 715 3 3/2 2 t c , 11 jj fl calculates the weights and 2/9 4100 T l. The statistical test employed is asymptotically stan- dard normal ss S zl (6) and it determines whether asymmetry is significantly ne- gative. According to the null hypothesis, business cy- cles have no deepness asymmetry, whereas according to the alternative hypothesis, business cycles do have deep- ness asymmetry. In order to test results reliability, we applied Mira’s alternative test [18], which is calculated as follows: g g g z (7) where: tmed g cc med t c 22 44DDE , is the median c g 2 1 1 T t t cc T 4/5 1/2 2TT c 2 4/5 1/5 1/2 TT DT c ttmed t EccIc c T cc 1 2T Just like Mills’ test [17], Mira’s test [18] tests whether asymmetry is significantly negative. According to the null hypothesis, business cycles have no deepness asym- metry, whereas according to the alternative hypothesis, business cycles do have deepness asymmetry. In order to test steepness asymmetry existence, the first variable difference t is considered instead of the variable t. The first difference enables us to test whether the deep series decreases are more considerable and less common than series increases. 3. Empirical Results We considered the actual industrial production index to estimate business cycles in Central and Eastern European countries. Industrial production is a poly-cyclical vari- able and it is one of the most commonly used variables, although there is no evidence supporting its asymmetric character. Asymmetry testing is more recommended in industrial production rather than in GDP, since the latter is a more comprehensive variable, which may have counter-cyclical components. The quarterly data were taken from the Eurostat data- base and the time period considered was dependent on the availability of the data in this database. We found data for the analyzed countries (Bulgaria, Croatia, Czech Republic, Estonia, Latvia, Lithuania, Hungary, Poland, Romania, Slovenia, Slovakia), whose common registra- tion period was 1998.1-2011.3. We employed X 12 ARIMA for data deseasoning. To estimate economic cycles, we used the Hodrick- Prescott filter described in the paragraph above. Tables 1 and 2 show the results of the statistical tests for deepness and steepness asymmetry. The asymmetry indicator is negative for Bulgaria, Czech Republic, Esto- nia, Latvia, Lithuania, Hungary, Slovenia and Slovakia and positive for Croatia, Poland and Romania. The busi- ness cycles of these countries would be characterized by deepness asymmetry if the resulting asymmetry indica- tors were significantly negative. The results of Mills’ [17] and Mira’s [18] asymmetry tests do not support this. Therefore, the business cycles of Central and Eastern European countries are not characterized by deepness asymmetry. In order to test steepness asymmetry, we first calcu- lated the asymmetry indicator, yet, this time, for the first business cycles values difference for each analyzed country. In this case, almost all the countries in the sam- ple have negative asymmetry indicator, with the excep- tion of Croatia and Romania. Mills’ [17] and Mira’s [18] tests show no evidence of any significant asymmetry, hence they do not support the presence of steepness asymmetry. Table 1. Tests results for deepness asymmetry. S(c) s z g z Bulgaria –0.310 –1.373 –0.182 Czech Republic –0.063 –0.198 0.040 Croatia 0.294 1.579 0.089 Estonia –0.747 –3.611 –0.039 Latvia –0.356 –1.492 0.062 Lithuania –0.447 –1.517 –0.084 Hungary –0.271 –1.291 –0.034 Poland 0.014 0.069 –0.024 Romania 1.182 1.331 0.060 Slovenia –0.056 –0.183 0.035 Slovakia –0.068 –0.176 0.121 Remark: The business cycles were estimated using the Hodrick-Prescott filter of the Eviews 7 software. Copyright © 2012 SciRes. ME 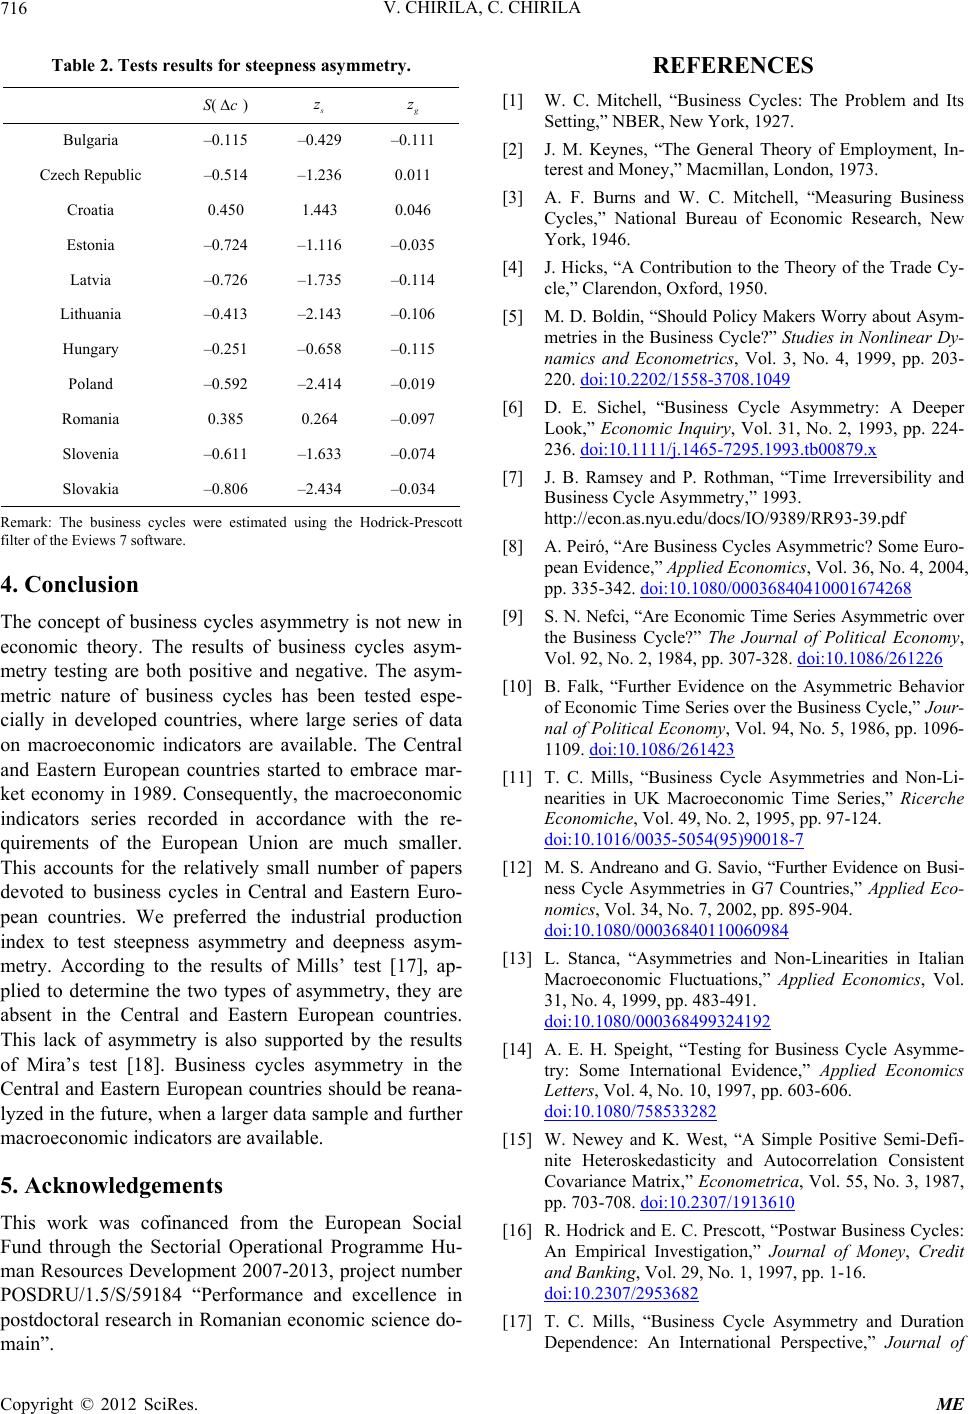 V. CHIRILA, C. CHIRILA 716 Table 2. Tests results for steepness asymmetry. S() c s z g z Bulgaria –0.115 –0.429 –0.111 Czech Republic –0.514 –1.236 0.011 Croatia 0.450 1.443 0.046 Estonia –0.724 –1.116 –0.035 Latvia –0.726 –1.735 –0.114 Lithuania –0.413 –2.143 –0.106 Hungary –0.251 –0.658 –0.115 Poland –0.592 –2.414 –0.019 Romania 0.385 0.264 –0.097 Slovenia –0.611 –1.633 –0.074 Slovakia –0.806 –2.434 –0.034 Remark: The business cycles were estimated using the Hodrick-Prescott filter of the Eviews 7 software. 4. Conclusion The concept of business cycles asymmetry is not new in economic theory. The results of business cycles asym- metry testing are both positive and negative. The asym- metric nature of business cycles has been tested espe- cially in developed countries, where large series of data on macroeconomic indicators are available. The Central and Eastern European countries started to embrace mar- ket economy in 1989. Consequently, the macroeconomic indicators series recorded in accordance with the re- quirements of the European Union are much smaller. This accounts for the relatively small number of papers devoted to business cycles in Central and Eastern Euro- pean countries. We preferred the industrial production index to test steepness asymmetry and deepness asym- metry. According to the results of Mills’ test [17], ap- plied to determine the two types of asymmetry, they are absent in the Central and Eastern European countries. This lack of asymmetry is also supported by the results of Mira’s test [18]. Business cycles asymmetry in the Central and Eastern European countries should be reana- lyzed in the future, when a larger data sample and further macroeconomic indicators are available. 5. Acknowledgements This work was cofinanced from the European Social Fund through the Sectorial Operational Programme Hu- man Resources Development 2007-2013, project number POSDRU/1.5/S/59184 “Performance and excellence in postdoctoral research in Romanian economic science do- main”. REFERENCES [1] W. C. Mitchell, “Business Cycles: The Problem and Its Setting,” NBER, New York, 1927. [2] J. M. Keynes, “The General Theory of Employment, In- terest and Money,” Macmillan, London, 1973. [3] A. F. Burns and W. C. Mitchell, “Measuring Business Cycles,” National Bureau of Economic Research, New York, 1946. [4] J. Hicks, “A Contribution to the Theory of the Trade Cy- cle,” Clarendon, Oxford, 1950. [5] M. D. Boldin, “Should Policy Makers Worry about Asym- metries in the Business Cycle?” Studies in Nonlinear Dy- namics and Econometrics, Vol. 3, No. 4, 1999, pp. 203- 220. doi:10.2202/1558-3708.1049 [6] D. E. Sichel, “Business Cycle Asymmetry: A Deeper Look,” Economic Inquiry, Vol. 31, No. 2, 1993, pp. 224- 236. doi:10.1111/j.1465-7295.1993.tb00879.x [7] J. B. Ramsey and P. Rothman, “Time Irreversibility and Business Cycle Asymmetry,” 1993. http://econ.as.nyu.edu/docs/IO/9389/RR93-39.pdf [8] A. Peiró, “Are Business Cycles Asymmetric? Some Euro- pean Evidence,” Applied Economics, Vol. 36, No. 4, 2004, pp. 335-342. doi:10.1080/00036840410001674268 [9] S. N. Nefci, “Are Economic Time Series Asymmetric over the Business Cycle?” The Journal of Political Economy, Vol. 92, No. 2, 1984, pp. 307-328. doi:10.1086/261226 [10] B. Falk, “Further Evidence on the Asymmetric Behavior of Economic Time Series over the Business Cycle,” Jour- nal of Political Economy, Vol. 94, No. 5, 1986, pp. 1096- 1109. doi:10.1086/261423 [11] T. C. Mills, “Business Cycle Asymmetries and Non-Li- nearities in UK Macroeconomic Time Series,” Ricerche Economiche, Vol. 49, No. 2, 1995, pp. 97-124. doi:10.1016/0035-5054(95)90018-7 [12] M. S. Andreano and G. Savio, “Further Evidence on Busi- ness Cycle Asymmetries in G7 Countries,” Applied Eco- nomics, Vol. 34, No. 7, 2002, pp. 895-904. doi:10.1080/00036840110060984 [13] L. Stanca, “Asymmetries and Non-Linearities in Italian Macroeconomic Fluctuations,” Applied Economics, Vol. 31, No. 4, 1999, pp. 483-491. doi:10.1080/000368499324192 [14] A. E. H. Speight, “Testing for Business Cycle Asymme- try: Some International Evidence,” Applied Economics Letters, Vol. 4, No. 10, 1997, pp. 603-606. doi:10.1080/758533282 [15] W. Newey and K. West, “A Simple Positive Semi-Defi- nite Heteroskedasticity and Autocorrelation Consistent Covariance Matrix,” Econometrica, Vol. 55, No. 3, 1987, pp. 703-708. doi:10.2307/1913610 [16] R. Hodrick and E. C. Prescott, “Postwar Business Cycles: An Empirical Investigation,” Journal of Money, Credit and Banking, Vol. 29, No. 1, 1997, pp. 1-16. doi:10.2307/2953682 [17] T. C. Mills, “Business Cycle Asymmetry and Duration Dependence: An International Perspective,” Journal of Copyright © 2012 SciRes. ME  V. CHIRILA, C. CHIRILA Copyright © 2012 SciRes. ME 717 Applied Statistics, Vol. 28, No. 6, 2001, pp. 713-724. doi:10.1080/02664760120059246 [18] A. Mira, “Distribution-Free Test for Symmetry Based on Bonferroni’s Measure,” Journal of Applied Statistics, Vol. 26, No. 8, 1999, pp. 959-972. doi:10.1080/02664769921963 [19] F. Canova, “Detrending and Business Cycle Facts,” Jour- nal of Monetary Economics,” Elsevier, Vol. 41, No. 3, 1998, pp. 475-512. [20] J. Rand and F. Tarp, “Business Cycles in Developing Countries: Are They Different?” World Development, Vol. 30, No. 12, 2002, pp. 2071-2088. doi:10.1016/S0305-750X(02)00124-9 |