

Paper Menu >>
Journal Menu >>
 Journal of Transportation Technologies, 2012, 2, 297-304 http://dx.doi.org/10.4236/jtts.2012.24032 Published Online October 2012 (http://www.SciRP.org/journal/jtts) Integrating Origin-Destination Survey and Stochastic User Equilibrium: A Case Study for Route Relocation Deo Chimba*, Daniel Emaasit, Boniphace Kutela Department of Civil Engineering, Tennessee State University, Nashville, USA Email: *[email protected] Received June 22, 2012; revised July 20, 2012; accepted August 2, 2012 ABSTRACT The paper analyses integrating Origin-Destination (O-D) survey results with Stochastic User Equilibrium (SUE) in traffic assignment. The two methods are widely used in transportation planning but their applications have not yet fully inte- grated. While O-D gives a generalized trip patterns, purpose and characteristics, SUE provides optimal trip distributions using the characteristics found in O-D survey. The paper utilized O-D and SUE in route relocation study for the town of Coamo in Puerto Rico. The O-D survey was used initially in studying possible trip distribution and assignment for the new route. Initial distribution and assignment of traffic to the existing roadway networks and the proposed route were allocated utilizing the O-D survey findings. The SUE was then used to optimize the assignments considering roadway characteristics such as number of lanes, capacity limits, free flow speed, signal spacing density, travel time and gasoline cost. The travel time was optimized through the Bureau of Public Roads (BPR) equation found in 2000 HCM. The op- timal trips found from the SUE were then used to propose the final alignment of the new route. Traffic assignment from the SUE was slightly different from those initially assigned using O-D, indicating there was optimization. The assign- ment on new route was increased by 13.8% from the one assigned using O-D while assignment on the existing link was reduced by 22%. Keywords: Route Relocation; Origin-Destination; Stochastic User Equilibrium 1. Introduction and Background Knowledge of the travel patterns for a defined jurisdic- tion or roadway network is an important aspect in trans- portation planning [1]. The patterns may include vehicle classifications, trip purposes, travel time, age differentia- tions, life styles and vehicle occupancy among others. The information can be used for different purposes in- cluding traffic impact studies, corridor and area planning, zoning, master plans, traffic projection and traffic as- signments. There are different methodologies used in studying traffic patterns, one of them being Origin and Destination (O-D) survey. While some studies use O-D as a stand-alone approach in traffic pattern studies, some have combined the information from O-D report with other supporting traffic data to facilitate the findings and conclusions. For instance, O-D can be used in demand estimation using turning movement counts [2]. There are some studies whose objectives can be fulfilled with the O-D survey information only, but most of them will need supporting data or analysis in order to draw practical conclusions. Taking example of the O-D survey giving the percentage of trips from city A to city B, in rare cases the same survey will give the route assignment used by the interviewed travelers. In this case, while the percent- age of trips from city A to city B will be obtained for planning purposes, supporting information related to the route assignments will be needed. In other words, the results from O-D study will need supporting analysis to make final recommendations. The O-D study gives the details of what type of trips in terms of purpose at origin and destination are made by the travelers. Through O-D, one can determine which among home-based, education, shopping, recreational or any other trip purpose are dominant in the area. In case of route relocation study, diversions, road expansion and other similar kind of pro- jects, O-D survey becomes not a stand-alone but a sup- porting document [3]. 1.1. Study Objectives This study therefore combines the O-D survey with the traffic assignment analysis using stochastic user equili- brium in route relocation study. The objective is to evalu- ate which approaches (between utilizing O-D survey only, SUE only or integrated O-D and SUE) yield the optimal and desired results. The desired results in this case are *Corresponding author. C opyright © 2012 SciRes. JTTs 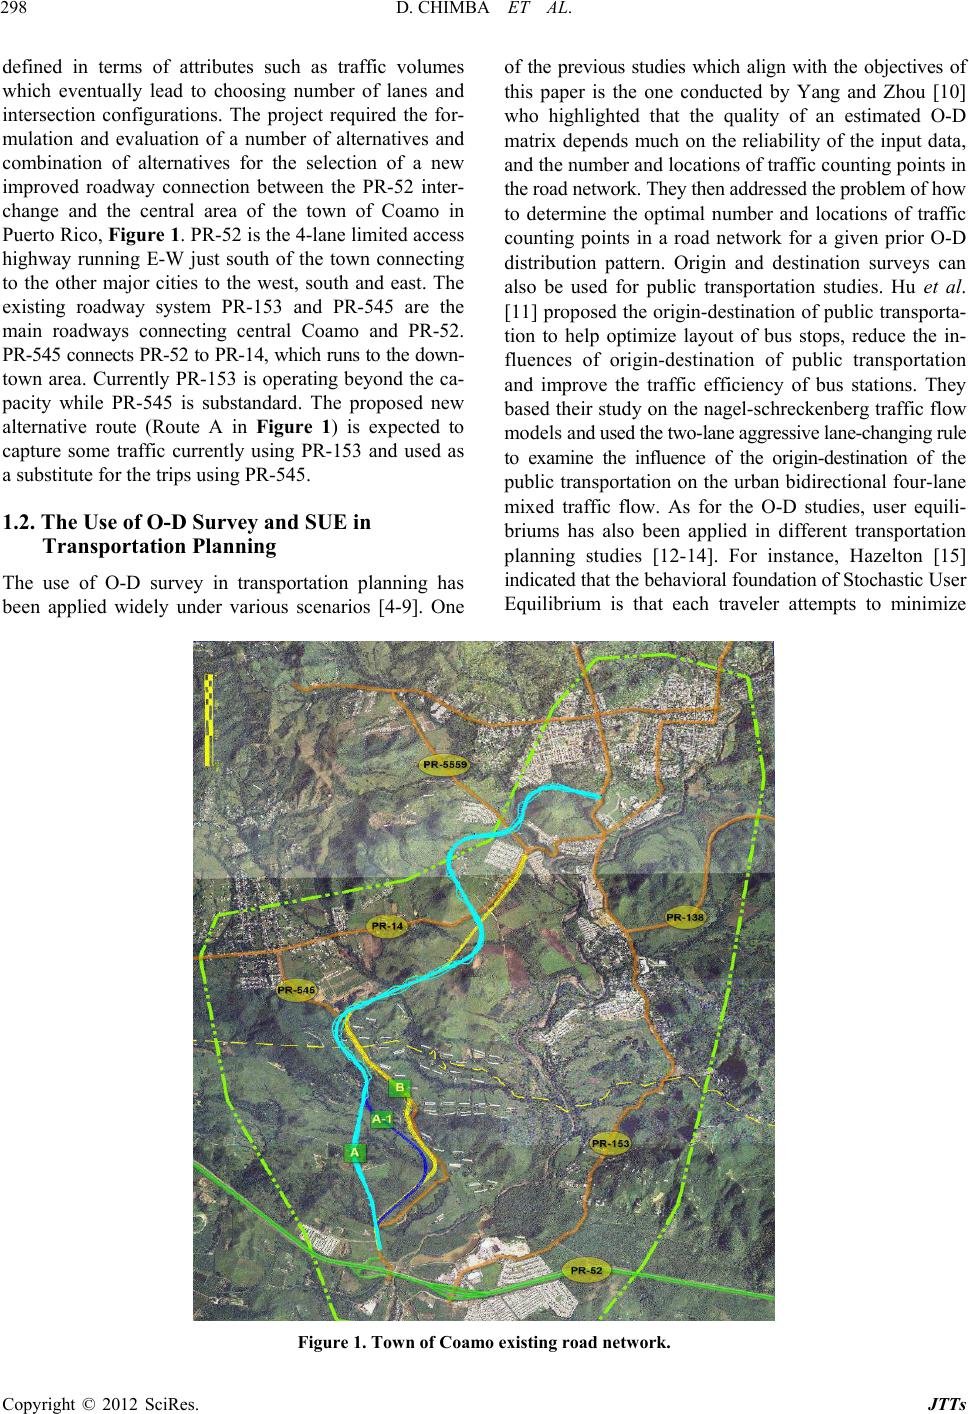 D. CHIMBA ET AL. 298 defined in terms of attributes such as traffic volumes which eventually lead to choosing number of lanes and intersection configurations. The project required the for- mulation and evaluation of a number of alternatives and combination of alternatives for the selection of a new improved roadway connection between the PR-52 inter- change and the central area of the town of Coamo in Puerto Rico, Figure 1. PR-52 is the 4-lane limited access highway running E-W just south of the town connecting to the other major cities to the west, south and east. The existing roadway system PR-153 and PR-545 are the main roadways connecting central Coamo and PR-52. PR-545 connects PR-52 to PR-14, which runs to the down- town area. Currently PR-153 is operating beyond the ca- pacity while PR-545 is substandard. The proposed new alternative route (Route A in Figure 1) is expected to capture some traffic currently using PR-153 and used as a substitute for the trips using PR-545. 1.2. The Use of O-D Survey and SUE in Transportation Planning The use of O-D survey in transportation planning has been applied widely under various scenarios [4-9]. One of the previous studies which align with the objectives of this paper is the one conducted by Yang and Zhou [10] who highlighted that the quality of an estimated O-D matrix depends much on the reliability of the input data, and the number and locations of traffic counting points in the road network. They then addressed the problem of how to determine the optimal number and locations of traffic counting points in a road network for a given prior O-D distribution pattern. Origin and destination surveys can also be used for public transportation studies. Hu et al. [11] proposed the origin-destination of public transporta- tion to help optimize layout of bus stops, reduce the in- fluences of origin-destination of public transportation and improve the traffic efficiency of bus stations. They based their study on the nagel-schreckenberg traffic flow models and used the two-lane aggressive lane-changing rule to examine the influence of the origin-destination of the public transportation on the urban bidirectional four-lane mixed traffic flow. As for the O-D studies, user equili- briums has also been applied in different transportation planning studies [12-14]. For instance, Hazelton [15] indicated that the behavioral foundation of Stochastic User Equilibrium is that each traveler attempts to minimize Figure 1. Town of Coamo existing road network. Copyright © 2012 SciRes. JTTs  D. CHIMBA ET AL. 299 his or her perceived travel costs, where these costs are study analyzed As, Town of Coamo was the epicenter composed of a deterministic measured cost and a random term which can be interpreted as perceptual error. In his study, he presented Stochastic User Equilibrium as a probability distribution defined by the conditional route selection of each individual given the choices of all other travelers. He also investigated the limiting behavior as the travel demand becomes large. Some of the methodo- logies and procedures used in these previous studies which utilized O-D and SUE are replicated in this paper. 1.3. Study Data and Methodology To achieve the project objectives, the existing traffic condition for the PR-52, PR-153, PR-545 and PR-14. The 7-days, 24-hours count along these road- ways were used to develop existing traffic characteristics. Historical traffic data, population growth, economic trends, employment growths and number of registered vehicles for the past years was used to develop the growth rates for traffic projection to the year 2027. The origin-desti- nation survey was then conducted to determine major areas where the traffic enter and leave the Coamo town. The O-D provided the percentage of trips to and from the town of Coamo from different cities and zones, break- down of trips by purpose, vehicle occupancy and classi- fications. Apart from revealing which highways were currently the major collectors and distributors to and from Coamo, the O-D study survey was also used to determine the possible future traffic pattern changes. The projected ADT (annual daily traffic) was portioned along PR-545 and PR-153 and the proposed new roadway based on the O-D survey results. As shown in Figure 1, Route A was proposed as an alternative for the traffic currently using PR-545 and those, which will be diverted from PR-153. Stochastic User Equilibrium trip assignment was used to distribute and balance the trips to and from Coamo along PR-153 and the proposed Route-A. Stochastic User Equi- librium (SUE) was used due to its underlying principle, which considers a population of drivers with homogene- ous characteristics and perceive the same set of network costs except for the variation allowed by the stochastic choice model considered. With the fixed origin-desti- nation within the known roadway networks, stochastic equilibrium assumes that the drivers will react to changes in network conditions as a result of change in route cha- racteristics stochastically. 2. Formulation of Origin-Destination Matrix and Findings introduced earlier of this study; hence, all trips surveyed were coded with respect to routes to and from this town. Let i denote town of Coamo, j denote the external cities, and n number of cities or separate routes to those cities, then ii Internal Trips within CoamoT Trips from Coamo to other cities ij T Trips from other cities to Coam ji To The proportion trip among all surveyed vhicles is given by; Proportion of internal trips to total survey, Pii e ; 11 11 111 1 ij ji ii ij jii TT T ii T P (1) ii nn Proportion of outbound external trips to total survey, Pij; 11 11 111 1 ij jiii TT T ij ij nn ij jii T P (2) Proportion of inbound external trips to total survey, Pji; 11 11 111 1 ij ji ii TTT ji ji nn ij jii T P (3) Both trip proportionand sii P, ij P j i P e ex are ut termination of the trip thisting and proposed routs. fond b C ual Daily Traffic) was ilized in de- s along The study was therere iitiatey preparing an O-D questionnaire for designated locations along PR-52, PR- 153 and PR-14. Different considerations were taken into account for effective O-D results including avoidance of uncertainties. One of the uncertainties avoided was to choose the interview locations which could have brought conflicting responses. According to some previous stu- dies, the O-D location should consider traffic flow co- verage and minimize the expected uncertainties [16,17]. Interviews were conducted on March 15, 2007 on PR 52 at the entrance and exit ramps with PR 153 and on PR 14 at the intersection with PR 153. The findings from O-D survey were summarized as PR 153 was the main highway from PR 52, used by motorist to and from Coamo, The intersection of PR 14/PR 153 was the major in- tersection used by motorist to/from Coamo, The PR 14 link from PR153 to downtown was the main receiver and deliverer of traffic from/to PR 153, Home, work and personal based trips were the major trip purposes to and from Coamo. Figure 2 shows some of the results found from the O-D survey. For all of the trips to and from the town, 22% originate or ended west of Coamo, 13% south of oamo and 13% east of Coamo. 3. Proposed Alternative Route The 2027 projected ADT (Ann Copyright © 2012 SciRes. JTTs  D. CHIMBA ET AL. 300 33,800 vpd on PR-153 and 6200 vpd on PR-545. These 4. Theory of User Equilibrium (UE) Us p’s first ADT were taken as external trips. From the Origin Desti- nation (O-D) matrix developed, it was found that of all external traffic to Coamo from PR-153, 46% originated from the west, 28% from the south and 26% from the east. This distribution led to traffic assignment with re- spect to proposed route with 4-lane section and PR-153, which remained as a 2-lane section. Table 1 elaborates the trip assignment developed based on origin destination survey analysis. Furthermore, from the survey it was observed that, out of 26% of the traffic going to Coamo from the east using PR 153, 11% will be diverted to proposed Route A while 15% will continue using PR-153 to Coamo. For the 28% of the traffic originating from the South to Coamo, 21% will continue using PR-153 while 7% will be diverted to Route A. Traffic from the west which make up 46% of external trips, 37% was found that utilize Route A and 9% PR-153. All traffic currently using PR-545 to down- town Coamo were assumed to be diverted to Route A. After all of the analysis using the O-D survey, PR 153 was found that will remain with 15,400 vehicles per day vpd which according to HCM is Level of Service (LOS) D, that was a reduction of 18,400 vpd (54%) from originally 33,800 vpd projected. The proposed Route A was ex- pected to receive 18,400 vpd diverted from PR-153 and 6200 currently using PR-545, a total of 24,600 vpd (LOS B) by the year 2027. These O-D survey results were im- plemented in the Stochastic User Equilibrium analysis to find the final traffic balance based on the characteristics of existing PR-153 and the proposed Route A. Stochastic User Equilibrium (SUE) er Equilibrium can be derived from Wardro principle which states that, under equilibrium conditions traffic arranges itself in congested networks in such a way that no individual trip maker can reduce his travel cost by switching routes or all used routes between an origin and destination pair have equal and minimum costs while all unused routes have greater or equal costs [14,18]. A SUE condition is derived from the user equi- librium (UE) assumption which can be written as a given O-D pair as: 0 ii fcu for all i PERCENTAGE TRIPS BY PURPOSE 52% 22% 13% 13% 0% 5% 10% 15% 20% 25% 30% 35% 40% 45% 50% 55% 60% COAMO-INTERNAL TO/FROM-WESTTO/FROM-SOUTHTO/FROM-EAST % TRIPS HOME BASED TR IPS WORK BASED TRIPS ALL OTHE R PURPOSES TOTAL Figure 2. Percentage trips by location and purpose. Table 1. Trip urvey results. -Route Assignment along PR-153 and new route using O-D s To/From Coamo Through PR-153 Through New % DT AADT ADT To/Fro East 26% m8900 5300 3600 To/From South 28% 9300 7000 2300 To/From West 46% 15,600 3100 12,500 Pr-545 6200 Total 100% 33,800 15,400 24,100 Copyright © 2012 SciRes. JTTs 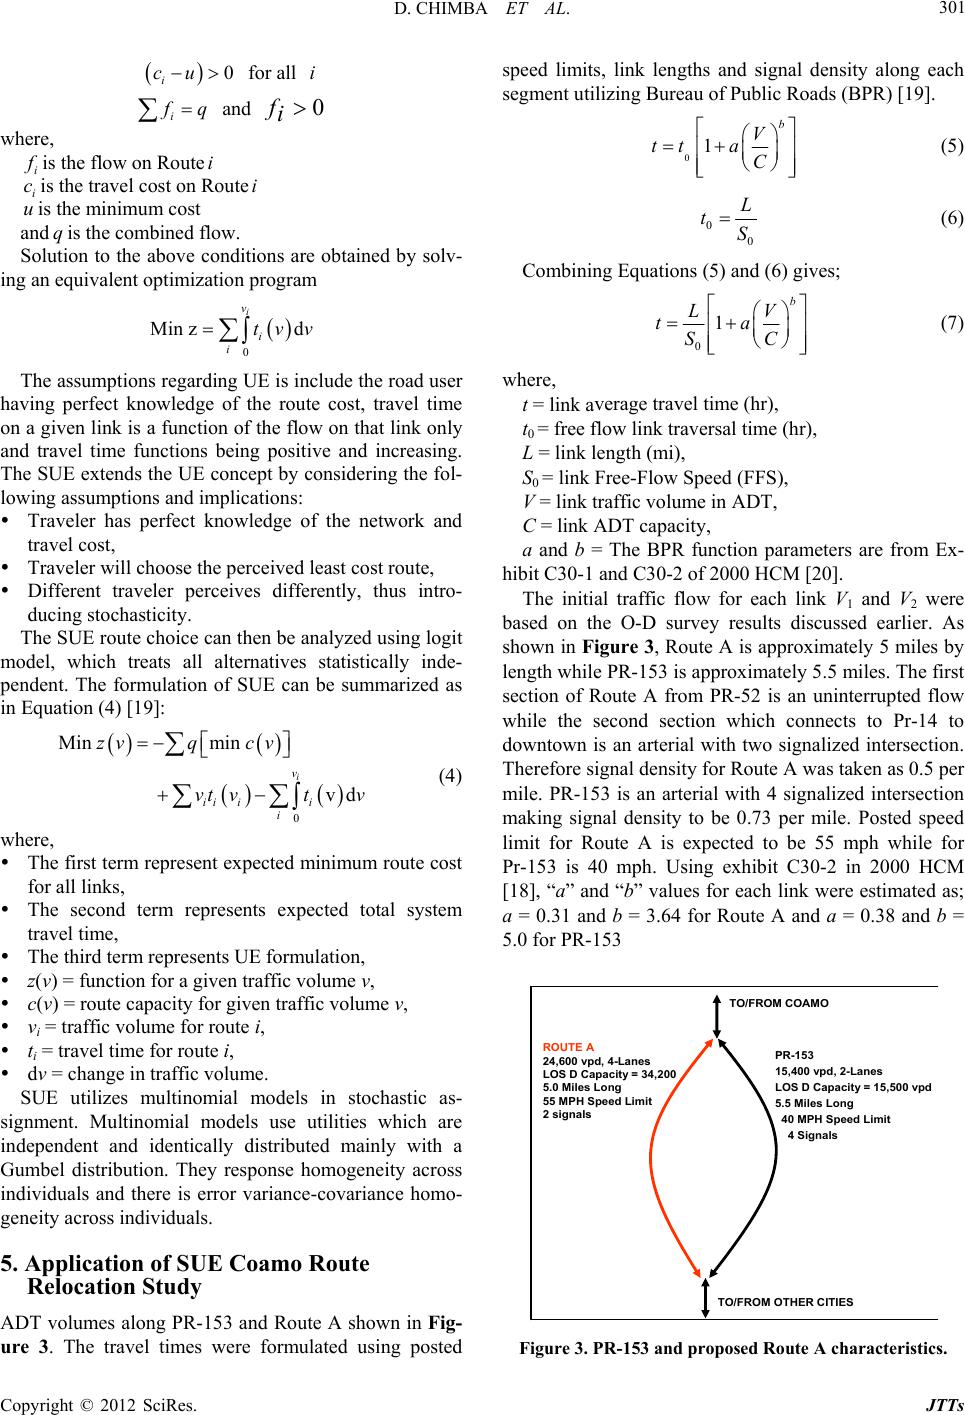 D. CHIMBA ET AL. 301 for all 0cu i i i f q and where, 0 i f i f is the flow on Rout e travel cost on e minimum cost an . So s are obtained by solv- ing arogram The assumptions regarding UE is include the road user having perfect knowledge of the routost, travel time on a given link is a function of the flow on that link only an ticity. of SUE can be summarized as (4) where, The first term represent expected minimum route cost for all links, second term represents expected total system represents UE formulation, e v, dels in stochastic as- se utilities which are n Fig- d speed limits, link lengths and sdensity along each gment utiureau of Puads (BPR) [19]. ei R oute i i cis th uis th dqis the combined flow lution to the above condition n equivalent optimization p 0 Min zd i v i i tv v e c d travel time functions being positive and increasing. The SUE extends the UE concept by considering the fol- lowing assumptions and implications: Traveler has perfect knowledge of the network and travel cost, Traveler will choose the perceived least cost route, Different traveler perceives differently, thus intro- ducing stochas The SUE route choice can then be analyzed using logit model, which treats all alternatives statistically inde- pendent. The formulation in Equation (4) [19]: Min min zvq cv 0 vd i v ii ii i vt vt v The travel time, The third term z(v) = function for a given traffic volume v, c(v) = route c apacity for given traffic volum v = traffic volume for route i, i t = travel time for route i, i dv = change in traffic volume. SUE utilizes multinomial mo signment. Multinomial models u independent and identically distributed mainly with a Gumbel distribution. They response homogeneity across individuals and there is error variance-covariance homo- geneity across individuals. 5. Application of SUE Coamo Route Relocation Study ADT volumes along PR-153 and Route A shown i ure 3. The travel times were formulated using poste ignal selizing Bblic Ro 0C 1tt b V a (5) 0 0 L tS (6) Combining Equations (5) and (6) gives; 0 1 b LV ta SC (7) where, L = link length (mi), S0 = link Free-Flow Speed (FFS), V = link traffic volume in ADT, nk ADT capacity, eters are from Ex- hi]. w for each link V1 and V2 were baiscussed earlier. As sh roximately 5 miles by leroximately 5.5 miles. The first se to Pr-14 to do t = link average travel time (hr), t0 = free flow link traversal time (hr), C = li a and b = The BPR function param bit C30-1 and C30-2 of 2000 HCM [20 The initial traffic flo sed on the O-D survey results d own in Figure 3, Route A is app ngth while PR-153 is app ction of Route A from PR-52 is an uninterrupted flow while the second section which connects wntown is an arterial with two signalized intersection. Therefore signal density for Route A was taken as 0.5 per mile. PR-153 is an arterial with 4 signalized intersection making signal density to be 0.73 per mile. Posted speed limit for Route A is expected to be 55 mph while for Pr-153 is 40 mph. Using exhibit C30-2 in 2000 HCM [18], “a” and “b” values for each link were estimated as; a = 0.31 and b = 3.64 for Route A and a = 0.38 and b = 5.0 for PR-153 PR-153 15, 400 vpd , 2-Lanes ROUTE A 24,600 vpd, 4-Lanes LOS D Capacity = 34,200 5.0 Miles Long 55 MPH Speed Li TO/FROM COAMO LOS D Capacity = 15,500 vpd 5.5 Mil es Long 40 MPH Speed Limit 4 Signals mit 2 signals TO/FROM OTHER CITIES Figure 3. PR-153 and proposed Route A characteristics. Copyright © 2012 SciRes. JTTs 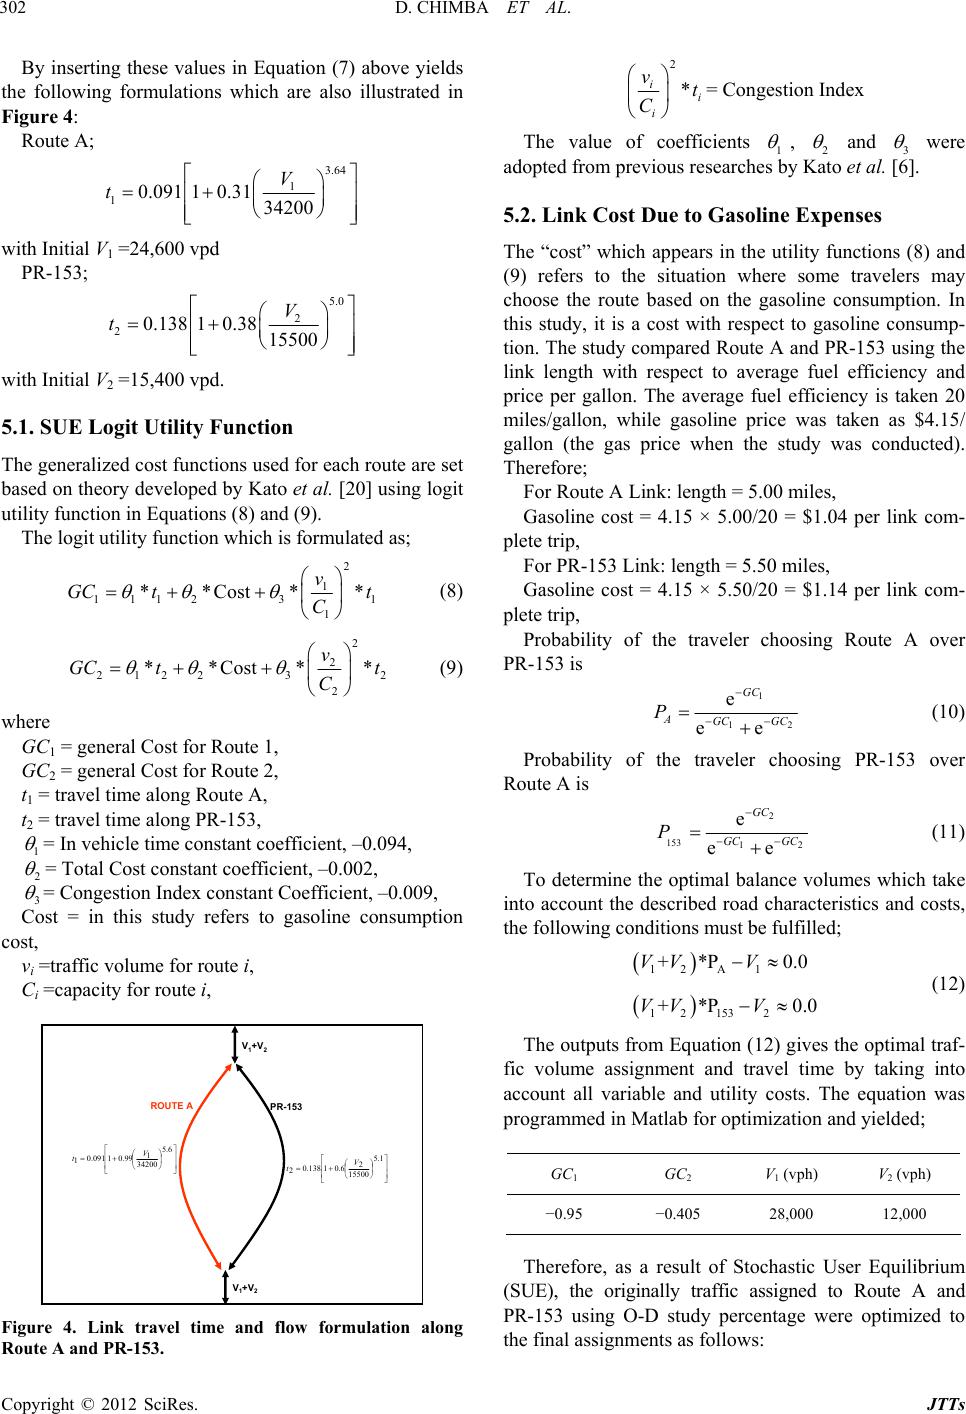 D. CHIMBA ET AL. 302 By inserting these values in Equation (7) above yields the following formulations which are also illustrated in Figure 4: Route A; 3.64 1 10.09110.3134200 V t with Initial V1 =24,600 vpd PR-153; 5.0 2 20.138 10.3815500 V t with Initial V2 =15,400 vpd. 5 n in Equations (8) and (9). tility function which is formulated as; .1. SUE Logit Utility Function The generalized cost functions used for each route are set based on theory developed by Kato et al. [20] using logit utility functio The logit u 2 1 11123 1 **Cost* * v GC tt C 1 (8) 2 2 21223 2 **Cost* * v 2 t t C (9) where ute 1, ute 2, GC GC1 = general Cost for Ro GC2 = general Cost for Ro t1 = travel time along Route A, t2 = travel time along PR-153, 1 = In vehicle time constant coefficient, –0.094, 2 = Total Cost constant coefficient, –0.002, 3 = Congestion Index constant Coefficient, –0.009, ption cost, vi =traffic volume for route i, Ci =capacity for route i, Cost = in this study refers to gasoline consum PR-153 ROUTE A 34200 6.5 1 99.01091.0 1V t 1.5 15500 2 6.01138.0 2V t V1+V2 V1+V2 Figure 2 v * ii t C = i Congestion Index The value of coefficients , 2 and 3 1 were adopted from previous research et al.. 5.2. Link Cost Due to Gasoline Expenses The “cost” which appears in the utility functions (8) and (9) refers to the situation where some travelers may choose the route based on the gasoline consumption. In this study, it is a cost with respect to gasoline consump- tion. The study compared Route A and PR-153 using the link length with respect to average fuel efficiency and price per gallon. The average fuel efficiency is taken 20 Therefore; For Route A Link: len Gasoline cost = 4.15 × r link com- pl om- A over es by Kato [6] miles/gallon, while gasoline price was taken as $4.15/ gallon (the gas price when the study was conducted). gth = 5.00 miles, 5.00/20 = $1.04 pe ete trip, For PR-153 Link: length = 5.50 miles, Gasoline cost = 4.15 × 5.50/20 = $1.14 per link c plete trip, Probability of the traveler choosing Route PR-153 is 1 12 e ee GC AGC GC P (10) Probability of the traveler choosing PR-153 over Route A is 2 153 12 e ee GC GC GC P (11) To determine the optimal balance volumes which take intics and costs, th to account the described road characteris e following conditions must be fulfilled; 12A 1 +*P 0.0VV V 12 1532 +*P 0.0VV V (12) The outputs from Equation (12) gives the optimal traf- fic volume assignment and travel time by taking into account all variable and utility costs. The equation was programmed in Matlab for optimizati on and yielded; GC1 GC2 V1 (vph) V2 (vph) −0.95 −0.405 28,000 12,000 Therefore, as a result of Stochastic User Equilibrium (SUE), the originally traffic assigned to Route A and PR-153 using O-D study percentage were optimized to the final assignments as follows: 4. Link travel time and flow formulation along Route A and PR-153. Copyright © 2012 SciRes. JTTs 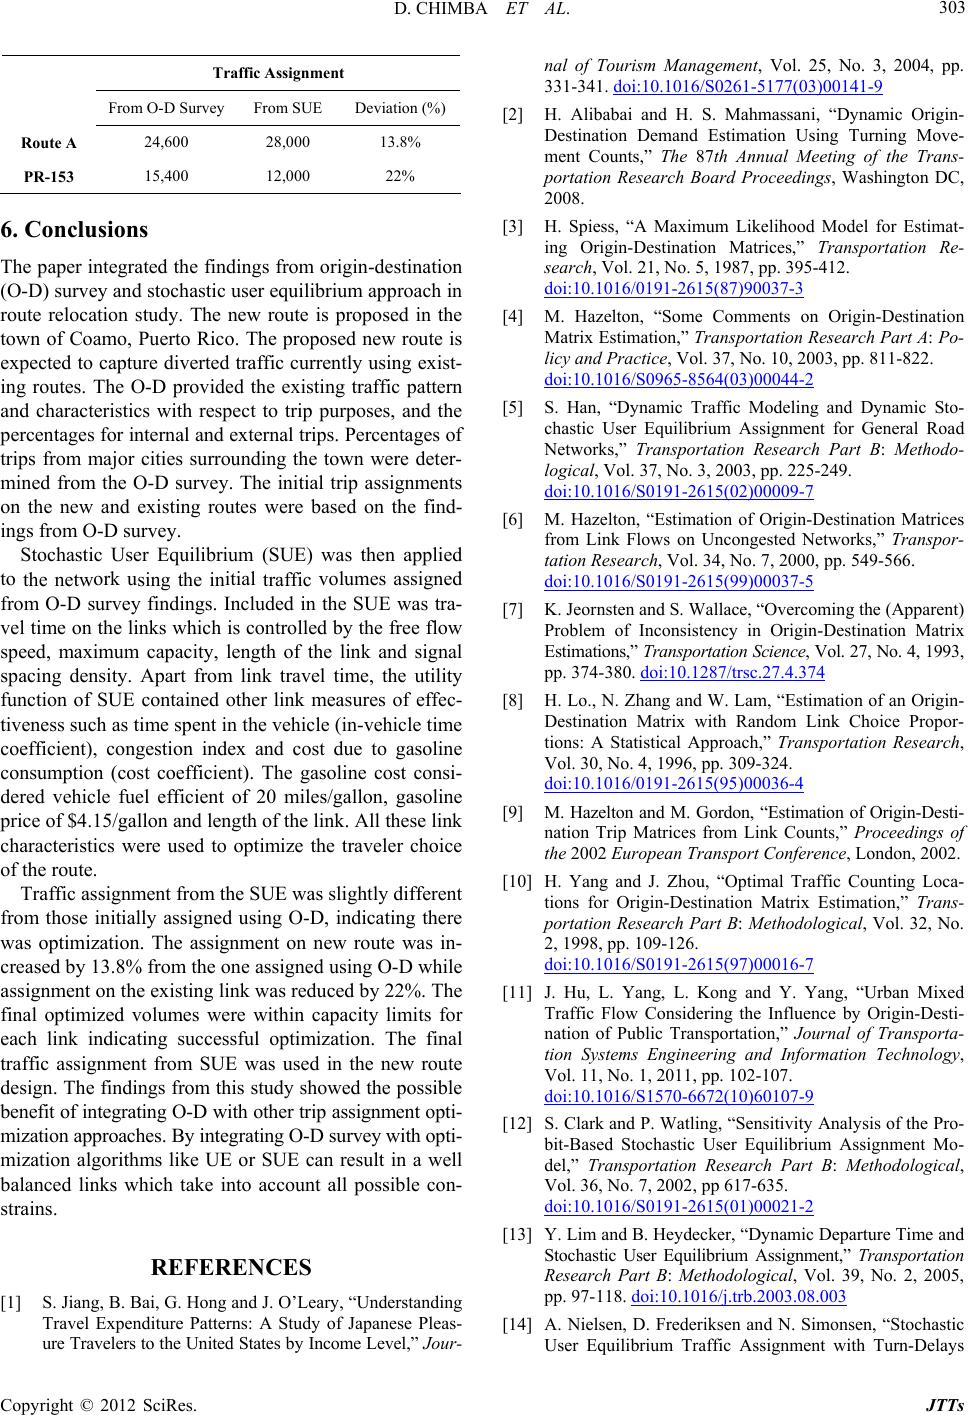 D. CHIMBA ET AL. 303 Traffic Assignment From O-D Survey From SUE Deviation (%) Route A 24,600 28,000 13.8% PR-153 15,400 12,000 22% 6. Conclusions Thaper integrated the findings from origin-destination (O-Dey and ststic userium in routeation ste news propo the townamo, Pu. Thsed nete is ex e town were deter- minedm the O-D surv assignments on thnew atesed- ings from O-D survey. ic Userium was th to ork uitial volumes assigned from O-D survey findings. Included in the SUE was tra- s which is controlled by the free flow ty, length of the link and si assignment on new route was i cr [1] ure Travelers to the United States by Income Level,” Jour- e p ) survochar equilibapproach reloc of Co udy. Th erto Rico route i e propo sed in w rou pected to capture diverted traffic currently using exist- ing routes. The O-D provided the existing traffic pattern and characteristics with respect to trip purposes, and the percentages for internal and external trips. Percentages of trips from major cities surrounding th fro e ey. The initial trip nd existing rous were ba on the find Stochastr Equilib(SUE) en applied the netwsing the intraffic vel time on the link speed, maximum capacignal spacing density. Apart from link travel time, the utility function of SUE contained other link measures of effec- tiveness such as time spent in the vehicle (in-vehicle time coefficient), congestion index and cost due to gasoline consumption (cost coefficient). The gasoline cost consi- dered vehicle fuel efficient of 20 miles/gallon, gasoline price of $4.15/gallon and length of the link. All these link characteristics were used to optimize the traveler choice of the route. Traffic assignment from the SUE was slightly different from those initially assigned using O-D, indicating there was optimization. The n- eased by 13.8% from the one assigned using O-D while assignment on the existing link was reduced by 22%. The final optimized volumes were within capacity limits for each link indicating successful optimization. The final traffic assignment from SUE was used in the new route design. The findings from this study showed the possible benefit of integrating O-D with other trip assignment opti- mization approaches. By integrating O-D survey with opti- mization algorithms like UE or SUE can result in a well balanced links which take into account all possible con- strains. REFERENCES S. Jiang, B. Bai, G. Hong and J. O’Leary, “Understanding Travel Expenditure Patterns: A Study of Japanese Pleas- nal of Tourism Management, Vol. 25, No. 3, 2004, pp. 331-341. doi:10.1016/S0261-5177(03)00141-9 [2] H. Alibabai and H. S. Mahmassani, “Dynamic Origin- Destination Demand Estimation Using Turning Move- ment Counts,” The 87th Annual Meeting of the Trans- portation Research Board Proceedings, Washington DC, 2008. [3] H. Spiess, “A Maximum Likelihood Model for Estimat- ing Origin-Destination Matrices,” Transportation Re- search, Vol. 21, No. 5, 1987, pp. 395-412. doi:10.1016/0191-2615(87)90037-3 [4] M. Hazelton, “Some Comments on Origin-Destination Matrix Estimation,” Transportation Research Part A: Po- licy and Practice, Vol. 37, No. 10, 2003, pp. 811-822. doi:10.1016/S0965-8564(03)00044-2 amic Traffic Modeling [5] S. Han, “Dynand Dynamic Sto- chastic User Equilibrium Assignment for General Road Networks,” Transportation Research Part B: Methodo- logical, Vol. 37, No. 3, 2003, pp. 225-249. doi:10.1016/S0191-2615(02)00009-7 [6] M. Hazelton, “Estimation of Origin-Destination Matrices from Link Flows on Uncongested Networks,” Transpor- tation Research, Vol. 34, No. 7, 2000, pp. 549-566. doi:10.1016/S0191-2615(99)00037-5 [7] K. Jeornsten and S. Wallace, “Overcoming the (Apparent) Problem of Inconsistency in Origin-Destination Matrix Estimations,” Tran sportation Science, Vol. 27, No. 4, 1993, pp. 374-380. doi:10.1287/trsc.27.4.374 [8] H. Lo., N. Zhang and W. Lam, “Estimation Destination Matrix with Random L of an Origin- ink Choice Propor- tions: A Statistical Approach,” Transportation Research, Vol. 30, No. 4, 1996, pp. 309-324. doi:10.1016/0191-2615(95)00036-4 [9] M. Hazelton and M. Gordon, “Estimation of Origin-Desti- ion,” Trans- gical, Vol. 32, No. nation Trip Matrices from Link Counts,” Proceedings of the 2002 European Transport Conference, London, 2002. [10] H. Yang and J. Zhou, “Optimal Traffic Counting Loca- tions for Origin-Destination Matrix Estimat portation Research Part B: Methodolo 2, 1998, pp. 109-126. doi:10.1016/S0191-2615(97)00016-7 [11] J. Hu, L. Yang, L. Kong and Y. Yang, “Urban M Traffic Flow Considering the Influenc ixed e by Origin-Desti- nation of Public Transportation,” Journal of Transporta- tion Systems Engineering and Information Technology, Vol. 11, No. 1, 2011, pp. 102-107. doi:10.1016/S1570-6672(10)60107-9 [12] S. Clark and P. Watling, “Sensitivity Analysis of the Pro- bit-Based Stochastic User Equilibrium Assignment Mo- del,” Transportation Research Part B: Methodological, Vol. 36, No. 7, 2002, pp 617-635. doi:10.1016/S0191-2615(01)00021-2 [13] Y. Lim and B. Heydecker, “Dynamic Departure Time and Stochastic User Equilibrium Assignment,” Transportation Research Part B: Methodological, Vol. 39, No. 2, 2005, pp. 97-118. doi:10.1016/j.trb.2003.08.003 [14] A. Nielsen, D. Frederiksen and N. Simonsen, “Stochastic User Equilibrium Traffic Assignment with Turn-Delays Copyright © 2012 SciRes. JTTs  D. CHIMBA ET AL. Copyright © 2012 SciRes. JTTs 304 national Transactions in Opera- p. 555-568. in Intersections,” Inter tional Research, Vol. 5, No. 6, 1998, p doi:10.1111/j.1475-3995.1998.tb00137.x [15] M. Hazelton, “Some Remarks on Stochastic User Equi- librium,” Transportation Research Part B: Methodologi- cal, Vol. 32, No. 2, 1998, pp. 101-108. doi:10.1016/S0191-2615(97)00015-5 o-Stage Stochastic valuation of Count ation of O-D Ma- [16] X. Fei and H. S. Mahmassani, “A Tw Model for the Sensor Location Problem in a Large-Scale Network,” The 87th Annual Meeting of the Transporta- tion Research Board Proceedings, Washington DC, 2008. [17] K. N. Paul and H. K. L. William, “E Location Selection Methods for Estim trices,” Journal of Transportation Engineering, Vol. 124, No. 4, 1998, pp. 376-383. doi:10.1061/(ASCE)0733-947X(1998)124:4(376) [18] Highway Capacity Manual, “Transportation Research pes of Travel Demand Tech- Trans- Board,” National Research Council, Washington DC, 2000. [19] M. G. H. Bell and H. W. K. Lam, G. Ploss and D. Inaudi, “Stochastic User Equilibrium Assignment and Iterative Balancing,” Proceedings of the 12th International Sym- posium on Transportation and Traffic Theory, Berkeley, 1993. [20] S. Kato, Y. Kaneko and M. Inoue, “Empirical Analysis on Relationship Between Ty niques and Estimated User’s Benefit Stemming from portation Investment,” Journal of the Eastern Asia Society for Transportation Studies, Vol. 6, 2005, pp. 3937-3947. |