

Paper Menu >>
Journal Menu >>
 Journal of Biomaterials and Nanobiotechnology, 2012, 3, 462-468 http://dx.doi.org/10.4236/jbnb.2012.34047 Published Online October 2012 (http://www.SciRP.org/journal/jbnb) Study of Photoinduced Interaction between Calf Thymus-DNA and Bovine Serum Albumin Protein with H2Ti3O7 Nanotubes Rajesh Chakraborty1*, Sriparna Chatterjee2, Sandipan Sarkar3*, Pabitra Chattopadhyay1 1Department of Chemistry, Burdwan University, Burdwan, India; 2Institute of Physics, Bhubaneswar, India; 3Durgapur Institute of Advanced Technology and Management, Durgapur, India. Email: *[email protected], *[email protected] Received June 21st, 2012; revised July 24th, 2012; accepted August 14th, 2012 ABSTRACT Hydrogen titanate nanotubes were synthesized by hydrothermal process using 10 M NaOH and TiO2 anatase powder. The material synthesized was characterized by X-ray diffraction (XRD), scanning electron microscopy (SEM) and transmission electron microscopy (TEM) to ensure the structural and morphological characteristics. The interaction of calf thymus DNA (CT-DNA) and bovine serum albumin protein with suspended aqueous solution of titanate nanotubes was investigated using UV absorption spectroscopy and the apparent association constant was found to be, Kb= 1.68 × 10⁴ M –1 and Kap=5.41 × 10³ M –1 for DNA and BSA respectively. Addition of the titanate nano material resulted quenching of fluorescence spectra of ethidium bromide-DNA in tris HCl buffer solution and that of aqueous protein solution. The apparent binding constant (Ksv= 5.46 × 10⁴ M–1 for DNA binding and Ksv = 6.063 × 10³ M–1 for protein binding) was deduced from relevant fluorescence quenching data using Stern-Volmer equation. Keywords: Photoinduced Interaction; Nanotubes; Hydrothermal Process 1. Introduction One-dimensional nanostructures have drawn a great at- tention due to their potential applications in a variety of novel devices in recent past [1-5]. The most fascinating example of such nanostructure is of course carbon nano- tubes. Several efforts were made to synthesize nanorods and nanowires of more complex structure and cones- quently a number of one-dimensional nanomaterials in- cluding metals, oxides and nitrides have also been re- ported. Hydrothermal or solvothermal synthesis is an very important approach to produce oxidic nanowires and nanotubes because synthesis of these types provide ac- cess to uniform and distinct morphologies in large scales with remarkable reliability, selectivity, and efficiency [6]. Among the one-dimensional oxidic nanomaterials re- ported, titanium oxide is of particular interest for its wide applications as catalyst supports, semiconductor photo- catalysts and sensors [7-9]. TiO2 nanoparticles are acting as biosensors in chemical and biochemical fields and their applications are becoming more extensive. These probes have been applied to the ultrasensitive detection of proteins, DNA sequencing, clinical diagnostics, etc. TiO2 nanoparticles have also been used as carriers for photosensitizer like porphyrins in photodynamic therapy for cancer treatment. Titanate nanotubes of nearly 8 nm in diameter were first reported by Kasuga and co-work- ers, employing a hydrothermal treatment of rutile TiO2 powders in strong aqueous solution of NaOH at 110˚C followed by HCl washing [10]. Several number of papers were published afterwards on the structure of hydrother- mally synthesized TiO2 which also gave birth of a num- ber controversies. Finally Chen et al. concluded that these nanotubes were of H2Ti3O7 structure based on dif- fraction and high-resolution transmission electron mi- croscopy (HRTEM) results [11]. Over the past decade a significant number of papers have been published on the specific interaction between photoactive nanocrystalline metal oxide semiconductor particles and DNA or proteins or other biomolecules [12-18]. Interestingly research works of these types open up the possibility of the electronic transduction of DNA sequence and hybridization, as well as development of new electrochemical probes for DNA-binding proteins, both of which are major challenges in bioelectronics [16, 19,20]. Deoxyribonucleic acid (DNA) is unique genetic molecule in any living organism. Consequently the qualitative and quantitative analysis of nucleic acids is *Corresponding authors. Copyright © 2012 SciRes. JBNB  Study of Photoinduced Interaction between Calf Thymus-DNA and Bovine Serum Albumin Protein with H2Ti3O7 Nanotubes 463 attracting a great attention because this is the material base of genetic inheritance. On the other hand Serum albumin is the most plentiful protein in blood plasma. It is a large globular protein containing 582 amino-acid residues with a molecular weight of 69,000 Dalton and two tryptophan moieties at positions 134 and 212 as well as tyrosine and phenylalanine [21] Each protein molecule can carry seven fatty acid molecules. They bind in deep crevices in the protein, burying their carbon-rich tails safely away from the surrounding water. Serum albumin also binds to many other water-insoluble molecules. The strong affinity of BSA to the water molecules has made the protein an automatic choice for the interaction studies in the present work. Moreover BSA is used as protein model because of its stability, its lack of effect in many biochemical reactions, and its low cost. BSA has numer- ous biochemical applications including Enzyme-Linked Immunosorbent Assay immunoblots, and immunohisto- chemistry [22]. It is also used as a nutrient in cell and microbial culture. BSA is used to stabilize some enzymes during digestion of DNA and to prevent adhesion of the enzyme to reaction tubes. This protein does not affect other enzymes that do not need it for stabilization. The binding properties of BSA with various drugs have been fully investigated by many researchers [23-25]. In this present work, interaction between suspended H2Ti3O7 nanotubes (in aqueous solution) and CT-DNA, followed by BSA protein and was examined by UV and fluores- cence spectroscopy. As the natural fluorescence intensity of DNA is very weak, ethidium bromide (EB) was used to enhance the fluorescence intensity while BSA shows intrinsic fluorescence due to the presence of aromatic amino-acid residues. 2. Materials and Methods 2.1. Materials CT-DNA and TiO2 (AR grade) was purchased from Merck (Mumbai, India) while ehidium bromide and bo- vine serum albumin protein was purchased from Sigma Aldrich. Approximately 10–4 M stock solution of CT- DNA was prepared by dissolving proper amount of DNA in 1 M tris buffer. 2.2. Preparation of\Hydrogen Titanate Nanotubes (HTO) A 1.0 g potion of anatase TiO2 powder was dissolved in 10M NaOH solution and the resulting suspension was then transferred in an autoclavable reaction chamber. The reaction chamber was autoclaved in an oven at a tem- perature of 130˚C for 22 hours. The product was filtered after cooling down to room temperature and thoroughly washed with 1 M HCl and water to remove any trace of NaCl produced during washing [26]. Subsequently the material was dried at ambient temperature. 2.3. Characterization of HTO The powder X-ray diffraction (XRD) data were recorded from a PANalytical X’pert Pro diffractometer with Cu Kα radiation. The morphology of the nanostructured samples was studied with use of a Jeol JSM-840 scan- ning electron microscope (SEM) operating at 120 keV. TEM studies of nanotubes were carried out with a FEI Tecnai TEM equipped with a LaB6 filament and operated at 200 kV. TEM samples were prepared by placing a drop of the ultrasonically dispersed powder (in ethanol) on a carbon-coated copper grid and drying in air. 2.4. Fluorescence Quenching Measurements A Hitachi F-4500 fluorescence spectrophotometer was used to perform the fluorescence quenching measure- ments. The excitation wave length of EB-DNA was kept fixed at 522.0 nm while the emission wave length was chosen at 400.0 nm. The excitation and emission slit length (5 nm and 10 nm respectively) wave lengths as well as the scan speed (2400 nm/min) were kept fixed throughout the experiment. For BSA-HTO interaction study the excitation and emission wavelength was kept fixed at 510 nm and 435 nm respectively with all the other conditions remaining the same as before. 2.5. Absorption Spectral Measurements To carry out the absorption spectral measurements, a JASCO V-570 UV-Vis spectrophotometer was used. For each measurement, 4.0 mL solution, containing DNA, suspended solution of nanoparticle and tris buffer was taken. At first the UV-vis spectrum was recorded for a solution without DNA. For the rest of the solutions, DNA was added with an increment of 0.05 mL each and then the spectra for all the solutions were recorded in the range of 200 - 800 nm. BSA absorbs light energy around 280 nm. So the absorption spectra for purely aqueous solution of BSA (10–2 M) was recorded at the beginning and then suspended aqueous solution of HTO was added. 3. Results and Discussions 3.1. Structural and Morphological Studies of HTO X-ray diffraction pattern of HTO is shown in Figure 1 This diffraction pattern mostly matches with the mono- clinic crystal structure of H2Ti3O7 (space group C2/m (12)) (JCPDS Card no. 41-0192). Figure 2 shows the Copyright © 2012 SciRes. JBNB  Study of Photoinduced Interaction between Calf Thymus-DNA and Bovine Serum Albumin Protein with H2Ti3O7 Nanotubes 464 Figure 1. XRD spectra of HTO. Figure 2. SEM image of H2Ti3O7 nanotubes. SEM images of the nanostructured samples hydrother- mally synthesized from anatase powder. The scanning electron micrograph shows the formation of one dimen- sional (1-D) nanostructures. Further TEM study (Figure 3) clearly shows that the each 1-D units are actually hol- low, multiwalled nanotubes with inner diameter of 4 - 5 nm and the outer diameter of 9 - 10 nm. 3.2. UV Absorption Study by CT DNA and BSA with HTO Figure 4 shows the absorption spectra of CT-DNA in presence of suspended aqueous solution of HTO. The concentration of suspended HTO was kept constant for all sets of experiments while the concentration of DNA was increased uniformly. In presence of HTO the ab- sorbance of DNA increases considerably with increasing concentration of DNA. Similar type of experiment was Figure 3. TEM image of H2Ti3O7 nanotubes. Figure 4. Electronic spectral titration HTO with CT-DNA at 266 nm in tris-HCl buffer; [HTO] = 2.5 × 10⁻⁵; [DNA]: (a) 0.0, (b) 6.2 × 10⁻⁶, (c) 10.0 × 10⁻⁶, (d) 15.2 × 10⁻⁶, (e) 20.6 × 10⁻⁶ mol·L–1. Arrow indicates the direction of change upon the increase of DNA concentration. performed with BSA and HTO and the only difference is that the concentration of BSA was kept constant through- out the experiment. Figure 5 shows the gradual increase of absorption spectra with increasing concentration of HTO. To make it confirm that the absorption change which we observed in the spectrum was not due the ex- perimental error, baseline corrections were done for all the measurements. Therefore the results clearly indicate that there is a interaction between suspended HTO and CT DNA/BSA through the formation of some complex of the type HTO7DNA, HTO-BSA [27,28]. 3.3. Fluorescence Quenching Study of EB-CT DNA by HTO As it has been mentioned earlier that the natural fluores- Copyright © 2012 SciRes. JBNB  Study of Photoinduced Interaction between Calf Thymus-DNA and Bovine Serum Albumin Protein with H2Ti3O7 Nanotubes 465 cence intensity of DNA is very weak, ethidium bromide (EB) was used as fluorescence probe for DNA. Figure 6 shows that addition of suspended aqueous solution of HTO to a solution of EB-DNA resulted in a decrease in fluorescence emission intensity of EB-DNA. HTO solu- tion was added in increasing concentration keeping the EB-DNA concentration constant for all the measure- ments. Fluorescence quenching study of BSA was car- ried out in similar fashion keeping the concentration of BSA solution fixed. Figure 7 shows the quenching of Figure 5. Electronic spectral titration of HTO with BSA at 280 nm in water.[BSA] is constant and [HTO]: (a) 1.25 × 10⁻⁵; (b) 2.5 × 10⁻⁵; (c) 3.75 × 10⁻⁵; (d) 5.0 × 10⁻⁵; (e) 6.25 × 10⁻⁵ mol·L−1. Arrow indicates the direction of change upon the increase of HTO concentration. Figure 6. Emission spectra of the CT-DNA-EB system in tris–HCl buffer upon the titration of the HTO. kex = 522 nm; [EB] = 9.6 × 10⁻⁵ mol·L–1; [DNA] = 1.25 × 10⁻⁵; [Complex]: (a) 0.0; (b) 1.25 × 10⁻⁵; (c) 2.5 × 10⁻⁵; (d) 3.75 × 10⁻⁵; (e) 5.0 × 10⁻⁵ mol·L–1. Arrow shows the intensity change upon the increase of the complex concentration. Figure 7. Emission spectra of the aqueous solution of BSA upon the titration of the HTO. [BSA] is constant [HTO]: (a) 1.25 × 10⁻⁵; (b) 2.5 × 10⁻⁵; (c) 3.75 × 10⁻⁵; (d) 5.0 × 10⁻⁵; (e) 6.25 × 10⁻⁵ mol·L−1. Arrow indicates the direction of change upon the increase of HTO concentration. BSA protein with increasing concentration of HTO. Baseline correction was done for all the measurements to get rid of the probable scattering effect due to the sus- pended nature of HTO in aqueous medium. It ensures that fluorescence quenching occurs only due to interact- tion between CT DNA/BSA and HTO. 3.4. Determination of Binding Constant between CT DNA and HTO In order to further illustrate the binding strength of the HTO with CT-DNA, the intrinsic binding constant Kb was determined from the spectral titration data using the following equation: afbfbbf DNADNA1 K where [DNA] is the concentration of DNA, f, a and b correspond to the extinction coefficient, respectively, for the free HTO, for each addition of DNA to the suspended solution of HTO and for the HTO-DNA complex in the fully bound form. A plot of af DNA versus [DNA], gives Kb, the intrinsic binding constant as the ratio of slope to the intercept. From the af DNA versus[DNA] plot (Figure 8), the binding constant Kb for the HTO-DNA complex was determined to be 1.68 × 10⁴ M–1 (R = 0.97208 for four points). Fluorescence intensity of EB bound to DNA at 522 nm shows a decreasing trend with the increasing concentra- tion of the HTO (Figure 6). The quenching of EB bound to DNA by the titanate nanorods are in agreement with Copyright © 2012 SciRes. JBNB 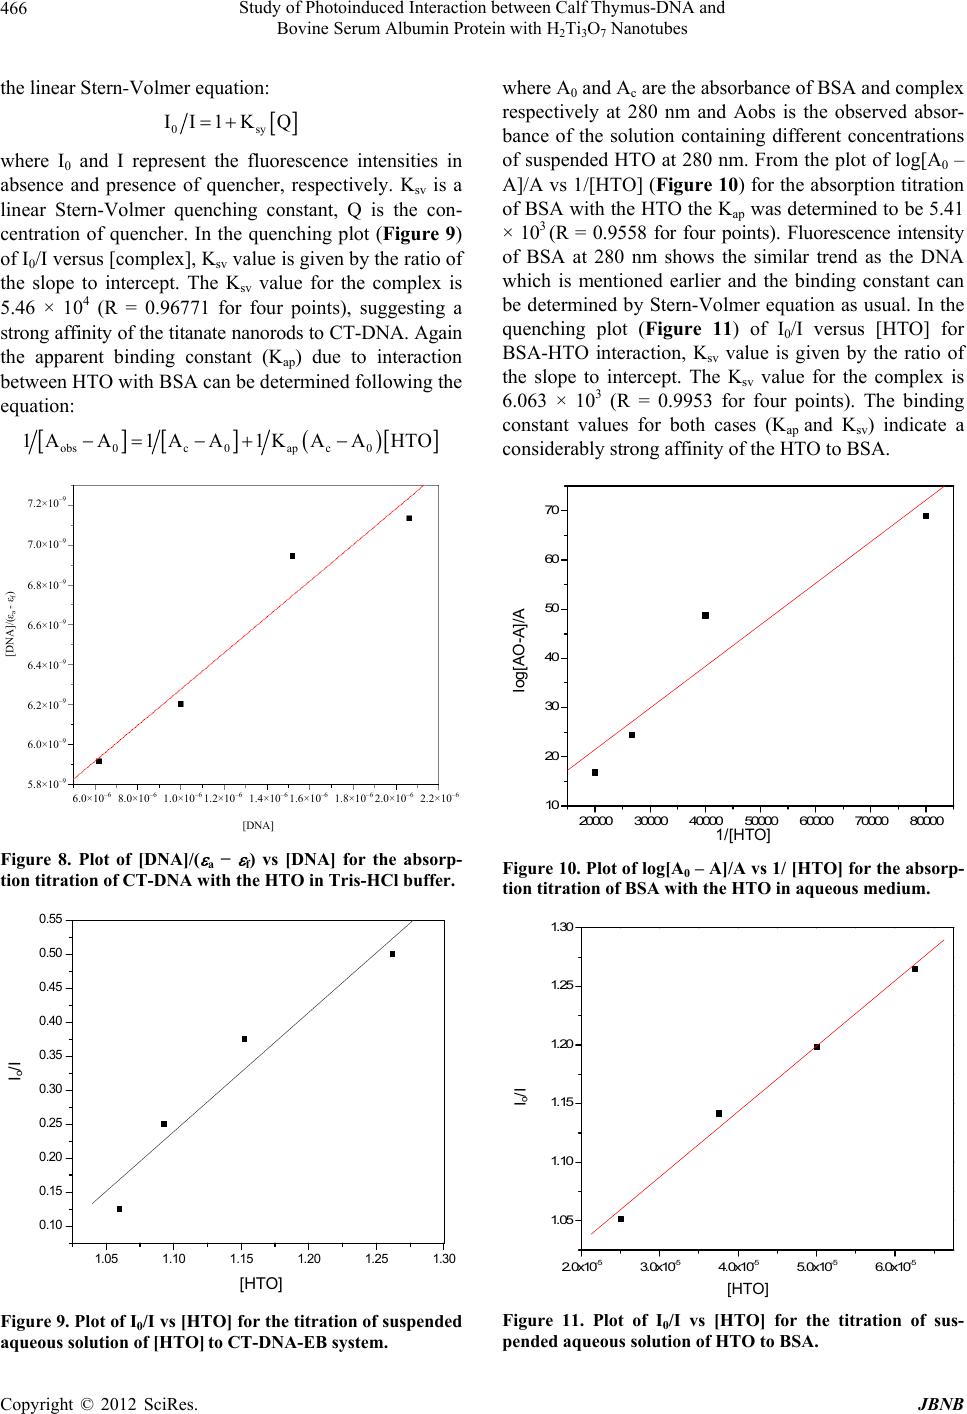 Study of Photoinduced Interaction between Calf Thymus-DNA and Bovine Serum Albumin Protein with H2Ti3O7 Nanotubes 466 the linear Stern-Volmer equation: 0sy II1K Q where I0 and I represent the fluorescence intensities in absence and presence of quencher, respectively. Ksv is a linear Stern-Volmer quenching constant, Q is the con- centration of quencher. In the quenching plot (Figure 9) of I0/I versus [complex], Ksv value is given by the ratio of the slope to intercept. The Ksv value for the complex is 5.46 × 10⁴ (R = 0.96771 for four points), suggesting a strong affinity of the titanate nanorods to CT-DNA. Again the apparent binding constant (Kap) due to interaction between HTO with BSA can be determined following the equation: obs0c0ap c0 1AA1AA 1KAAHTO 6.0×10 – 6 8.0×10 – 6 1.0×10 – 6 1.2×10 – 6 1.4×10 – 6 1.6×10 – 6 1.8×10 – 6 2.0×10 – 6 2.2×10 – 6 [DNA] 7.2×10 – 9 7.0×10 –9 6.8×10 –9 6.6×10 –9 6.4×10 –9 6.2×10 –9 6.0×10 –9 5.8×10 –9 [DNA]/ (ε a - ε f ) Figure 8. Plot of [DNA]/( a − f) vs [DNA] for the absorp- tion titration of CT-DNA with the HTO in Tris-HCl buffer. 1.05 1.10 1.15 1.20 1.25 1.30 0.10 0.15 0.20 0.25 0.30 0.35 0.40 0.45 0.50 0.55 I0/ I [HTO] [HTO] Io/I Figure 9. Plot of I0/I vs [HTO] for the titration of suspended aqueous solution of [HTO] to CT-DNA-EB system. where A0 and Ac are the absorbance of BSA and complex respectively at 280 nm and Aobs is the observed absor- bance of the solution containing different concentrations of suspended HTO at 280 nm. From the plot of log[A0 – A]/A vs 1/[HTO] (Figure 10) for the absorption titration of BSA with the HTO the Kap was determined to be 5.41 × 10³ (R = 0.9558 for four points). Fluorescence intensity of BSA at 280 nm shows the similar trend as the DNA which is mentioned earlier and the binding constant can be determined by Stern-Volmer equation as usual. In the quenching plot (Figure 11) of I0/I versus [HTO] for BSA-HTO interaction, Ksv value is given by the ratio of the slope to intercept. The Ksv value for the complex is 6.063 × 10³ (R = 0.9953 for four points). The binding constant values for both cases (Kap and Ksv) indicate a considerably strong affinity of the HTO to BSA. 20000 30000 4000050000 60000 70000 80000 10 20 30 40 50 60 70 log [A0 -A]/A 1/[HTO] 1/[HTO] Iog[AO-A]/A Figure 10. Plot of log[A0 – A]/A vs 1/ [HTO] for the absorp- tion titration of BSA with the HTO in aqueous medium. 2.0x10 -5 3.0x10 -5 4.0x10 -5 5.0x10 -5 6.0x10 -5 1.05 1.10 1.15 1.20 1.25 1.30 I 0 /I [ HTO ] [HTO] I o /I Figure 11. Plot of I0/I vs [HTO] for the titration of sus- pended aqueous solution of HTO to BSA. Copyright © 2012 SciRes. JBNB  Study of Photoinduced Interaction between Calf Thymus-DNA and Bovine Serum Albumin Protein with H2Ti3O7 Nanotubes 467 4. Conclusion Study of photoinduced interaction between HTO and CT DNA using UV and fluorescence spectroscopic tools established that the interaction is quite strong which is also revealed by the high binding constant. The present work may be helpful in understanding the interaction between various photosensitizers and DNA. Clinical ap- plication of the existing photosensitizer is associated with some problems such as aggregation of photosensitizers in aqueous medium, decrease in quantum yield due to ag- gregation, toxicity etc. HTO nano particles can overcome all the above mentioned problems. This observation can also be considered with importance to investigate such interaction between nanotubes and DNA for future ap- plication in photodynamic therapy. This study of interac- tion of HTO with physiologically important BSA protein will provide some necessary information for the design and application of new drugs. ultrasensitive detection of proteins, clinical diagnostics etc. 5. Acknowledgements Financial assistance from UGC-DAE Center for Scien- tific Research, Kolkata is gratefully acknowledged. The authors are obliged to Prof. P. Ayyub of Department of Condensed Matter Physics and Material Sciences, Tata Institute of Fundamental Research for providing TEM and SEM facilities. REFERENCES [1] S. Iijima, “Helical Microtubules of Graphitic Carbon,” Nature, Vol. 354, No. 6348, 1991, pp. 56-58. doi:10.1038/354056a0 [2] T. Kasuga, M. Hiramatsu, A. Hoson, T. Sekino and K. Niihara, “Titania Nanotubes Prepared by Chemical Proc- essing,” Advanced Materials, Vol. 11, No. 15, 1999, pp. 1307-1310. doi:10.1002/(SICI)1521-4095(199910)11:15<1307::AID- ADMA1307>3.0.CO;2-H [3] H. Dai, “Carbon Nanotubes: Opportunities and Chal- lenges,” Surface Science, Vol. 500, No. 1, 2002, pp. 218- 241. doi:10.1016/S0039-6028(01)01558-8 [4] A. R. Armstrong, G. Armstrong, J. Canales and P. G. Bruce, “TiO2-B Nanowires,” Angewandte Chemie Inter- national Edition, Vol. 43, No. 17, 2004, pp. 2286-2288. doi:10.1002/anie.200353571 [5] D. Wu, X. Zhao, J. Liu, A. Li, Y. Chen and N. Ming, “Sequence of Events for the Formation of Titanate Nano- tubes, Nanofibers, Nanowires, and Nanobelt,” Cheistry of Material, Vol. 18, No. 18, 2006, pp. 547-553. doi:10.1021/cm0519075 [6] G. R. Patzke, F. Krumeich and R. Nesper, “Oxidic Nano- tubes and Nanorods—Anisotropic Modules for a Future Nanotechnology,” Angewandte Chemie International Edi- tion, Vol. 41, No. 14, 2002, pp. 2446-2461. [7] S. Matsuda and A. Kato, “Titanium Oxide Based Cata- lysts—A Review,” Applied Catalysis, Vol. 8, No. 2, 1983, pp. 149-165. doi:10.1016/0166-9834(83)80076-1 [8] D. V. Bavykin, J. M. Friedrich and F. C. Walsh, “Pro- tonated Titanates and TiO2 Nanostructured Materials: Synthesis, Properties, and Applications,” Advanced Ma- terials, Vol. 18, No. 4, 2006, pp. 2807-2824. doi:10.1002/adma.200502696 [9] O. K. Varghese, D. Gong, M. Paulose, K. G. Ong and C. A. Grimes, “Hydrogen Sensing Using Titania Nano- tubes,” Sensors and Acuators B, Vol. 93, No. 1, 2003, pp. 338-344. doi:10.1016/S0925-4005(03)00222-3 [10] T. Kasuga, M. Hiramatsu, A. Hoson, T. Sekino and K. Niihara, “Formation of Titanium Oxide Nanotube,” Lang- muir, Vol. 14, No. 4, 1998, pp. 3160-3163. [11] Q. Chen, G. H. Du, S. Zhang and L. M. Peng, “The Structure of Trititanate Nanotubes,” Acta Crystallography B, Vol. 58, 2002, pp. 587-590. doi:10.1107/S0108768102009084 [12] G. Raschke, S. Kowarik, T. Franzl, C. T. So1nnichsen, A. Klar and J. Feldmann, “Biomolecular Recognition Based on Single Gold Nanoparticle Light Scattering,” Nano Letters, Vol. 3, No. 7, 2003, pp. 935-938. [13] C. D. Hodneland and M. Mrksich,“Biomolecular Surfaces that Release Ligands under Electrochemical Control,” Journal of the American Chemical Society, Vol. 122, No. 17, 2000, pp. 4235-4236. [14] F. Patolsky, A. Lichtenstein and I. Willner, “Amplified Microgravimetric Quartz-Crystal-Microbalance Assay of DNA using Oligonucleotide-Functionalized Liposomes or Biotinylated Liposomes,” Journal of the American Che- mical Society, Vol. 122, No. 2, 2000, pp. 418-419. doi:10.1021/ja992834r [15] T. Paunesku, T. Rajh, G. Wiederrecht, J. Maser, S. Vogt and N. Stojićević, “Biology of TiO2—Oligonucleotide Nanocomposite,” Nature Materials, Vol. 2, No. 5, 2003, pp. 343-346. doi:10.1038/nmat875 [16] T. Rajh Saponjic, Z. Liu, J. Dimitrijevic, N. M. Scherer, N. F. Vega-Arroyo, M. Zapol, P. Curtiss and L. A. Thur- nauer, “Charge Transfer across the Nanocrystalline-DNA Interface: Probing DNA Recognition,” Nano Letters, Vol. 4, No. 6, 2004, pp. 1017-1023. doi:10.1021/nl049684p [17] R. K. Behera, S. Goyal and S. Mazumdar, “Modification of the Heme Active Site to Increase the Peroxidase Activ- ity of Thermophilic Cytochrome P450: A Rational Ap- proach,” Journal of Inorganic Biochemistry, Vol. 104, No. 11, 2010, pp. 1185-1194. [18] M. Ray, S. Chatterjee, T. Das, S. Bhattacharyya, P. Ay- yub and S. Mazumdar, “Conjugation of Cytochrome C with Hydrogen Titanate Nanotubes: Novel Conforma- tional State with Implications for Apoptosis,” Nanotech- nology, Vol. 22, 2011, pp. 415705-415713. [19] S. Chatterjee, K. Bhattacharyya, P. Ayyub and A. K. Tyagi, “Photocatalytic Properties of One-Dimensional Nanostructured Titanates,” The Journal of Physical Chemistry C, Vol. 114, No. 20, 2010, pp. 9424-9430. Copyright © 2012 SciRes. JBNB  Study of Photoinduced Interaction between Calf Thymus-DNA and Bovine Serum Albumin Protein with H2Ti3O7 Nanotubes Copyright © 2012 SciRes. JBNB 468 doi:10.1021/jp1016642 [20] G. H. Du, Q. Chen, R. C. Che, Z. Y. Yuan and L. M. Peng, “Preparation and Structure Analysis of Titanium oxide Nanotubes,” Applied Physics Letters, Vol. 79, No. 22, 2001, pp. 3702-3705. doi:10.1063/1.1423403 [21] L. A. Sklar, B. S. Hudson and R. D. Simoni, “Conjugated Polyene Fatty Acids as Fluorescent Probes: Binding to Bovine Serum Albumin,” Biochemistry, Vol. 16, No. 23, 1977, pp. 5100-5108. doi:10.1021/bi00642a024 [22] D. Gao, Y. Tian, F. Liang, D. Jin, Y. Chen, H. Zhang and Yu. Aimin, “Investigation on the pH-Dependent Binding of Eosin Y and Bovine Serum Albumin by Spectral Methods,” Journal of Luminescence, Vol. 127, No. 2, 2007, pp. 515-522. doi:10.1016/j.jlumin.2007.02.062 [23] H. W. Zhao, M. Ge, Z. X. Zhang, W. F. Wang and G. Z. Wu, “Spectroscopic Studies on the Interaction between Riboflavin and Albumins,” Spectrochimica Acta A , Vol. 65, No. 3-4, 2006, pp. 811-817. doi:10.1016/j.saa.2005.12.038 [24] Y. B. Yin, Y. N. Wang and J. B. Ma, “Aggregation of Two Carboxylic Derivatives of Porphyrin and Their Af- finity to Bovine Serum Albumin,” Spectrochimica Acta Part A, Vol. 64, No. 4, 2006, pp. 1032-1038. doi:10.1016/j.saa.2005.09.012 [25] A. Kathiravan and R. Renganathan, “Photoinduced Inter- actions between Colloidal iO2 Nanoparticles and Calf Thymus-DNA,” Polyhedron, Vol. 28, No. 7, 2009, pp. 1374-1378. doi:10.1016/j.poly.2009.02.040 [26] A. Kathiravan, R Renganathan and S. Anandan, “Interac- tion of Colloidal AgTiO2 Nanoparticles with Bovine Se- rum Albumin,” Polyhedron, Vol. 28, No. 1, 2009, pp. 157-161. [27] A. M. Pyle, J. P. Rehmann, R. Meshoyrer, C. V. Kumar, N. J. Turro and J. K. Barton, “Mixed-Ligand Complexes of Ruthenium(II): Factors Governing Binding to DNA,” Journal of the American Chemical Society, Vol. 111, No. 8, 1989, pp. 3051-3058. [28] O. Stern and M. Volmer, “Über die Abklingzeit der Fluo- reszenz,” Zeitschrift für Physik, Vol. 20, 1919, pp. 183- 188. |