

Paper Menu >>
Journal Menu >>
 Open Journal of Forestry 2012. Vol.2, No.4, 207-212 Published Online October 2012 in SciRes (http://www.SciRP.org/journal/ojf) http://dx.doi.org/10.4236/ojf.2012.24025 Copyright © 2012 SciRes. 207 Estimation of Population of Ten Selected Forest Tree Species Used by Communities around Kalinzu Forest Reserve, South-Western Uganda Adalbert Aine-Omucunguzi1, Grace Kagoro Rugunda2, Dominic Byarugaba2 1Department of Biology, Kabale University, Kabale, Uganda 2Department of Biology, Mbarara University of Science and Technology, Mbarara, Uganda Email: [email protected] Received January 23rd, 2012; revised April 12th, 2012; accepted April 29th, 2012 Local communities depend on Kalinzu Forest Reserve (KFR) for plant resources. This resource utilization affects the population of tree species in the forest. This study set out to estimate the population of ten tree species in the forest. Results of this study are hoped to provide a basis for studying future changes in population dynamics of the species. The ten species selected were: Newtonia buchananii, Cynometra al- exandrei, Teclea nobilis, Prunus africana, Entandrophragma exelsum, Sapium ellipticum, Diospyros abyssinica, Zanthoxylum gilletii, Rytiginia kigeziensis and Spathodea nilotica. Their selection was based on the results of a study (Aine-Omucunguzi et al., 2010) about utilization of plant resources by the local people around KFR. Species with high demand from the local people were selected. Alternate nested quadrants along five line transects, were used to estimate the population. The plants were categorized into three classes as trees (>5 cm diameter at breast height), saplings (2 cm root collar diameter - 5 cm diame- ter at breast height) and wildings (<2 cm root collar diameter). Population, population density, relative density, frequency, and relative frequency of each species were determined. Generally, the number of wildings, saplings and trees of each species increased away from the forest edge inwards. For all the spe- cies, wildings had the highest population density followed by saplings and then trees. Teclea nobilis had the highest number of individual per hectare, followed by Newtonia buchananii, while Rytiginia kigezien- sis and Spathodea nilotica had the lowest number of individuals per hectare. Keywords: Communities; Kalinzu Forest Reserve; Line Transect; Nested Quadrants; Population; Tree Species Introduction Kalinzu Forest reserve occupies parts of the counties of Bunyaruguru, Ruhinda and Igara in Bushenyi district, south- western Uganda, with a population density 328 persons km−2. It was gazetted for a reserve in 1932 with an area of 461 km2, but some of the land was given off for tea estates development in 1954. The reserve now covers an area of 137 km2 (Howard, 1991). It lies on the eastern side of the Great Western Rift Val- ley at the edge of the escarpment overlooking Lake Edward. Kalinzu Forest Reserve is located between latitude 0˚17'N and 0˚30'N and between 30˚00'E and 30˚07'E and at an altitude ranging from 1200 to 1500 m above sea level. Kalinzu forest is one of the Afromontane forests of high biodiversity value in the Albertine rift. It is a home to twelve endemic species. These include nine butterfly species, one mammalian species and two tree species. Local communities depend on Kalinzu Forest Reserve for plant resources. This resource utilization has an impact on the population of tree species in the forest. This study set out to assess the variation of wildings, saplings and trees of ten se- lected species with distance from the forest edge, and to esti- mate the population of each species, in order to provide data, that will be used as a basis to study future changes in popula- tion dynamics of the species. The ten species selected for the study were: Newtonia buchananii, Cynometra alexandrei, Te- clea nobilis, Prunus africana, Entandrophragma exelsum, Sapium ellipticum, Diospyros abyssinica, Zanthoxylum gilletii, Rytiginia kigeziensis and Spathodea nilotica. Their selection was based on the results of a study (Aine-Omucunguzi et al., 2010) about utilization of plant resources by the local people around Kalinzu Forest Reserve. Results of the study indicate that the above species are destructively and frequently har- vested by fringe communities. The current study estimated the population of these species and analyzed it in terms of their harvesting demands, with a view of providing information that can be used as a basis to study future population dynamics of the species. Methods Nested quadrants along line transects were used to estimate the population of the species. Five line transects of 3.5 km each, with an interval of 1000 m were constructed using a tape meas- ure. Each transect begun 30 m from the forest edge to eliminate edge effects. The plants were categorized into three classes as trees (>5 cm diameter at breast height), saplings (2 cm root collar diameter - 5 cm diameter at breast height) and wildings (<2 cm root collar diameter) (Alder & Synnot, 1992; Nakibuka, 1994; Eilu, 1995). Eight alternate nested plots of 20 m × 20 m with an interval of 500 m were constructed on each of the tran- sects and the number of trees of each of the species was 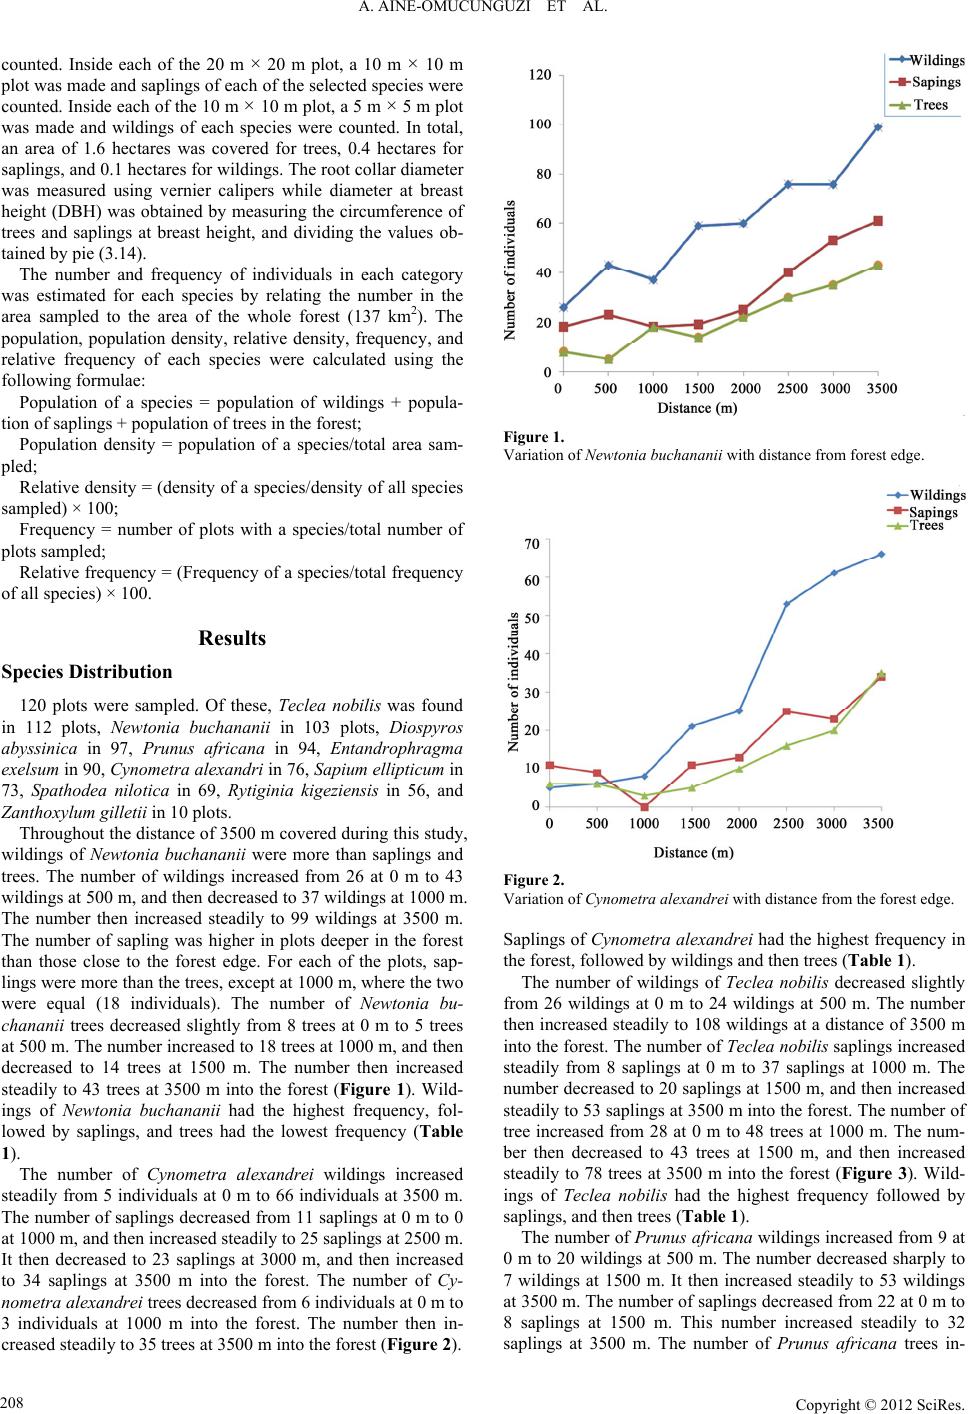 A. AINE-OMUCUNGUZI ET AL. counted. Inside each of the 20 m × 20 m plot, a 10 m × 10 m plot was made and saplings of each of the selected species were counted. Inside each of the 10 m × 10 m plot, a 5 m × 5 m plot was made and wildings of each species were counted. In total, an area of 1.6 hectares was covered for trees, 0.4 hectares for saplings, and 0.1 hectares for wildings. The root collar diameter was measured using vernier calipers while diameter at breast height (DBH) was obtained by measuring the circumference of trees and saplings at breast height, and dividing the values ob- tained by pie (3.14). The number and frequency of individuals in each category was estimated for each species by relating the number in the area sampled to the area of the whole forest (137 km2). The population, population density, relative density, frequency, and relative frequency of each species were calculated using the following formulae: Population of a species = population of wildings + popula- tion of saplings + population of trees in the forest; Population density = population of a speciestotal area sam- pled; Relative density = (density of a speciesdensity of all species sampled) × 100; Frequency = number of plots with a species/total number of plots sampled; Relative frequency = (Frequency of a species/total frequency of all species) × 100. Results Species Distribution 120 plots were sampled. Of these, Teclea nobilis was found in 112 plots, Newtonia buchananii in 103 plots, Diospyros abyssinica in 97, Prunus africana in 94, Entandrophragma exelsum in 90, Cynometra alexandri in 76, Sapium ellipticum in 73, Spathodea nilotica in 69, Rytiginia kigeziensis in 56, and Zanthoxylum gilletii in 10 plots. Throughout the distance of 3500 m covered during this study, wildings of Newtonia buchananii were more than saplings and trees. The number of wildings increased from 26 at 0 m to 43 wildings at 500 m, and then decreased to 37 wildings at 1000 m. The number then increased steadily to 99 wildings at 3500 m. The number of sapling was higher in plots deeper in the forest than those close to the forest edge. For each of the plots, sap- lings were more than the trees, except at 1000 m, where the two were equal (18 individuals). The number of Newtonia bu- chananii trees decreased slightly from 8 trees at 0 m to 5 trees at 500 m. The number increased to 18 trees at 1000 m, and then decreased to 14 trees at 1500 m. The number then increased steadily to 43 trees at 3500 m into the forest (Figure 1). Wild- ings of Newtonia buchananii had the highest frequency, fol- lowed by saplings, and trees had the lowest frequency (Table 1). The number of Cynometra alexandrei wildings increased steadily from 5 individuals at 0 m to 66 individuals at 3500 m. The number of saplings decreased from 11 saplings at 0 m to 0 at 1000 m, and then increased steadily to 25 saplings at 2500 m. It then decreased to 23 saplings at 3000 m, and then increased to 34 saplings at 3500 m into the forest. The number of Cy- nometra alexandrei trees decreased from 6 individuals at 0 m to 3 individuals at 1000 m into the forest. The number then in- creased steadily to 35 trees at 3500 m into the forest (Figure 2). Figure 1. Variation of Newtonia buchananii with distance from forest edge. Figure 2. Variation of Cynometra alexandrei with distance from the forest edge. Saplings of Cynometra alexandrei had the highest frequency in the forest, followed by wildings and then trees (Table 1). The number of wildings of Teclea nobilis decreased slightly from 26 wildings at 0 m to 24 wildings at 500 m. The number then increased steadily to 108 wildings at a distance of 3500 m into the forest. The number of Teclea nobilis saplings increased steadily from 8 saplings at 0 m to 37 saplings at 1000 m. The number decreased to 20 saplings at 1500 m, and then increased steadily to 53 saplings at 3500 m into the forest. The number of tree increased from 28 at 0 m to 48 trees at 1000 m. The num- ber then decreased to 43 trees at 1500 m, and then increased steadily to 78 trees at 3500 m into the forest (Figure 3). Wild- ings of Teclea nobilis had the highest frequency followed by saplings, and then trees (Table 1). The number of Prunus africana wildings increased from 9 at 0 m to 20 wildings at 500 m. The number decreased sharply to 7 wildings at 1500 m. It then increased steadily to 53 wildings at 3500 m. The number of saplings decreased from 22 at 0 m to 8 saplings at 1500 m. This number increased steadily to 32 saplings at 3500 m. The number of Prunus africana trees in- Copyright © 2012 SciRes. 208 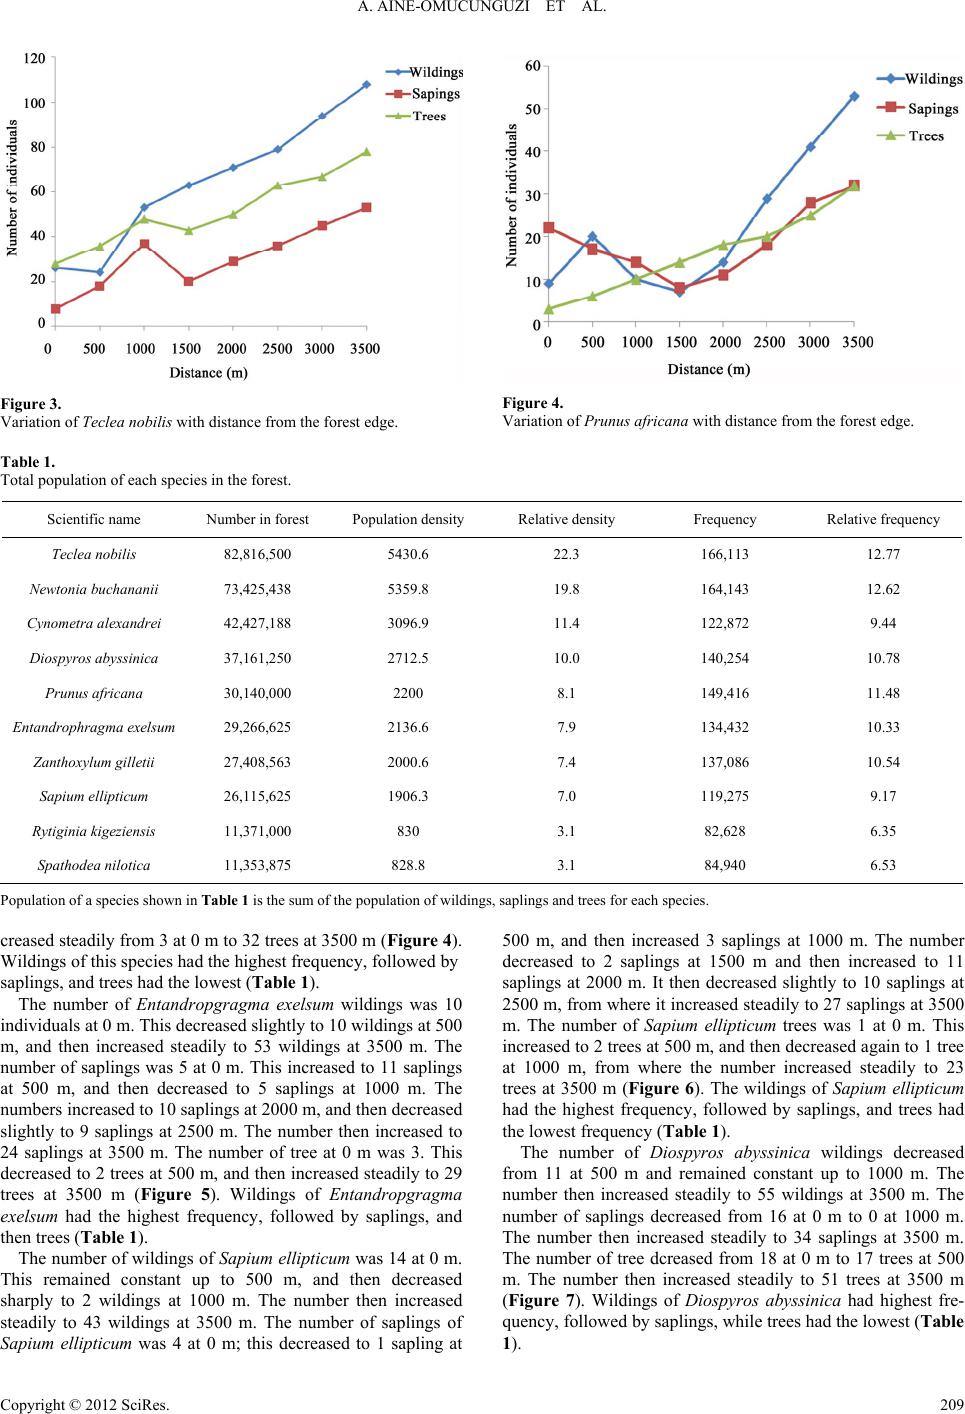 A. AINE-OMUCUNGUZI ET AL. Copyright © 2012 SciRes. 209 Figure 4. Variation of Prunus africana with distance from the forest edge. Figure 3. Variation of Teclea nobilis with distance from the forest edge. Table 1. Total population of each species in the forest. Scientific name Number in forest Population density Relative density Frequency Relative frequency Teclea nobilis 82,816,500 5430.6 22.3 166,113 12.77 Newtonia buchananii 73,425,438 5359.8 19.8 164,143 12.62 Cynometra alexandrei 42,427,188 3096.9 11.4 122,872 9.44 Diospyros abyssinica 37,161,250 2712.5 10.0 140,254 10.78 Prunus africana 30,140,000 2200 8.1 149,416 11.48 Entandrophragma exelsum 29,266,625 2136.6 7.9 134,432 10.33 Zanthoxylum gilletii 27,408,563 2000.6 7.4 137,086 10.54 Sapium ellipticum 26,115,625 1906.3 7.0 119,275 9.17 Rytiginia kigeziensis 11,371,000 830 3.1 82,628 6.35 Spathodea nil otic a 11,353,875 828.8 3.1 84,940 6.53 Population of a species shown in Table 1 is the sum of the population of wildings, saplings and trees for each species. creased steadily from 3 at 0 m to 32 trees at 3500 m (Figure 4). Wildings of this species had the highest frequency, followed by saplings, and trees had the lowest (Table 1). The number of Entandropgragma exelsum wildings was 10 individuals at 0 m. This decreased slightly to 10 wildings at 500 m, and then increased steadily to 53 wildings at 3500 m. The number of saplings was 5 at 0 m. This increased to 11 saplings at 500 m, and then decreased to 5 saplings at 1000 m. The numbers increased to 10 saplings at 2000 m, and then decreased slightly to 9 saplings at 2500 m. The number then increased to 24 saplings at 3500 m. The number of tree at 0 m was 3. This decreased to 2 trees at 500 m, and then increased steadily to 29 trees at 3500 m (Figure 5). Wildings of Entandropgragma exelsum had the highest frequency, followed by saplings, and then trees (Table 1). The number of wildings of Sapium ellipticum was 14 at 0 m. This remained constant up to 500 m, and then decreased sharply to 2 wildings at 1000 m. The number then increased steadily to 43 wildings at 3500 m. The number of saplings of Sapium ellipticum was 4 at 0 m; this decreased to 1 sapling at 500 m, and then increased 3 saplings at 1000 m. The number decreased to 2 saplings at 1500 m and then increased to 11 saplings at 2000 m. It then decreased slightly to 10 saplings at 2500 m, from where it increased steadily to 27 saplings at 3500 m. The number of Sapium ellipticum trees was 1 at 0 m. This increased to 2 trees at 500 m, and then decreased again to 1 tree at 1000 m, from where the number increased steadily to 23 trees at 3500 m (Figure 6). The wildings of Sapium ellipticum had the highest frequency, followed by saplings, and trees had the lowest frequency (Table 1). The number of Diospyros abyssinica wildings decreased from 11 at 500 m and remained constant up to 1000 m. The number then increased steadily to 55 wildings at 3500 m. The number of saplings decreased from 16 at 0 m to 0 at 1000 m. The number then increased steadily to 34 saplings at 3500 m. The number of tree dcreased from 18 at 0 m to 17 trees at 500 m. The number then increased steadily to 51 trees at 3500 m (Figure 7). Wildings of Diospyros abyssinica had highest fre- quency, followed by saplings, while trees had the lowest (Table 1).  A. AINE-OMUCUNGUZI ET AL. Figure 5. Variation of Entandrophragma exelsum with distance from the forest edge. Figure 6. Variation of Sapium ellipticum with distance from the forest edge. Figure 7. Variation of Diospyros abyssinica with distance from the forest edge. The number of wildings of Zanthoxyllum gilletii was 4 at 0 m; and increased to 7 wildings at 500 m. This decreased to 6 wildings at 1000 m and remained constant up to 1500 m. The number then increased steadily to 49 wildings at 3500 m. The number saplings was 9 at 0 m. This remained constant up to 500 m; and increased to 15 saplings at 1000 m. This decreased to 6 saplings at 1500 m, and then increased steadily to 27 saplings at 3500 m. The number of trees of Zanthoxyllum gilletii was 14 at 0 m; this decreased to 6 trees at 500 m; and then increased steadily to 57 trees at 3500 m (Figure 8). Wildings of Zanthoxyllum gilletii showed the highest frequency, followed by saplings. Trees of this species showed the lowest frequency (Table 1). The number of wildings of Rytiginia kigeziensis increased from 0 at 0 m to 4 wildings at 500 m; this decreased to 2 wild- ings at 1000 m. The number then increased steadily to 23 wild- ings at 3500 m. The number of saplings increased from 1 to 5 at 1500 m; and remained constant up to 2500 m, and then in- creased to 13 saplings at 3500 m. The number of Rytiginia kigeziensis trees increased from 2 at 0 m to 3 trees at 500 m. The number decreased to 1 tree at 1000 m, and then increased to 6 trees at 2000 m, from where it dcreased to 5 trees at 2500 m, and then increased to 7 trees at 3500 m (Figure 9). The frequency of wildings of Rytiginia kigeziensis was the highest, followed by saplings. Trees had the lowest frequency in this category (Table 1). The number of wildings of Spathodea nilotica was 0 from 0 m to 1500 m into the forest. The number then increased steady until it was 29 at 3500 m into the forest. The number of sap- lings decreased from 1 at 0 m to 0 at 500 m; this remained con- stant up to 1000 m. The number increasedd to 10 saplings at 2000 m and remained constant up to 2500 m, from where it increased to 13 saplings at 3500 m. The number of Spathodea nilotica trees was 8 at 0 m and remained constant up to 500 m. It then decreased to 3 trees at 1000 m; the number then in- creased steadily to 21 trees at 2500 m. It then decreased slightly to 20 trees at 3000 m, and again increased to 28 trees at 3500 m Figure 8. Variation of Zanthoxyllum gilletii with distance from the forest edge. Figure 9. Variation of Rytigini a kigezi ens is with distance from the forest edge. Copyright © 2012 SciRes. 210  A. AINE-OMUCUNGUZI ET AL. (Figure 10). Wildings of Spathodea nilotica had the highest frequency, followed by saplings, while trees had the lowest (Table 1). Estimation of Population of Each Species For all the species, wildings had the highest population den- sity, followed by saplings, while trees had the lowest popula- tion density. Teclea nobilis had the highest population density of 5430.6 individuals per hectare. Newtonia buchananii fol- lowed with a population density of 5359.8 individuals per hec- tare. Cynometra alexandrei had a population density of 3096.9 individuals per hectare. Diospyros abyssinica had a density of 2712.5 individuals per hectare, Prunus africana followed with a density of 2200 individuals per hectare. Entandrophragma exelsum had 2136.6 individuals per hectare, Zanthoxylum gil- letii had a density of 2000.6 individuals per hectare, Sapium ellipticum followed with a density of 1906.3 individuals per hectare, Rytiginia kigeziensis had a density of 830 individuals per hectare and Spathodea nilotica had the lowest population density of 828.8 individuals per hectare (Figure 11). The over- all frequency of the species followed a trend similar to that of population density. Figure 10. Variation of Spathodea nilotica with distance from the forest edge. Population density for each category was obtained by dividing the number of individuals in the category by the total area sampled. Figure 11. Comparison of population density of wildings, saplings and trees per species. Discussion The number of plants in each plant category generally in- creased away from the forest edge inwards. There are two pos- sible explanations to this trend. First, it could be due to edge effects where micro-climatic conditions affect the growth of the tree species under study. Secondly, it could be due to the har- vesting behaviour of people in the forest fringe communities. It is likely, that people tend to avoid walking long distances in the forest and thus first harvest tree resources they come across as soon as they enter the forest. This is probably the reason why plots that were deep in the forest generally had more individu- als than those that were close to the forest edge. The low num- ber of wilding near the forest edge can be attributed to two factors; first, as people move and harvest tree resources, the wildings are either cut to pave way or stepped on and eventu- ally die. Second, some trees are harvested before they bear seeds and this reduces the number of wildings. Some plots deep in the forest however had fewer individuals than those close to the edge. This is because, at times harvesters are interested in plants of a particular size or level of maturity, and in such cases, they tend to ignore those that are close to the forest edge and go to harvest deep in the forest. This was particularly common with species of medicinal value. This mode of harvest for in- stance explains why Diospyros abyssinica had 16 saplings at a distance of 0 m and no saplings at 1000 m into the forest (Fig- ure 7). The variation of saplings of Prunus africana with dis- tance (Figure 4) can also be attributed to the mode of harvest used by the local people, where the removal of bark affects the reproductive performance of trees. For species like Rytiginia kigeziensis, Spathodea nilotica, Prunus africana, and Zanthoxylum gilletii whose bark is of medicinal value, the trend may be attributed to the fact that bark used for medicinal purposes is mainly harvested from mature trees and in this case, harvesters have to particularly look for such trees, in which case they may be forced to move deep into the forest, if the trees are not near the forest edge. This, for example, explains why Zanthoxylum gilletii had 14 trees at 0 m and 6 trees 500 m into the forest (Figure 8). Some of the plants, especially wildings are destroyed during the harvesting process. This may for instance explain why Sapium ellipticum had 14 wildings at a distance of 0 m and 02 wildings at 1000 m (Fig- ure 6). Resource harvesters normally cut the understorey to create paths. It’s mainly the wildings and saplings that are af- fected. Other plants are destroyed when trees are cut down. It is important to note however, that this plant distribution cannot entirely be attributed to human disturbance. There are many other factors that influence plant distribution. They in- clude; the nature of the soil, forest canopy cover, altitude, and mode of dispersal among others. These factors vary with in the forest, and therefore shape the distribution of plants in different parts of forest. If a species is shade tolerant, majority of its individuals will be found under thick canopy cover, whereas most individuals of a light tolerant species will be found where there are gaps. This agrees with findings of (Fayle et al., 2009). Likewise, a species that is dispersed by self explosion will have most of its individuals confined to one area of the forest, while a species that is dispersed by animals may have its individuals widely spread in the forest. (Bleher et al., 2002) emphasize that the mode of dispersal of a species influences its distribution in a forest. Soil conditions influence the rate of germination. More individuals germinate where the soil conditions are favourable Copyright © 2012 SciRes. 211  A. AINE-OMUCUNGUZI ET AL. Copyright © 2012 SciRes. 212 (Nazre et al., 2009). It is important to note that tree populations with low densities and clumped distributions are at risk in the face of increased human dependence on forest products. Frequency is a good measure of species distribution. Species with high frequencies are frequently encountered in the forest, and are widely distributed, while those with very low frequen- cies are either confined to particular parts of the forest, or are scarce. This kind of distribution is usually due to high rate of harvest, nature of soil, mode of dispersal, or altitude. The high frequency of Teclea nobilis (Table 1) for instance, suggests that it is widely distributed in the forest, while the low frequency of Spathodea nilotica is an indication that it is not common in the forest. Comparing the frequency of wildings, saplings and trees of a given species gives an insight into the stage of the plant that is affected most by harvesting. The low frequency of trees in this study suggests that they are the most affected by har- vesting, and the high frequency of wildings suggests that they are the least affected by harvesting, while the saplings are in- termediate. The high frequency of wildings for most of the species suggests that they are widely distributed in the forest and that their numbers are still high due to low levels of harvest. The low frequency of Cynometra alexandrei wildings com- pared to other species is an indication that the population of this species is on the decline. This could probably be attributed to the high demand of this species for fuel wood. Most of the trees of this species are harvested before fruiting and this has greatly reduced its seed bank. Conclusion and Recommendations For all the species studied, the low number of trees implies that there are fewer individuals contributing to the forest seed bank. If the rate of tree harvest is not regulated, the seed bank may in the long run be depleted. However, the high number of wildings and saplings suggests that the population of most of these species is generally stable. It’s worth noting however, that human disturbance may in some cases increase resilience of some species. Effective conservation of these tree species re- quires strategies that specify the age and size of plants from which to harvest, and the frequency of harvest. Since wildings are normally destroyed during the harvesting process, it’s im- portant to also specify parts of the forest in which harvesting is allowed. These parts will then need effective monitoring. All this will only be possible, if the local people are involved in the decision making process and management of the forest. Changes in population can be used to show the intensity of harvesting of a species; however it was quite hard in this par- ticular study, because no previous data was available to com- pare populations of particular species in order to determine the population decline or increase over time. It is therefore hoped that the results of this study will provide a basis for studying changes in the population of these ten species. Never the less, the low population of Zanthoxylum gilletii, Rytiginia kigezien- sis and Spathodea nilotica, can be attributed to the destructive methods used to harvest their bark, which in most cases result into death of the affected plants. Species with low numbers are mainly those with medicinal value and they have been massively and destructively harvested for a long time. This has tremendously affected their distribu- tion in the forest. They are now left very deep in the forest. There is a need to sensitize the resource harvesters about re- sponsible harvesting of plant resources. This will minimize the destruction of the understorey during the harvesting process. There is need to incorporate the resource users in the manage- ment process of Kalinzu Forest Reserve if their negative im- pacts on the forest are to be minimized. Their incorporation requires a clear understanding of the socio-economic attributes that shape their forest resource demands. Acknowledgements This work was funded by the Toyota Foundation of Japan through the Kalinzu Forest Project. We are grateful to Professor Takeshi Furuichi and Associate Professor Chie Hashimoto of the Kalinzu Forest Project for the financial and technical help they gave to us. We are also indebted to the local people around Kalinzu Forest Reserve for all the assistance extended to us during the study. REFERENCES Aine-Omucunguzi, A., Rugunda, G. K., & Byarugaba, D. (2010). Utili- zation of forest plant resources by the local people around Kalinzu forest reserve, south-western Uganda. African Journal of Ecology, 48, 819-821. Alder, D., & Synnot, T. J. (1992). Permanent sample plot techniques for mixed tropical forest. Teopical Forestry Paper No. 25, Oxford: Oxford Forestry Institute. Bleher, B., Oberrath, R., & Bohning-Gaese, K. (2002). Seed dispersal, breeding systems, tree density and the spatial pattern of trees—A simulation approach. Basic and Applied E cology, 3, 115-123. doi:10.1078/1439-1791-00088 Eilu, G. (1995). The natural regeneration of canopy tree species fol- lowing human disturbance in Bwindi impenetrable forest, Uganda. Master’s thesis, Kampala: Makerere University. Fayle, T. M., Chung, A. Y. C., Dumbrell, A. J., Eggleton, P., & Foster W. A. (2009). The effects of rain forest canopy architecture on the distribution of epiphytic ferns (Asplenium spp.) in Sabah Malaysia. Biotropica, 41, 676-681. doi:10.1111/j.1744-7429.2009.00523.x Howard, P. (1991). Nature conservation in Uganda’s tropical forest reserves. Gland and Cambridge: International Union for Conserva- tion of Nature. Nakibuka, M. (1994). Some aspects of tropical rain forest regeneration following encroachment in the Mabira forest reserve. Dissertation, Kampala: Makerere University. Nazre, M., Latiff, A., & Mohamad-Roslan, M. K. (2009). Effects of topography and soil on the distribution of under canopy trees of Gar- cinia (Guttiferae) in lowland forest of Peninsular Malaysia. Interna- tional Journal of Botany, 5, 287-294. |