

Paper Menu >>
Journal Menu >>
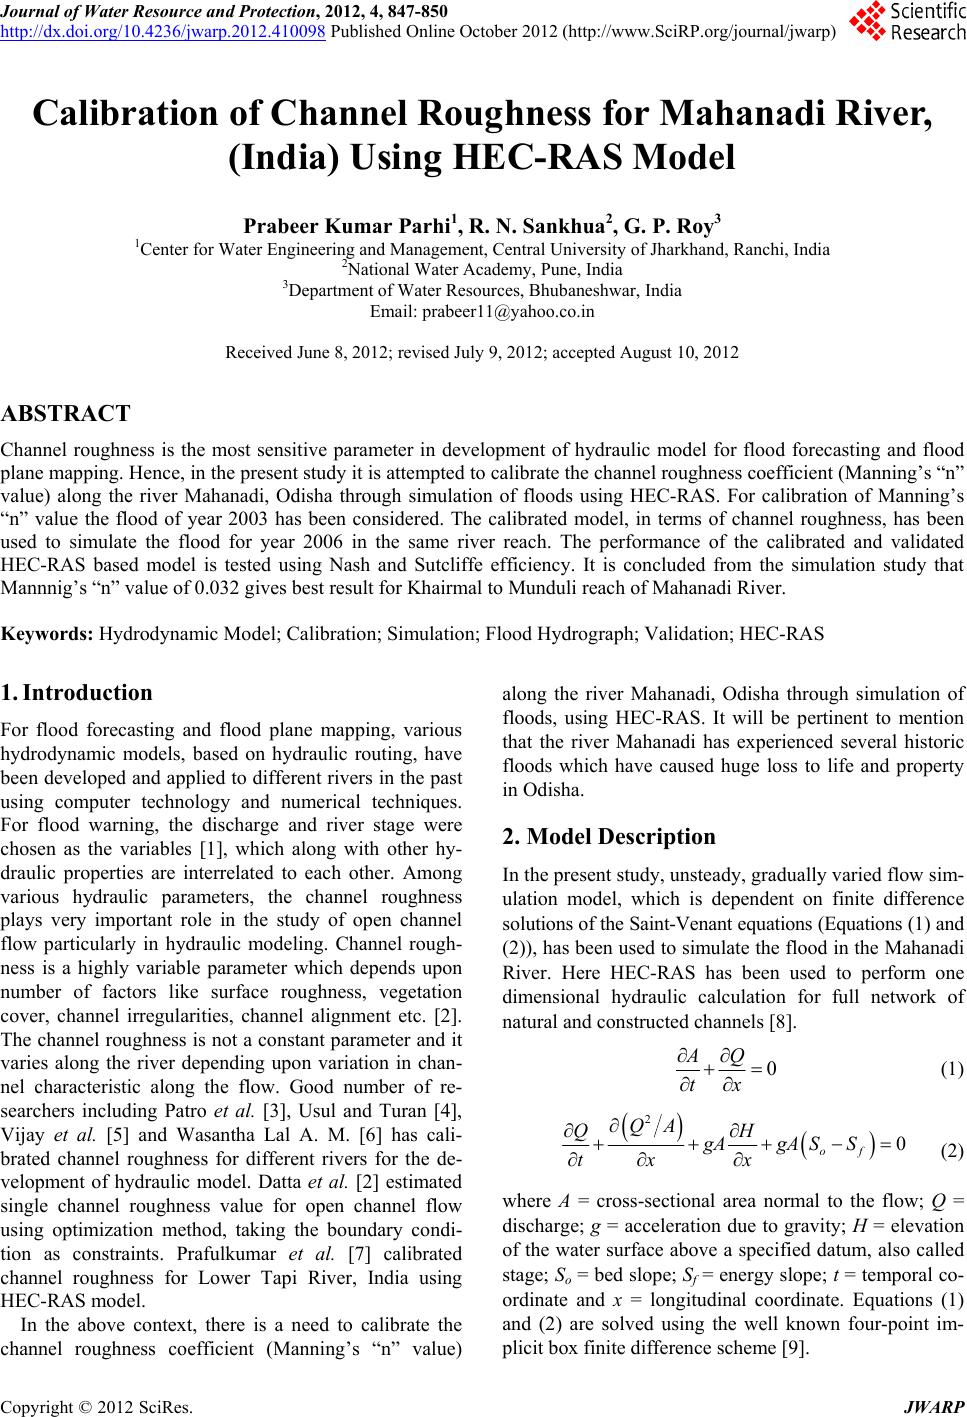 Journal of Water Resource and Protection, 2012, 4, 847-850 http://dx.doi.org/10.4236/jwarp.2012.410098 Published Online October 2012 (http://www.SciRP.org/journal/jwarp) Calibration of Channel Roughness for Mahanadi River, (India) Using HEC-RAS Model Prabeer Kumar Parhi1, R. N. Sankhua2, G. P. Roy3 1Center for Water Engineering and Managemen t, Central University of Jharkhand, Ranchi, India 2National Water Academy, Pune, India 3Department of Water Resources, Bhubaneshwar, India Email: [email protected] Received June 8, 2012; revised July 9, 2012; accepted August 10, 2012 ABSTRACT Channel roughness is the most sensitive parameter in development of hydraulic model for flood forecasting and flood plane mapping. Henc e, in the present study it is attempted to calibr ate the channe l roughness co ef ficient ( Manning’ s “n” value) along the river Mahanadi, Odisha through simulation of floods using HEC-RAS. For calibration of Manning’s “n” value the flood of year 2003 has been considered. The calibrated model, in terms of channel roughness, has been used to simulate the flood for year 2006 in the same river reach. The performance of the calibrated and validated HEC-RAS based model is tested using Nash and Sutcliffe efficiency. It is concluded from the simulation study that Mannnig’s “n” value of 0.032 gives best result for Khairmal to Munduli reach of Mahanadi River. Keywords: Hydrodynamic Model; Calibration; Simulation; Flood Hydrograph ; Validation; HEC-RAS 1. Introduction For flood forecasting and flood plane mapping, various hydrodynamic models, based on hydraulic routing, have been developed and applied to different rivers in the past using computer technology and numerical techniques. For flood warning, the discharge and river stage were chosen as the variables [1], which along with other hy- draulic properties are interrelated to each other. Among various hydraulic parameters, the channel roughness plays very important role in the study of open channel flow particularly in hydraulic modeling. Channel rough- ness is a highly variable parameter which depends upon number of factors like surface roughness, vegetation cover, channel irregularities, channel alignment etc. [2]. The channel roughness is not a cons tant parameter and it varies along the river depending upon variation in chan- nel characteristic along the flow. Good number of re- searchers including Patro et al. [3], Usul and Turan [4], Vijay et al. [5] and Wasantha Lal A. M. [6] has cali- brated channel roughness for different rivers for the de- velopment of hydraulic model. Datta et al. [2] estimated single channel roughness value for open channel flow using optimization method, taking the boundary condi- tion as constraints. Prafulkumar et al. [7] calibrated channel roughness for Lower Tapi River, India using HEC-RAS model. In the above context, there is a need to calibrate the channel roughness coefficient (Manning’s “n” value) along the river Mahanadi, Odisha through simulation of floods, using HEC-RAS. It will be pertinent to mention that the river Mahanadi has experienced several historic floods which have caused huge loss to life and property in Odisha. 2. Model Description In the present study, unsteady, gradually varied flow sim- ulation model, which is dependent on finite difference so lution s of th e Sain t-Venan t equations (Equations (1) and (2)), has been used to simulate the flood in the Mahanadi River. Here HEC-RAS has been used to perform one dimensional hydraulic calculation for full network of natural and constructed channels [8]. 0 AQ tx (1) 2 0 of QA QH gAgA SS tx x (2) where A = cross-sectional area normal to the flow; Q = discharge; g = acceleration due to gravity; H = elevation of the water surface above a specified datum, also called stage; So = bed slope; Sf = energy slope; t = temporal co- ordinate and x = longitudinal coordinate. Equations (1) and (2) are solved using the well known four-point im- plicit box finite difference scheme [9]. C opyright © 2012 SciRes. JWARP 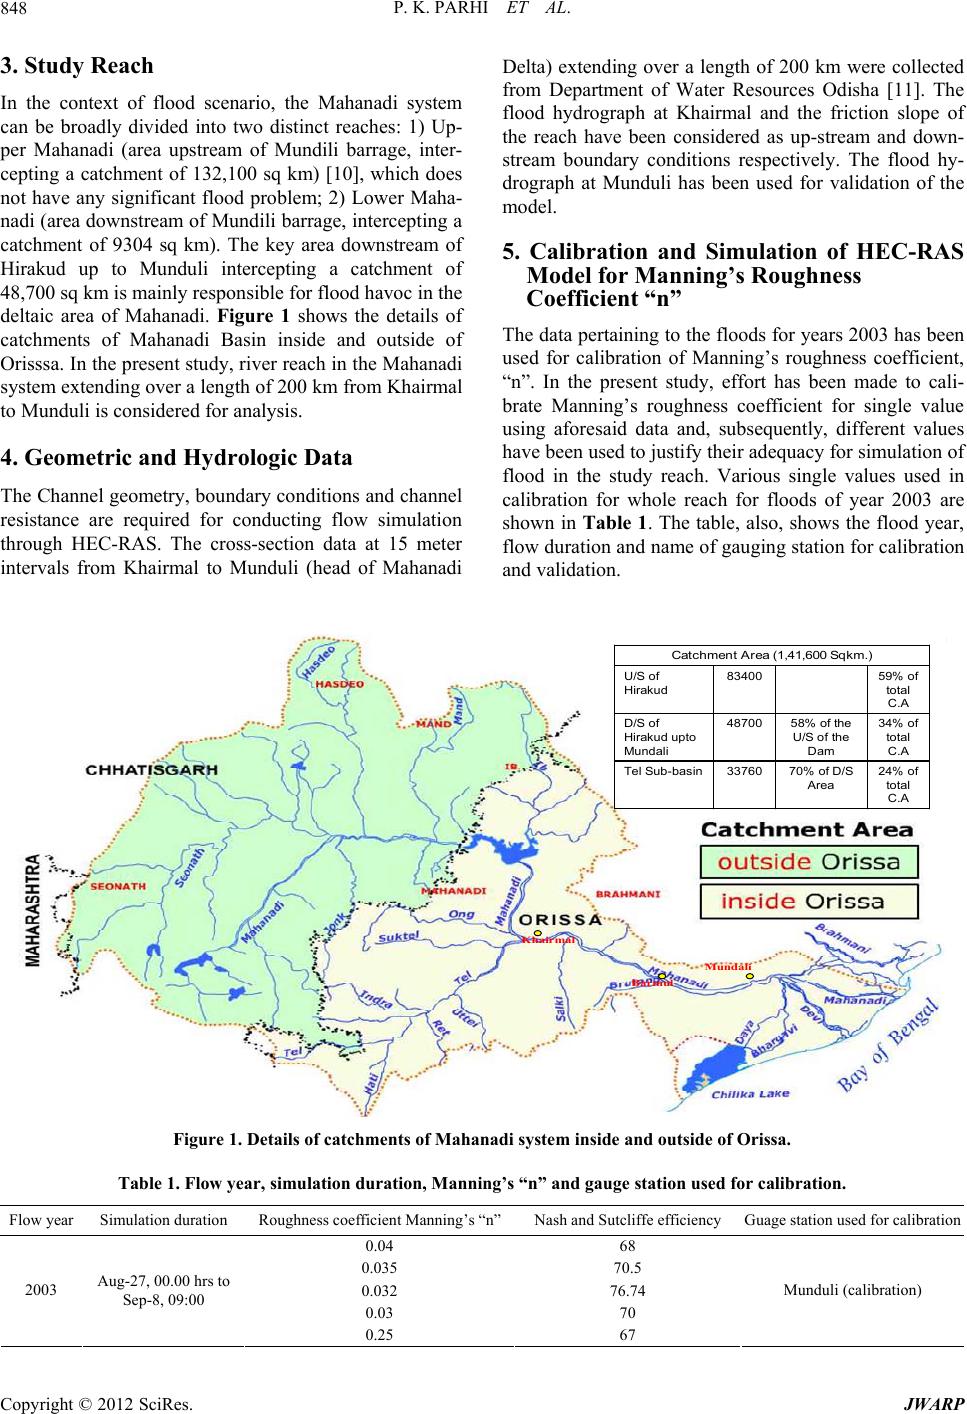 P. K. PARHI ET AL. 848 3. Study Reach In the context of flood scenario, the Mahanadi system can be broadly divided into two distinct reaches: 1) Up- per Mahanadi (area upstream of Mundili barrage, inter- cepting a catchment of 132,100 sq km) [10], which does not have any significant flood problem; 2) Lower Maha- nadi (area downstream of Mundili barrage, in tercepting a catchment of 9304 sq km). The key area downstream of Hirakud up to Munduli intercepting a catchment of 48,700 sq km is mainly responsible for flood havoc in the deltaic area of Mahanadi. Figure 1 shows the details of catchments of Mahanadi Basin inside and outside of Orisssa. In the present study, river reach in the Mahanadi system extending over a length of 200 km from Khairmal to Munduli is con s idered for analysis. 4. Geometric and Hydrologic Data The Channel geometry, boundary conditions and channel resistance are required for conducting flow simulation through HEC-RAS. The cross-section data at 15 meter intervals from Khairmal to Munduli (head of Mahanadi Delta) extending over a length of 200 km were collected from Department of Water Resources Odisha [11]. The flood hydrograph at Khairmal and the friction slope of the reach have been considered as up-stream and down- stream boundary conditions respectively. The flood hy- drograph at Munduli has been used for validation of the model. 5. Calibration and Simulation of HEC-RAS Model for Manning’s Roughness Coefficient “n” The data pertaining to the floods for years 2003 has been used for calibration of Manning’s roughness coefficient, “n”. In the present study, effort has been made to cali- brate Manning’s roughness coefficient for single value using aforesaid data and, subsequently, different values have been used to ju stify their ad equ acy for si mulation o f flood in the study reach. Various single values used in calibration for whole reach for floods of year 2003 are shown in Table 1. The table, also, shows the flood year, flow duration and name of gauging station for calibration and validation. 24% of total C.A 70% of D/S Area 33760Tel Sub-basin 34% of total C.A 58% of the U/S of th e Dam 48700D/S of Hirakud upto Mundali 59% of total C.A 83400U/S of Hirakud CatchmentArea (1,41,600 Sqkm.) Khairmal Barmul Mundali Figure 1. Details of catchments of Mahanadi system inside and outside of Orissa. Table 1. Flow year, simulation duration, Manning’s “n” and gauge station used for calibration. Flow year Simulation duration Roughness coefficient Manning’s “n”Nash and Sutcliffe efficiency Guage station used for calibration 0.04 68 0.035 70.5 0.032 76.74 0.03 70 2003 Aug-27, 00.00 hrs to Sep-8, 09:00 0.25 67 Munduli (calibration) Copyright © 2012 SciRes. JWARP 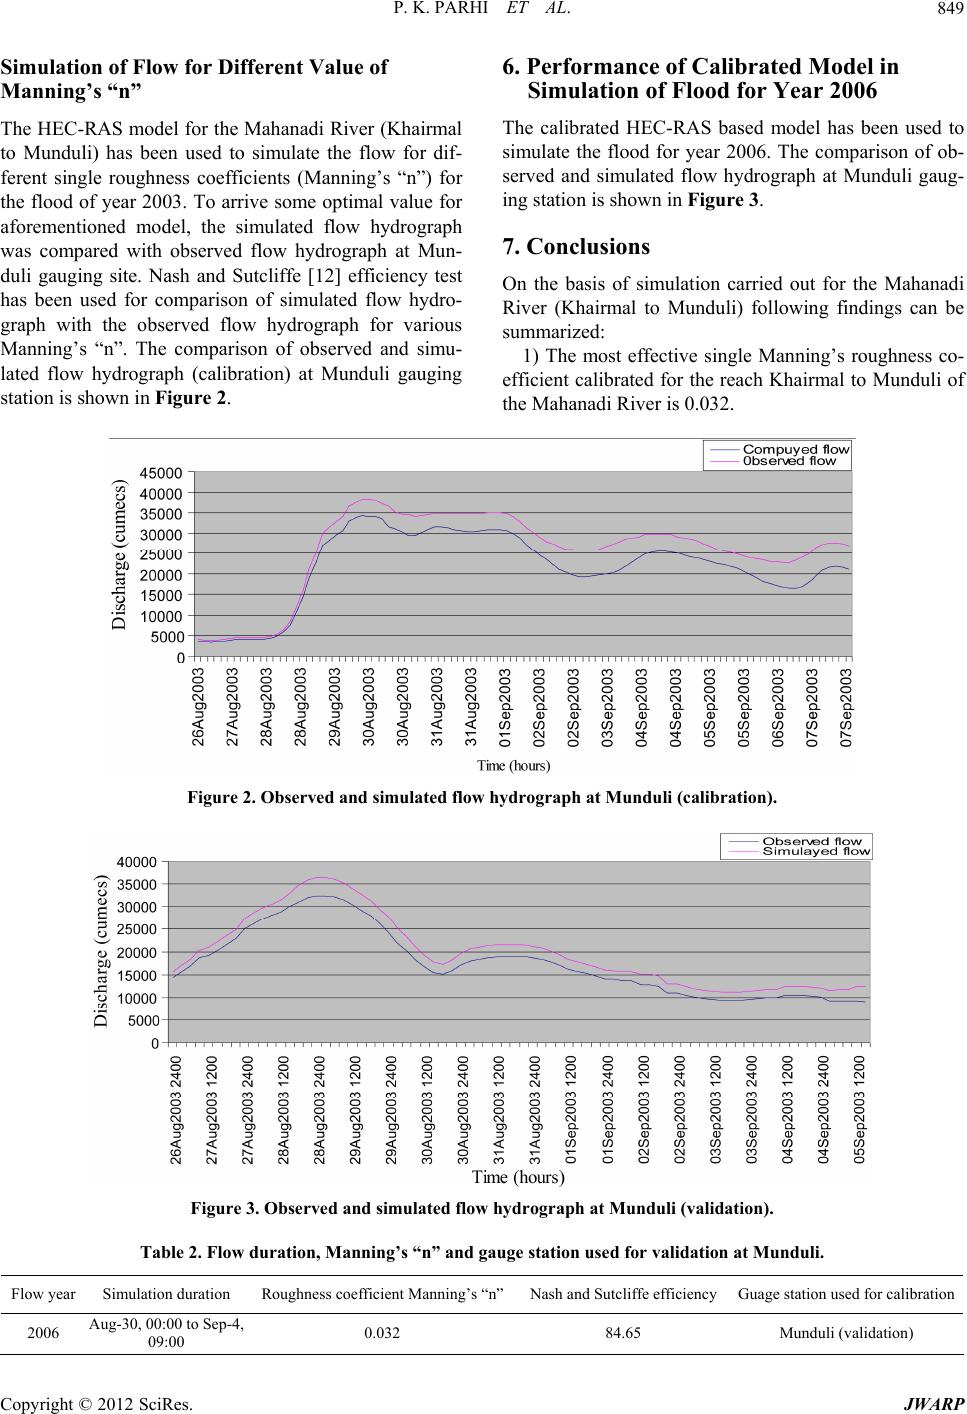 P. K. PARHI ET AL. 849 Simulation of Flow for Different Value of Manning’s “n” The HEC-RAS model for the Mahanadi River (Khairmal to Munduli) has been used to simulate the flow for dif- ferent single roughness coefficients (Manning’s “n”) for the flood of year 2003. To arrive some optimal value for aforementioned model, the simulated flow hydrograph was compared with observed flow hydrograph at Mun- duli gauging site. Nash and Sutcliffe [12] efficiency test has been used for comparison of simulated flow hydro- graph with the observed flow hydrograph for various Manning’s “n”. The comparison of observed and simu- lated flow hydrograph (calibration) at Munduli gauging station is shown in Figure 2. 6. Performance of Calibrated Model in Simulation of Flood for Year 2006 The calibrated HEC-RAS based model has been used to simulate the flood for year 2006. The comparison of ob- served and simulated flow hydrograph at Munduli gaug- ing station is s ho wn in Figure 3. 7. Conclusions On the basis of simulation carried out for the Mahanadi River (Khairmal to Munduli) following findings can be summarized: 1) The most effective single Manning’s roughness co- efficient calibrated for the reach Khairmal to Munduli of the Mahanadi River is 0.032. Figure 2. Observed and simulated flow hydr ograph at Munduli (calibration). Figure 3. Observed and simulated flow hydr ogr aph at M unduli (validation). Table 2. Flow duration, Manning’s “n” and gauge station used for validation at Munduli. Flow year Simulation duration Roughness coefficient Manning’s “n”Nash and Sutcliffe efficiencyGuage station used for calibration 2006 Aug-30, 00:00 to Sep-4, 09:00 0.032 84.65 Munduli (validation) Copyright © 2012 SciRes. JWARP  P. K. PARHI ET AL. 850 2) The performance of calibrated model has been veri- fied for flood of year 2006. Close agreement (84.65% efficiency) have been arrived between simulated and observed flows for Munduli gauging station. 3) For flood forecasting and flood plane mapping us- ing HEC-RAS, Manning’s roughn ess coeff icient of 0.032 may yield best result. 4) Furthermore, the calibrated Manning’s roughness coefficient works best for high flow only, which needs to be verified for lean flows in the f o cus reach . REFERENCES [1] W.-M. Bao, X.-Q. Zhang and S.-M. Qu, “Dynamic Cor- rection of Roughness in the Hydrodynamic Model,” Jour- nal of Hydrodynamics, Vol. 21, No. 2, 2009, pp. 255-263. doi:10.1016/S1001-6058(08)60143-2 [2] R. Ramesh, B. Datta, M. Bhallamudi and A. Narayana, “Optimal Estimation of Roughness in Open-Channel Flows,” Journal of Hydraulic Engineering, Vol. 126, No. 4, 1997, pp. 299-303. doi:10.1061/(ASCE)0733-9429(2000)126:4(299) [3] S. Patro, C. Chatterjee, S. Mohanty, R. Singh and N. S. Raghuwanshi, “Flood Inundation Modeling Using Mike Flood and Remote Sensing Data,” Journal of the Indian Society of Remote Sensing, Vol. 37, No. 1, 2009, pp. 107- 118. doi:10.1007/s12524-009-0002-1 [4] N. Usul and T. Burak, “Flood Forecasting and Analysis within the Ulus Basin, Turkey, Using Geographic Infor- mation Systems,” Natural Hazards, Vol. 39, No. 2, 2006, pp. 213-229. doi:10.1007/s11069-006-0024-8 [5] R. Vijay, A. Sargoankar and A. Gupta, “Hydrodynamic Simulation of River Yamuna for Riverbed Assessment: A Case Study of Delhi Region,” Environmental Monitoring Assessment, Vol. 130, No. 1-3, 2007, pp. 381-387. doi:10.1007/s10661-006-9405-4 [6] A. M. Wasantha Lal, “Calibration of Riverbed Rough- ness,” Journal of Hydraulic Engineering, Vol. 121, No. 9, 1995, pp. 664-671. doi:10.1061/(ASCE)0733-9429(1995)121:9(664) [7] P. V. Timbadiy a, P. L. Patel and P. D. Porey, “Calibra tion of HEC-RAS Model on Prediction of Flood for Lower Tapi River, India,” Journal of Water Resources and Pro- tection, Vol. 3, 2011, pp. 805-811. doi:10.4236/jwarp.2011.311090 [8] US Army Corps of Engineers, “HEC-RAS, User Manual,” Hydrologic Engineering Center, Davis Version 4.0, 2008. [9] US Army Corps of Engineers, “HEC-RAS, Hydraulic Reference Manual,” Hydrologic Engineering Center, Davis Version 4.0, 2008. [10] B. Mishra and S. Behera, 7th International R&D Confer- ence on Development and Management of Water and En- ergy Resources, Bhubaneswar, 4-6 February 2009. [11] Government of Orissa, Department of Water Resources, Mahanadi at a Glance, Vol. 1, 2010. [12] J. E. Nash and J. V. Sutcliffe, “River Flow Forecasting through Conceptual Models, Part I-A Discussion of Prin- ciples,” Journal of Hydrology, Vol. 1 0, 1 970 , pp. 282-290. doi:10.1016/0022-1694(70)90255-6 Copyright © 2012 SciRes. JWARP |