

Paper Menu >>
Journal Menu >>
 Pharmacology & Pharmacy, 2012, 3, 404-408 http://dx.doi.org/10.4236/pp.2012.34054 Published Online October 2012 (http://www.SciRP.org/journal/pp) 1 Relationship of Uric Acid with Superoxide Dismutase (Sod) in Induced Hyperuricemic Rat Model Shiza Batool1, Iftikhar Ahmed2*, Muhammad Sarwar3, Hafeez ul Hassan4 1Biochemistry Department, Aziz Fatima Medical and Dental College, Faisalabad, Pakistan; 2Biochemistry Department, Baqai Medi- cal University, Karachi, Pakistan; 3Chemical Pathology Department, Al Jouf University, Al-Jawf, KSA; 4Physiology Department, Baqai Medical Unive rsity, Karachi, Pa ki st an. Email: *[email protected], *[email protected] Received July 16th, 2012; revised August 18th, 2012; accepted September 12th, 2012 ABSTRACT Increase uric acid levels have been found in oxidative stress. Urate radicals do not react with oxygen to form another peroxy radical, thus increasing the efficacy of uric acid as an antioxidant. Therefore, this study is designed to measure the level of uric acids and find out the relationship of uric acid with superoxide dismutase in induced hyperuricemic model. Forty male albino rats with an average weight of 180 ± 2 g were selected. The rats were grouped. The animals were fed on standard diet and given tap water ad libitum until treatment. Albino rats were divided into four groups. Group A (10)—con trol giv en only stand ard diet, gr oup B (10) fed on 60% fructose w ith standard diet, group C (10) fed on fructose, standard diet and intraperitonially oxonic acid 250 mg/kg and group D (10) only on injection intraperotoni- ally oxonic acid 250 mg/kg. At the end of study 10 mL of blood was drawn from heart of rats. Then blood was esti- mated for superoxide dismutase and uric acids done by kit methods randox-manual/Rx monza UA230/UA 233. Results: In Group C superoxide dismutase was found to be 32% (244 ± 2.23 mg/dL) more than control. In the same group the uric acid concentration was highly significantly correlated with control. Conclusion: The uric acid concentration in- creases when we take fructose up to 60% in our diet. It also increases superoxide dismutase concentration. More than this value may have inverse effect on the uric acid level and its role as an antioxidant may become inversed. Keywords: Uric Acid; Superoxide Dismutase; Albino Rats; Fructose Induced Hyperuricemia 1. Introduction Free radical can be defined as any molecular species ca- pable of independent existence that contains an unpaired electron in an atomic orbital [1]. They are capable of tr ig- gering chain reactions which can damage the different cell constituents. The most important free radicals in many disease states are oxygen derivatives, particularly superoxide and the hydroxyl radical. Superoxide is formed from several molecules by oxidation including adrenaline, flavine nu- cleotides, thiol compounds and glucose. Superoxide is also produce during important biological reactions in- cluding electron transport chain in mitochondria [2]. In order to check free radicals formation to avoid oxi- dative stress, body has different anti-oxidant defense systems. An antioxidant can be defined as: “any sub- stance that when present in low concentrations compared to that of an oxidisable substrate significantly delays or inhibits the oxidatio n of that substrate. The physiolog ical role of antioxidants, as this definition suggests, is to pre- vent damage to cellular components arising as a conse- quence of chemical reactions involving free radicals [3]. Superoxide dismutase is believed to serve as first line of defense against toxicity of superoxide radicals. Also takes part in cell signaling regarding to reactive oxygen species levels [4]. Supero xide is one of the main reactive oxygen species in the cell and as such, SOD serves a key antioxidant role. The physiological importance of SODs is illustrated by the severe pathologies evident in mice genetically engineered to lack these enzymes. Mice lack- ing SOD2 die several days after birth, amid massive oxi- dative stress [5] Mice lacking SOD1 develop a wide range of pathologies, includ ing hepatocellular carcinoma [6] an acceleration of age-related muscle mass loss [7], an ear- lier incidence of cataracts and a reduced lifespan. Mice lacking SOD3 do not show any obvious defects and ex- hibit a normal lifespan, though they are more sensitive to hyperoxic injury [8]. Uric acid now is not considered as merely a metabolic waste. It ha s been proposed that increase in life span ob- served in human evolution to some extent might be due to protective action of uric acid [9]. Increase uric acid *Corresponding a uthor. Copyright © 2012 SciRes. PP 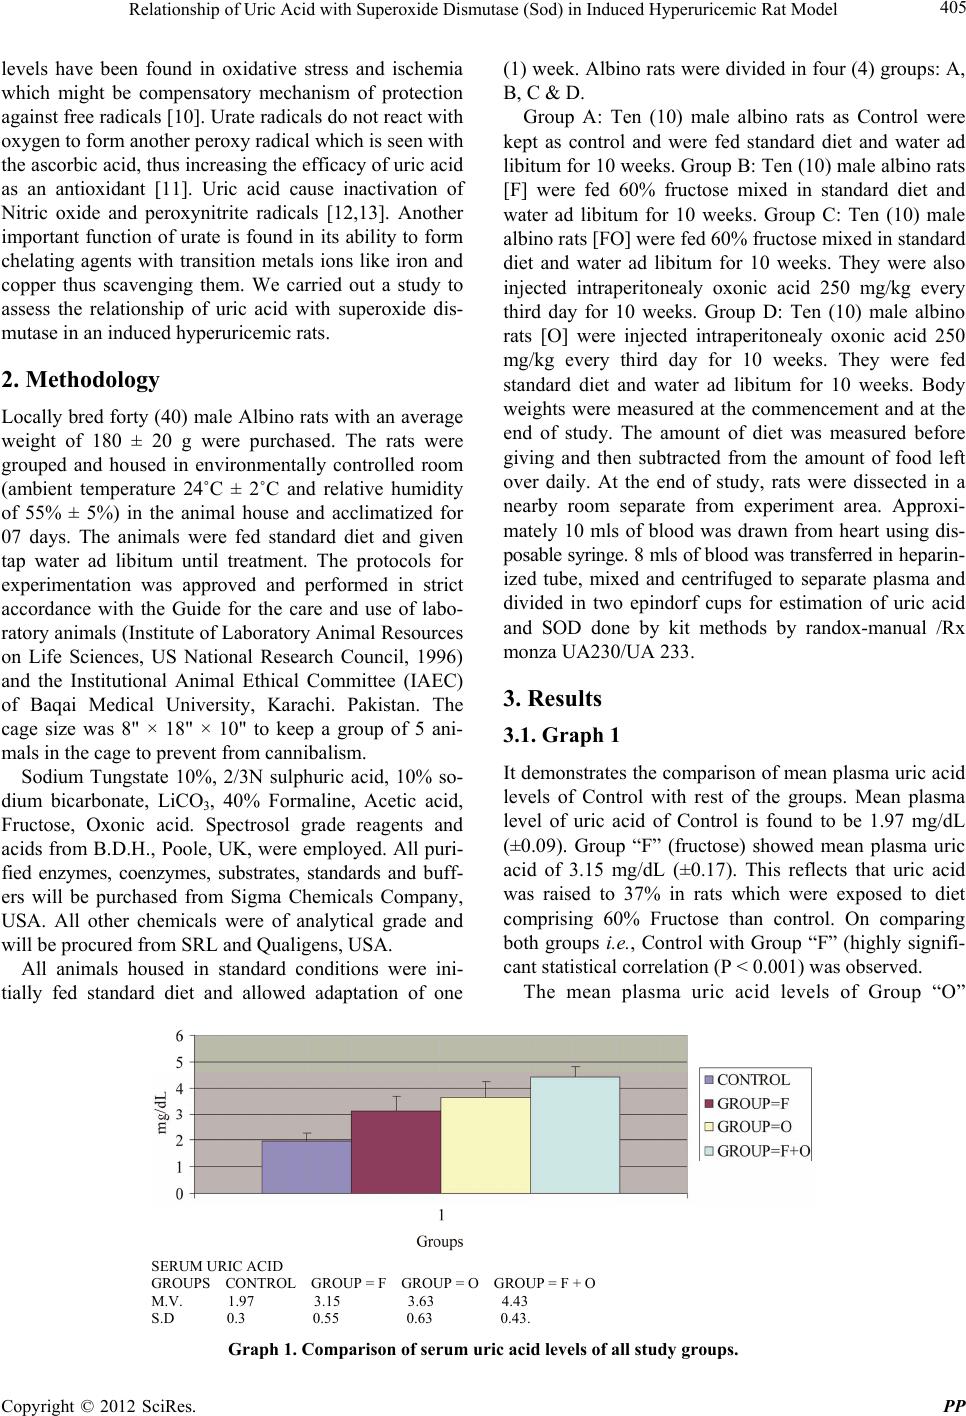 Relationship of Uric Acid with Superoxide Dismutase (Sod) in Induced Hyperuricemic Rat Model 405 levels have been found in oxidative stress and ischemia which might be compensatory mechanism of protection against free radicals [10]. Urate radicals do not react with oxygen to form another peroxy radical which is seen with the ascorbic acid, thus increasing the efficacy of uric acid as an antioxidant [11]. Uric acid cause inactivation of Nitric oxide and peroxynitrite radicals [12,13]. Another important function of urate is found in its ability to form chelating agents with transition metals ions like iron and copper thus scavenging them. We carried out a study to assess the relationship of uric acid with superoxide dis- mutase in an induced hyperuricemic rats. 2. Methodology Locally bred fort y (40) male Albino ra ts with an averag e weight of 180 ± 20 g were purchased. The rats were grouped and housed in environmentally controlled room (ambient temperature 24˚C ± 2˚C and relative humidity of 55% ± 5%) in the animal house and acclimatized for 07 days. The animals were fed standard diet and given tap water ad libitum until treatment. The protocols for experimentation was approved and performed in strict accordance with the Guide for the care and use of labo- ratory animals (Institute of Laboratory Animal Resources on Life Sciences, US National Research Council, 1996) and the Institutional Animal Ethical Committee (IAEC) of Baqai Medical University, Karachi. Pakistan. The cage size was 8" × 18" × 10" to keep a group of 5 ani- mals in the cage to prevent from cannibalism. Sodium Tungstate 10%, 2/3N sulphuric acid, 10% so- dium bicarbonate, LiCO3, 40% Formaline, Acetic acid, Fructose, Oxonic acid. Spectrosol grade reagents and acids from B.D.H., Poole, UK, were employed. All puri- fied enzymes, coenzymes, substrates, standards and buff- ers will be purchased from Sigma Chemicals Company, USA. All other chemicals were of analytical grade and will be procured from SRL and Qualigens, USA. All animals housed in standard conditions were ini- tially fed standard diet and allowed adaptation of one (1) week. Albino rats were divided in four (4) groups: A, B, C & D. Group A: Ten (10) male albino rats as Control were kept as control and were fed standard diet and water ad libitum for 10 weeks. Group B: Ten (10) male albino rats [F] were fed 60% fructose mixed in standard diet and water ad libitum for 10 weeks. Group C: Ten (10) male albino rats [FO] were fed 60% fructose mixed in standard diet and water ad libitum for 10 weeks. They were also injected intraperitonealy oxonic acid 250 mg/kg every third day for 10 weeks. Group D: Ten (10) male albino rats [O] were injected intraperitonealy oxonic acid 250 mg/kg every third day for 10 weeks. They were fed standard diet and water ad libitum for 10 weeks. Body weights were measured at the commencement and at the end of study. The amount of diet was measured before giving and then subtracted from the amount of food left over daily. At the end of study, rats were dissected in a nearby room separate from experiment area. Approxi- mately 10 mls of blood was drawn from heart using dis- posable syringe. 8 mls of blood was transferred in he pa rin - ized tube, mixed and centrifuged to separate plasma and divided in two epindorf cups for estimation of uric acid and SOD done by kit methods by randox-manual /Rx monza UA230/UA 233. 3. Results 3.1. Graph 1 It demonstrates the comparison of mean plasma uric acid levels of Control with rest of the groups. Mean plasma level of uric acid of Control is found to be 1.97 mg/dL (±0.09). Group “F” (fructose) showed mean plasma uric acid of 3.15 mg/dL (±0.17). This reflects that uric acid was raised to 37% in rats which were exposed to diet comprising 60% Fructose than control. On comparing both groups i.e., Control with Group “F” (highly signifi- cant statistical correlation (P < 0.001) was observed. The mean plasma uric acid levels of Group “O” SERUM URIC ACID GROUPS CONTROL GROUP = F GROUP = O GROUP = F + O M.V. 1.97 3.15 3.63 4.43 S.D 0.3 0.55 0.63 0.43. Graph 1. Comparison of serum uric acid levels of all study groups. Copyright © 2012 SciRes. PP  Relationship of Uric Acid with Superoxide Dismutase (Sod) in Induced Hyperuricemic Rat Model 406 (oxonic acid) was 3.63 mg/dL (±0.22) which is 45% higher than Control. The probability calculated was high l y significant (P < 0.0 01 ) w hen both groups were eval uat ed . While comparing Group “F + O” (Fructose + Oxonic acid) with Control, highly sign ificant correlation was ob- served (P < 0.001). It was due to high mean plasma se- rum uric acid level of Group “F + O” which was 4.41 mg/dL (±0.14). The combinatio n of fructose with uricase inhibitor, Oxonic acid raises uric acid to 55% from con- trol and this level is highest of all these groups. 3.2. Graph 2 It shows the comparison of mean plasma SOD levels of Control with rest of the groups. Mean plasma level of SOD of Control was found to be 165.15 mg/dL (±2.65). Group “F” (Fructose) showed mean plasma SOD level of 176.65 mg/dL (±2.60) reflecting SOD levels were raised to 6.5% in rats which were exposed to diet comprising 60% Fructose. On comparing both groups i.e., Control with Group “F” significant statistical correlation (P < 0.01) was observed. The mean plasma SOD levels of Group “O” (oxonic acid) has been measured to 181.2 mg/dL (±3.52) which is again 8% more than Control. Therefore, significant (P < 0.01) correlation was ob- served on comparison of both groups. While comparing Group “F + O” (Fructose + Oxonic acid) with Control, highly significant correlation was observed (P < 0.001). It was due to high mean plasma SOD levels of Group “F + O” which was 244 mg/dL (±2.23) which is high est of all these groups. In this gro up SOD was 32% more than control which might be due to antioxidant action of uric acid . 4. Discussion One of the important features of this study was the method by which hyperuricemia have been induced in animal model. The group B was given fructose, group D was treated with “oxonic acid” and group C was offered both fructose and oxonic acid (G = Fructose + Oxonic acid). The principle hyperuricemic factor in this study was fructose as it is extensively used in beverages and food. Its a rather controversial factor as number of stud- ies both animals and human, are in the favour that fruc- tose can induce hyperuricemia [14] but many studies have opposed this hypothesis [15] and even mixed re- sponse has been shown [16]. Present investigation has tried to verify this theory. Very few studies have used this combined model of fructose plus oxonic acid. In order to make conditions similar to human, uricase in- hibitor oxonic acid was incorporated to ab olish the effect of this enzyme in rats. Also these different regimens were used to establish the extent of hyperuricemia caused by fructose. Superoxide dismutase levels were found to be raised in all three groups in comparison to control. The highest level was obser ved in gro up C of 244 mg/dL as sh own in graph 1. They were 32% more than the control. This was in agreement with H. Ulrich Hink and Nalini Santanam et al. The possible explanation can be drawn from num- ber of studies showing that superoxide dismutase during catalyzing dismutation of 2 to H2O2 can form copper bound hydroxyl radical from hydrogen peroxide H2O2 [17]. Hydroxyl radical when gets bounded to SOD, then it can attack adjacent histidine residue which is attached to copper resulting in inactivation of both SOD1 and SOD3 [18]. This might be prevented when small anions or reductants including Uric acid are co incubated [19] as shown in graph 1 the comparison of mean plasma SOD levels of Control with rest of the groups. Mean plasma level of SOD of Control was found to be 165.15 mg/dL (±2.65). Group B (Fructose) showed mean plasma SOD level of 176.65 mg/dL (±2.60) reflecting SOD levels were raised to 6.5% in rats which were exposed to diet comprising 60% Fructose. On comparing both groups, i.e. Control with Group B significant statistical correlation (P < 0.01) was observed. O SUPEROXIDE DISMUTASE GROUPS CONTROL GROUP = F GROUP = O GROUP = F + O M.V. 165.15 176.65 181.25 244 S.D 8.38 8.23 9.96 6.69 Graph 2. Comparison of serum SOD levels of all study groups. Copyright © 2012 SciRes. PP  Relationship of Uric Acid with Superoxide Dismutase (Sod) in Induced Hyperuricemic Rat Model 407 The mean plasma SOD levels of Group D (oxonic acid) has been measured to 181.2 mg/dL (±3.52) which is again 8% more than Control. Therefore, significant (P < 0.01) correlation was observed on comparison of both groups. While comparing Group C (Fructose + Oxonic acid) with Control, highly significant co rrelation was observed (P < 0.001). It was due to high mean plasma SOD levels of Group “F + O” which was 244 mg/dL (±2.23) which is highest of all these groups. In this group SOD was 32% more than control which might be due to antioxi- dant action of uric acid. It has been suggested that in group C there was signi- ficant increase in the concen tration of uric acid. This was in accordance with some studies done on human that high dietary intake of fructose contributes significantly to hyperuricemia [20]. In a large study in the United States, consumption of four or more sugar-sweetened soft drinks per day gave an odds ratio of 1.82 for hyperuricemia [21]. Increased pr oduction of uric acid is th e result of interfer- ence, by a product of fructose metabolism, in purine me- tabolism. This interference has a dual action, both in- creasing the conversion of ATP to inosine and increasing the synthesis of purine [22] http://en.wikipedia.org/wiki/ Hyperuricemia-cite_note-pmid8213607-14. Fructose also inhibits the excretion of uric acid, apparently by compet- ing with uric acid for access to the transport protein SLC2A9 [23]. The effect of fructose in reducing excre- tion of uric acid is increased in people with a hereditary (genetic) predisposition toward hyperuricemia and/or gout [22] . Starvation causes the body to metabolize its own (purine-rich) tissues for energy. Thus, like a high purine diet, starvation increases the amount of purine converted to uric acid. A very low calorie diet without carbohydrate can induce extreme hyperuricemia; including some car- bohydrate (and redu cing the protein) reduces th e level of hyperuricemia [24]. Starvation also impairs the ability of the kidney to excrete uric acid, due to competition for transport between uric acid and ketones [25]. Many studies are controversial to our results all were done on human some supported that high doses of fructose (200 g/day for 2 weeks) raise the blood pressure and cause the features of metabolic syndrome. Some suggested that lowering of the uric acid level prevents the increase in mean arterial blood pressure. Excessive intake of fruc- tose may have a role in the current epidemics of obesity and diabetes [26]. Some authors also suggested that in- creased dietary fructose was not associated with increase uric acid level [27]. 5. Conclusion The uric acid concentration does increase when we take fructose up to 60% in our diet, e.g., beverages soft drinks. It also increases superoxide dismutase concentration. It has been concluded that more than this value of fructose may have inverse effect on the uric acid level and its role as an antioxidant may become inversed. Therefore, it is suggested from our study that further work need to be done on the effect of fructose on uric acid levels in hu- man. REFERENCES [1] B. Halliwell and J. M. C. Gutteridge, “Role of Free Radi- cals and Catalytic Metal Ions in Human Disease: An O ve r- view,” Methods in Enzymology, Vol. 186, 1990, pp. 1-85. [2] L. B. Becker, T. L. Vanden Hoek, Z. H. Shao, C. Q. Li and P. T. Schumacker, “Generation of Superoxide in Car- diomyocytes during Ischemia before Reperfusion,” Ameri- can Journal of Physiology, Vol. 277, No. 6, 1999, pp. H2240-H2246. [3] I. S. Young and J. V. Woodside, “Antioxidants in Health and Disease,” Journal of Clinical Pathology, Vol. 54, No. 3, 2001, pp. 176-186. [4] A. J. Augustin, “Was It oxidativer Stress?” Klinische Mo- natsblätter für Augenheilkunde, Vol. 227, No. 2, 2010, pp. 90-98. doi:10.1055/s-0029-1245125 [5] Y. Li, T. T. Huang, E. J. Carlson, S. Melov, P. C. Ursell, J. L. Olson, L. J. Noble, M. P. Yoshimura, C. Berger, P. H. Chan, D. C. Wallace and C. J. Epstein, “Dilated Card io- myopathy and Neonatal Lethality in Mutant Mice Lack- ing Manganese Superoxide Dismutase,” Nature Genetics, Vol. 11, No. 4, 1995, pp. 376-377. doi:10.1038/ng1295-376 [6] S. Elchuri, T. D. Oberley, W. Qi, R. S. Eisenstein, L. J. Roberts, H. Van Remmen, C. J. Epstein and T.-T. Huang, “CuZnSOD Deficiency Leads to Persistent and Wide- spread Oxidative Damage and Hepatocarcinogenesis Lat er in Life,” Oncogene, Vol. 24, No. 3, 2005, pp. 367- 380. doi:10.1038/sj.onc.1208207 [7] F. L. Muller, W. Song, Y. Liu, A. Chaudhuri, S. Pieke- Dahl, R. Strong, T.-T. Huang, C. J. Epstein, L. J. Roberts, M. Csete, J. A. Faulkner and H. Van Remmen, “Absence of CuZn Superoxide Dismutase Leads to Elevated Oxida- tive Stress and Acceleration of Age-Dependent Skeletal Muscle Atrophy,” Free Radical Biology & Medicine, Vol. 40, No. 11, 2006, pp. 1993-1004. doi:10.1016/j.freeradbiomed.2006.01.036 [8] M. L. Sentman, M. Granström, H. Jakobson, A. Reaume, S. Basu and S. L. Marklund, “Phenotypes of Mice Lack- ing Extracellular Superoxide Dismutase and Copper- and Zinc-Containing Superoxide Dismutase,” Journal of Bio- logical Chemistry, Vol. 281, No. 11, 2006, pp. 6904-6909. doi:10.1074/jbc.M510764200 [9] B. N. Ames, R. Cathcart, E. Schwiers and P. Hochstein, “Uric Acid Provides an Antioxidant Defense in Humans against Oxidant- and Radical-Caused Aging and Cancer: A Hypothesis,” Proceedings of the National Academy of Sciences of USA, Vol. 78, No. 11, 1981, pp. 6858-6862. doi:10.1073/pnas.78.11.6858 [10] F. J. Nieto, C. Iribarren, M. D. Gross, G. W. Comstock, R. Copyright © 2012 SciRes. PP  Relationship of Uric Acid with Superoxide Dismutase (Sod) in Induced Hyperuricemic Rat Model 408 G. Cutler, “Uric Acid and Serum Antioxidant Capacity: A Reaction to Atherosclerosis,” Atherosclerosis, Vol. 148, No. 1, 2000, pp. 131-139. doi:10.1016/S0021-9150(99)00214-2 [11] W. S. Waring, “Uric Acid: An Important Antioxidant in Acute Ischaemic St roke,” QJM: An International Journal of Medicine, Vol. 95, No. 10, 2002, pp. 691-693. doi:10.1093/qjmed/95.10.691 [12] M. Whiteman, U. Kestsakul and B. Halliwell, “A Reas- sessment of the Peroxynitrite Scavenging Activity of Uric Acid,” Annals of the New York Academy of Sciences, Vol. 962, 2002, pp. 242-259. [13] G. Toncev, B. Milicic, S. Toncev an d G. Samardzic, “High- Dose Methylprednisolone Therapy in Multiple Sclerosis Increases Serum Uric Acid Levels,” Clinical Chemistry and Laboratory Medicine, Vol. 40, No. 5, 2002, pp. 505- 508. doi:10.1515/CCLM.2002.088 [14] R. J. Johnson, S. E. Perez-Pozo, Y. Y. Sautin, J. Manitius, L. G. Sanchez-Lozada, D. I. Feig, M. Shafiu, M. Segal, R. J. Glassock, M. Shimada, C. Roncal and T. Nakagawa, “Hypothesis: Could Excessive Fructose Intake and Uric Acid Cause Type 2 Diabetes,” Endocrine Reviews, Vol. 30, No. 1, 2009, pp. 96-116. doi:10.1210/er.2008-0033 [15] P. A. Crapo and O. G. Kolterman, “The Me tabol ic E ffect s of 2-Week Fructose Feeding in Normal Subjects,” Ameri- can Journal of Clinical Nutrition, Vol. 39, No. 4, 1984, pp. 525-534. [16] S. Z. Sun, B. D Flickinger, P. S. Williamson-Hughes and M. W. Empie, “Lack of Association between Dietary Fruc- tose and Hyperuricemia Risk in Adults,” Nutrition & Metabolism, Vol. 7, No. 1, 2010, pp. 12-16. doi:10.1186/1743-7075-7-16 [17] H. U. Hink, N. Santanam, S. Dikalov, L. McCann, A. D. Nguyen, S. Parthasarathy, D. G. Harrison and T. Fukai, “Peroxidase Properties of Extracellular Superoxide Dis- mutase. Role of Uric Acid in Modulating in Vivo Activ- ity,” Arteriosclerosis, Thrombos is, and Vascular Biology, Vol. 22, No. 9, 2002, pp. 1506-1508. doi:10.1161/01.ATV.0000027524.86752.02 [18] S. L. Jewett, A. M. Rocklin, M. Ghanevati, J. M. Abel and J. A. Marach, “A New Look at a Time-Worn System: Oxidation of CuZn-SOD by H2O2,” Free Radical Biology & Medicine, Vol. 26, No. 7-8, 1999, pp. 905-918. doi:10.1016/S0891-5849(98)00274-3 [19] S. P. A. Goss, R. J. Singh and B. Kalyanaraman, “Bicar- bonate Enhances the Peroxidase Activity of Cu,Zn-Su- peroxide Dismutase. Role of Carbonate Anion Radical,” The Journal of Biological Chemistry, Vol. 274, No. 40, 1999, pp. 28233-28239. doi:10.1074/jbc.274.40.28233 [20] A. Miller and K. Adeli, “Dietary Fructose and the Meta- bolic Syndrome,” Current Opinion in Gastroenterology, Vol. 24, No. 2, 2008, pp. 204-209. [21] J. W. Choi and E. S. Ford, “Sugar Sweete ned Soft Drinks, Diet Soft Drinks, and Serum Uric Acid Level: The Third National Health and Nutrition Examination Survey,” Ar- thritis & Rheumatism, Vol. 59, No. 1, 2008, pp. 109-116. doi:10.1002/art.23245 [22] P. A. Mayes, “Intermediary Metabolism of Fructose,” Ame- rican Journal of Clinical Nutrition, Vol. 58, Suppl. 5, 1993, pp. 754S-765S. [23] V. Vitart and I. Rudan, “SLC2A9 Is a Newly Identified Urate Transporter Influencing Serum Urate Concentration, Urate Excretion and Gout,” Nature Genetics, Vol. 40, No. 4, 2008, pp. 437-442. doi:10.1038/ng.106 [24] A. N. Howard, “Historical Development, Efficacy and Safety of Very Low Calori e Diets,” International Journal of Obesity, Vol. 5, No. 3, 1981, pp. 195-208. [25] W. Kirch and C. Von Gicycki, “Renal Function in Thera- peutic Starvation,” Wiener klinische Wochenschrift, Vol. 92, No. 8, 1980, pp. 263-266. [26] S. E. Perez Pozo, J. Schold and T. Nakagawa, “Excessive Fructose Intake Induces the Features of Metabolic Syn- drome in Healthy Adult Men, Role of Uric Acid in Hy- pertensive Response,” International Journal of Obesity, Vol. 34, No. 3, 2010, pp. 454-461. doi:10.1038/ijo.2009.259 Copyright © 2012 SciRes. PP |