

Paper Menu >>
Journal Menu >>
 Creative Education 2012. Vol.3, Special Issue, 1043-1052 Published Online October 2012 in SciRes (http://www.SciRP.org/journal/ce) http://dx.doi.org/10.4236/ce.2012.326157 Copyright © 2012 SciRes. 1043 Young Graduate Cooperatives in Morocco: Achievements and Problems Aomar Ibourk Research Group of Social Economics, Cadi Ayyad University, Marrakesh, Morocco Email: [email protected] Received September 18th, 2012; revised October 12th, 2012; accepted October 24th, 2012 This paper examines the real ability of the cooperative sector to ensure its central role. Hence, the objec- tive of this research is to discover the several contingencies that weigh on this sector, through examina- tion of national databases and qualitative surveys. Methodologically, this work combines, in a comple- mentary manner, both quantitative and the qualitative approaches. The constructed databases allow en- hancement of the innovative scope of analysis for studying the survival determinants of cooperatives. These questions, largely overlooked in the literature, are studied by means of limited dependent variable models. Keywords: Cooperatives; Young Graduates; Survival Function; Morocco Introduction It is well-known that the simultaneity of primary insertion unemployment and long-run unemployment, among new gra- duates, has an impact on the collective side as well as the indi- vidual side. This kind of situation is, in many regards, an over- whelming experience for unemployed graduates. It raises several questions due to its important impact on both the economy and society. Economically, the question concerns the individual and collective valuation of human capital investments. Persistent difficulties in getting a job produce not only an opportunity cost for the economy but also promote the emergence of negative individual attitudes regarding human capital investment. This leads to a national economy that is competitively weak. Socially, the basic foundations of social equilibrium are considerably dam- aged by increasing the probability of social exclusion, extended unemployment periods compromise dominant redistribution systems based on intra- and intergenerational transfers between family members (Bougroum & Ibourk, 2002a, 2002b, 2003). Long-term unemployment prevents the family from taking its role as insurance against unemployment and old age. To fight against the persistence of graduate unemployment, decision makers must consider employment policy (Ibourk, 2010). The gap between job creation in the public sector and the growth of the graduate labor supply, tends to get wider and wider, and so the initiated employment policy aims to facilitate the graduates’ insertion in the private sector. The Moroccan government, through the Office de Développement et de Coopé- ration (hereafter ODCO), places considerable importance on the promotion of Young Graduate Cooperatives (hereafter YGC), which are supposed to play a tremendous role both economi- cally and socially. Indeed, the cooperative sector is seen as an alternative entry which offers strong advantages for young un- employed graduates, and especially for those who have been affected by endemic unemployment such as, for instance, graduates of a more general curriculum (i.e., Bachelor’s degree in literature, law, economics or sciences). At the end of 2011, 289 YGC were created (ODCO, 2012) absorbing 3252 gradu- ates (an average of 11 members per cooperative) and raising a capital of 44,644,703 MAD (an average of 154,480 MAD per cooperative and 13,737 per adherent). However, despite the government’s efforts, development of such cooperatives is still below expectations because it should be noted that there is un- fortunately a significant proportion of inactive cooperatives. The determinants of such inactivity are related to a juridical, an organizational and material reasons. Additionally, due to the contingencies that weigh heavily on the cooperative actions, their behavioral logics should receive much more attention. Taking these factors into account, this paper examines the real ability of this sector in order to insure its central role. The objective of this research is thus to find out about the several contingencies that weigh on this sector through national data- bases and qualitative surveys. Methodologically, this work combines, in a complementary manner, both quantitative and qualitative approaches. The constructed databases allows to enhance the innovative scope of the analysis by studying the survival determinants of cooperatives. These questions, largely overlooked in the literature, are studied by means of limited dependent variable models. The remainder of this paper is structured as follows. In Sec- tion 1, the features of the Moroccan graduate labor market are discussed. Section 2 is dedicated to the theoretical analysis (cooperative’s identity and entrepreneurial motivations) as well as a description of the cooperative’s organization. Finally, in Section 3, a spatial analysis of the cooperative sector is under- taken in combination with an econometric analysis that aims to identify some elements in order to initiate debate on the valua- tion of this sector. The policy making implications are dis- cussed in the conclusion. Characteristics of the Moroccan Graduate Labor Market The major trends of the graduate labor market can be cap- tured by means of indicators of labor supply and demand as well as the disequilibrium, which characterizes this two compo- 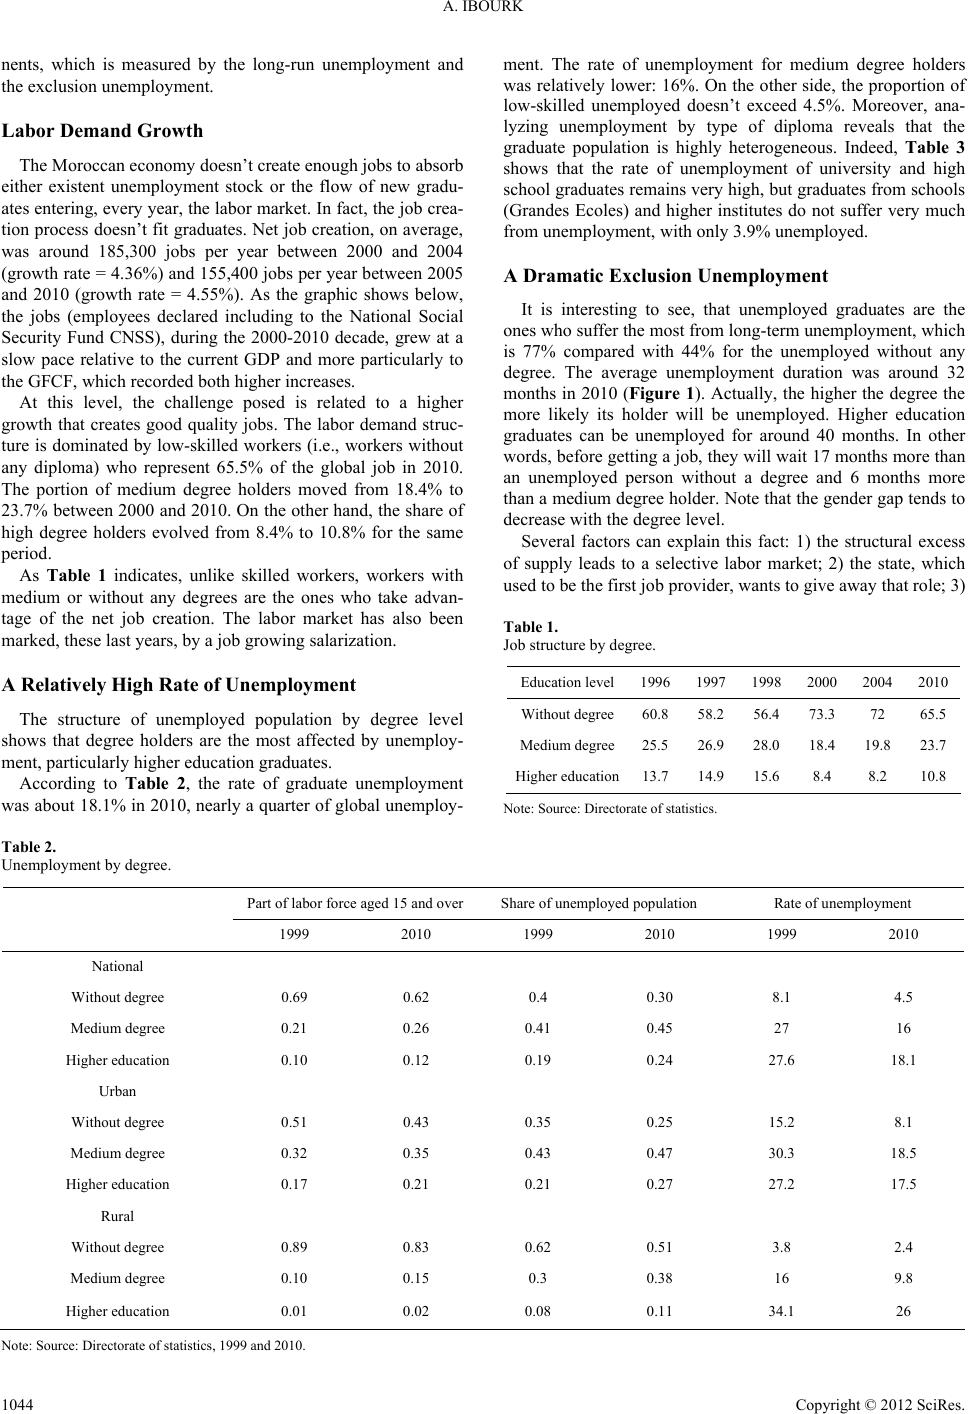 A. IBOURK nents, which is measured by the long-run unemployment and the exclusion unemployment. Labor Demand Growth The Moroccan economy doesn’t create enough jobs to absorb either existent unemployment stock or the flow of new gradu- ates entering, every year, the labor market. In fact, the job crea- tion process doesn’t fit graduates. Net job creation, on average, was around 185,300 jobs per year between 2000 and 2004 (growth rate = 4.36%) and 155,400 jobs per year between 2005 and 2010 (growth rate = 4.55%). As the graphic shows below, the jobs (employees declared including to the National Social Security Fund CNSS), during the 2000-2010 decade, grew at a slow pace relative to the current GDP and more particularly to the GFCF, which recorded both higher increases. At this level, the challenge posed is related to a higher growth that creates good quality jobs. The labor demand struc- ture is dominated by low-skilled workers (i.e., workers without any diploma) who represent 65.5% of the global job in 2010. The portion of medium degree holders moved from 18.4% to 23.7% between 2000 and 2010. On the other hand, the share of high degree holders evolved from 8.4% to 10.8% for the same period. As Table 1 indicates, unlike skilled workers, workers with medium or without any degrees are the ones who take advan- tage of the net job creation. The labor market has also been marked, these last years, by a job growing salarization. A Relatively High Rate of Unempl o yme nt The structure of unemployed population by degree level shows that degree holders are the most affected by unemploy- ment, particularly higher education graduates. According to Table 2, the rate of graduate unemployment was about 18.1% in 2010, nearly a quarter of global unemploy- ment. The rate of unemployment for medium degree holders was relatively lower: 16%. On the other side, the proportion of low-skilled unemployed doesn’t exceed 4.5%. Moreover, ana- lyzing unemployment by type of diploma reveals that the graduate population is highly heterogeneous. Indeed, Table 3 shows that the rate of unemployment of university and high school graduates remains very high, but graduates from schools (Grandes Ecoles) and higher institutes do not suffer very much from unemployment, with only 3.9% unemployed. A Dramatic Exclusion Une mplo ymen t It is interesting to see, that unemployed graduates are the ones who suffer the most from long-term unemployment, which is 77% compared with 44% for the unemployed without any degree. The average unemployment duration was around 32 months in 2010 (Figure 1). Actually, the higher the degree the more likely its holder will be unemployed. Higher education graduates can be unemployed for around 40 months. In other words, before getting a job, they will wait 17 months more than an unemployed person without a degree and 6 months more than a medium degree holder. Note that the gender gap tends to decrease with the degree level. Several factors can explain this fact: 1) the structural excess of supply leads to a selective labor market; 2) the state, which used to be the first job provider, wants to give away that role; 3) Table 1. Job structure by degree. Education level199619971998 2000 20042010 Without degree60.858.256.4 73.3 72 65.5 Medium degree25.526.928.0 18.4 19.823.7 Higher education13.714.915.6 8.4 8.2 10.8 Note: Source: Directorate of statistics. Table 2. Unemployment by degree. Part of labor force aged 15 and overShare of unemployed population Rate of unemployment 1999 2010 1999 2010 1999 2010 National Without degree 0.69 0.62 0.4 0.30 8.1 4.5 Medium degree 0.21 0.26 0.41 0.45 27 16 Higher education 0.10 0.12 0.19 0.24 27.6 18.1 Urban Without degree 0.51 0.43 0.35 0.25 15.2 8.1 Medium degree 0.32 0.35 0.43 0.47 30.3 18.5 Higher education 0.17 0.21 0.21 0.27 27.2 17.5 Rural Without degree 0.89 0.83 0.62 0.51 3.8 2.4 Medium degree 0.10 0.15 0.3 0.38 16 9.8 Higher education 0.01 0.02 0.08 0.11 34.1 26 Note: Source: Directorate of statistics, 1999 and 2010. Copyright © 2012 SciRes. 1044 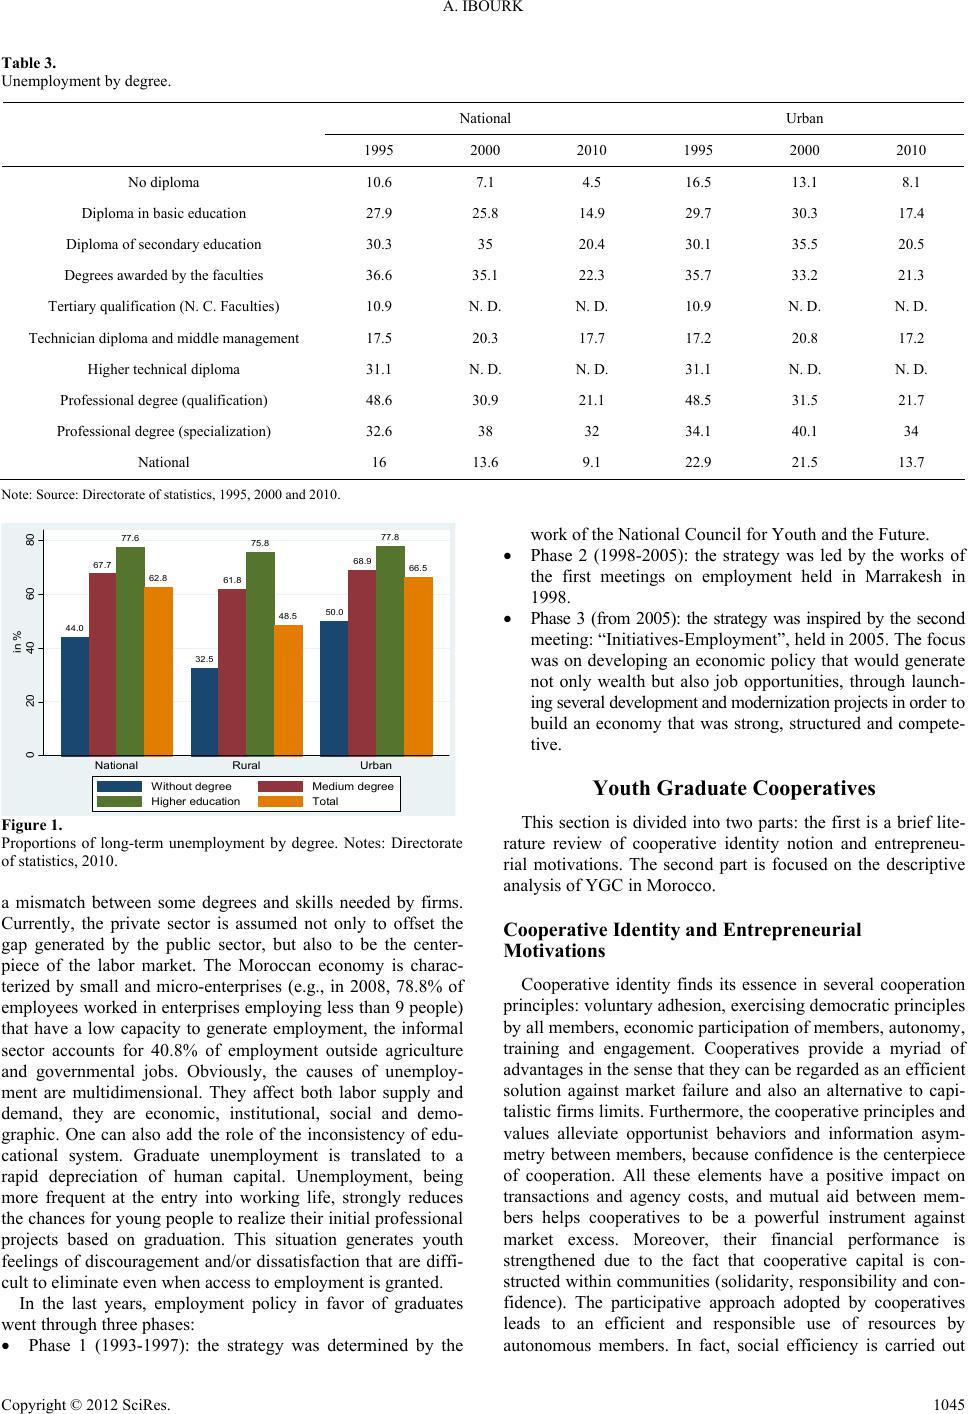 A. IBOURK Table 3. Unemployment by degree. National Urban 1995 2000 2010 1995 2000 2010 No diploma 10.6 7.1 4.5 16.5 13.1 8.1 Diploma in basic education 27.9 25.8 14.9 29.7 30.3 17.4 Diploma of secondary education 30.3 35 20.4 30.1 35.5 20.5 Degrees awarded by the faculties 36.6 35.1 22.3 35.7 33.2 21.3 Tertiary qualification (N. C. Faculties) 10.9 N. D. N. D. 10.9 N. D. N. D. Technician diploma and middle management 17.5 20.3 17.7 17.2 20.8 17.2 Higher technical diploma 31.1 N. D. N. D. 31.1 N. D. N. D. Professional degree (qualification) 48.6 30.9 21.1 48.5 31.5 21.7 Professional degree (specialization) 32.6 38 32 34.1 40.1 34 National 16 13.6 9.1 22.9 21.5 13.7 Note: Source: Directorate of statistics, 1995, 2000 and 2010. 44.0 67.7 77.6 62.8 32.5 61.8 75.8 48.5 50.0 68.9 77.8 66.5 020 40 60 80 in % National RuralUrban Without degree Medium degree Higher education Total Figure 1. Proportions of long-term unemployment by degree. Notes: Directorate of statistics, 2010. a mismatch between some degrees and skills needed by firms. Currently, the private sector is assumed not only to offset the gap generated by the public sector, but also to be the center- piece of the labor market. The Moroccan economy is charac- terized by small and micro-enterprises (e.g., in 2008, 78.8% of employees worked in enterprises employing less than 9 people) that have a low capacity to generate employment, the informal sector accounts for 40.8% of employment outside agriculture and governmental jobs. Obviously, the causes of unemploy- ment are multidimensional. They affect both labor supply and demand, they are economic, institutional, social and demo- graphic. One can also add the role of the inconsistency of edu- cational system. Graduate unemployment is translated to a rapid depreciation of human capital. Unemployment, being more frequent at the entry into working life, strongly reduces the chances for young people to realize their initial professional projects based on graduation. This situation generates youth feelings of discouragement and/or dissatisfaction that are diffi- cult to eliminate even when access to employment is granted. In the last years, employment policy in favor of graduates went through three phases: Phase 1 (1993-1997): the strategy was determined by the work of the National Council for Youth and the Future. Phase 2 (1998-2005): the strategy was led by the works of the first meetings on employment held in Marrakesh in 1998. Phase 3 (from 2005): the strategy was inspired by the second meeting: “Initiatives-Employment”, held in 2005. The focus was on developing an economic policy that would generate not only wealth but also job opportunities, through launch- ing several development and modernization projects in order to build an economy that was strong, structured and compete- tive. Youth Graduate Cooperatives This section is divided into two parts: the first is a brief lite- rature review of cooperative identity notion and entrepreneu- rial motivations. The second part is focused on the descriptive analysis of YGC in Morocco. Cooperative Identity and Entrepreneurial Motivations Cooperative identity finds its essence in several cooperation principles: voluntary adhesion, exercising democratic principles by all members, economic participation of members, autonomy, training and engagement. Cooperatives provide a myriad of advantages in the sense that they can be regarded as an efficient solution against market failure and also an alternative to capi- talistic firms limits. Furthermore, the cooperative principles and values alleviate opportunist behaviors and information asym- metry between members, because confidence is the centerpiece of cooperation. All these elements have a positive impact on transactions and agency costs, and mutual aid between mem- bers helps cooperatives to be a powerful instrument against market excess. Moreover, their financial performance is strengthened due to the fact that cooperative capital is con- structed within communities (solidarity, responsibility and con- fidence). The participative approach adopted by cooperatives leads to an efficient and responsible use of resources by autonomous members. In fact, social efficiency is carried out Copyright © 2012 SciRes. 1045 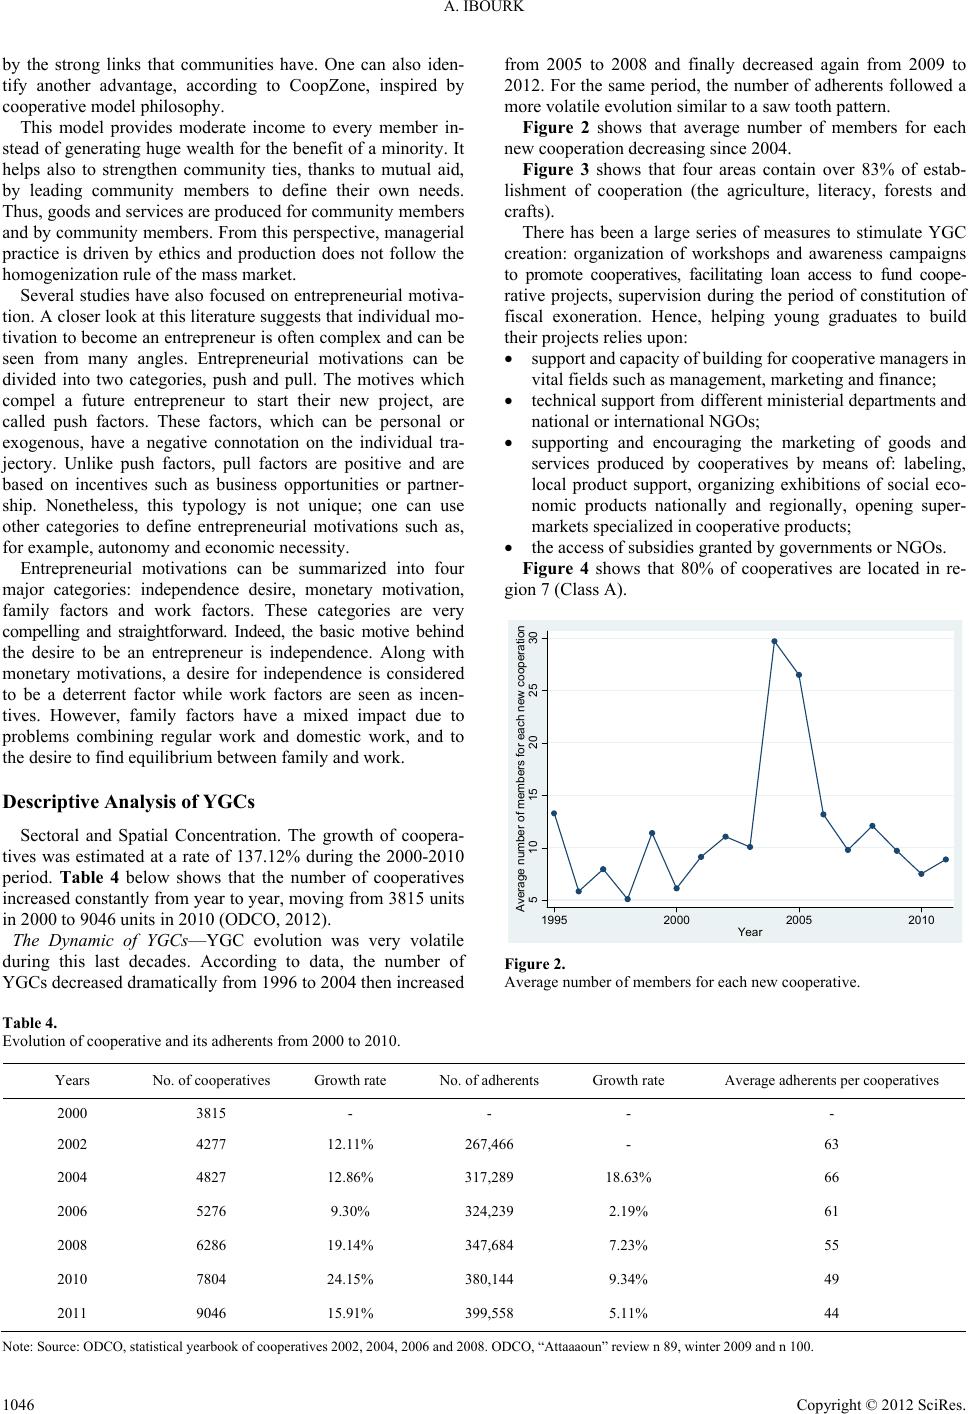 A. IBOURK by the strong links that communities have. One can also iden- tify another advantage, according to CoopZone, inspired by cooperative model philosophy. This model provides moderate income to every member in- stead of generating huge wealth for the benefit of a minority. It helps also to strengthen community ties, thanks to mutual aid, by leading community members to define their own needs. Thus, goods and services are produced for community members and by community members. From this perspective, managerial practice is driven by ethics and production does not follow the homogenization rule of the mass market. Several studies have also focused on entrepreneurial motiva- tion. A closer look at this literature suggests that individual mo- tivation to become an entrepreneur is often complex and can be seen from many angles. Entrepreneurial motivations can be divided into two categories, push and pull. The motives which compel a future entrepreneur to start their new project, are called push factors. These factors, which can be personal or exogenous, have a negative connotation on the individual tra- jectory. Unlike push factors, pull factors are positive and are based on incentives such as business opportunities or partner- ship. Nonetheless, this typology is not unique; one can use other categories to define entrepreneurial motivations such as, for example, autonomy and economic necessity. Entrepreneurial motivations can be summarized into four major categories: independence desire, monetary motivation, family factors and work factors. These categories are very compelling and straightforward. Indeed, the basic motive behind the desire to be an entrepreneur is independence. Along with monetary motivations, a desire for independence is considered to be a deterrent factor while work factors are seen as incen- tives. However, family factors have a mixed impact due to problems combining regular work and domestic work, and to the desire to find equilibrium between family and work. Descriptive Analysis of YG Cs Sectoral and Spatial Concentration. The growth of coopera- tives was estimated at a rate of 137.12% during the 2000-2010 period. Table 4 below shows that the number of cooperatives increased constantly from year to year, moving from 3815 units in 2000 to 9046 units in 2010 (ODCO, 2012). The Dynamic of YGCs—YGC evolution was very volatile during this last decades. According to data, the number of YGCs decreased dramatically from 1996 to 2004 then increased from 2005 to 2008 and finally decreased again from 2009 to 2012. For the same period, the number of adherents followed a more volatile evolution similar to a saw tooth pattern. Figure 2 shows that average number of members for each new cooperation decreasing since 2004. Figure 3 shows that four areas contain over 83% of estab- lishment of cooperation (the agriculture, literacy, forests and crafts). There has been a large series of measures to stimulate YGC creation: organization of workshops and awareness campaigns to promote cooperatives, facilitating loan access to fund coope- rative projects, supervision during the period of constitution of fiscal exoneration. Hence, helping young graduates to build their projects relies upon: support and capacity of building for cooperative managers in vital fields such as management, marketing and finance; technical support from different ministerial departments and national or international NGOs; supporting and encouraging the marketing of goods and services produced by cooperatives by means of: labeling, local product support, organizing exhibitions of social eco- nomic products nationally and regionally, opening super- markets specialized in cooperative products; the access of subsidies granted by governments or NGOs. Figure 4 shows that 80% of cooperatives are located in re- gion 7 (Class A). 510 15 20 25 30 Average number of members for each new cooperation 1995 2000 2005 2010 Yea r Figure 2. Average number of members for each new cooperative. Table 4. Evolution of cooperative and its adherents from 2000 to 2010. Years No. of cooperatives Growth rate No. of adherents Growth rate Average adherents per cooperatives 2000 3815 - - - - 2002 4277 12.11% 267,466 - 63 2004 4827 12.86% 317,289 18.63% 66 2006 5276 9.30% 324,239 2.19% 61 2008 6286 19.14% 347,684 7.23% 55 2010 7804 24.15% 380,144 9.34% 49 2011 9046 15.91% 399,558 5.11% 44 Note: Source: ODCO, statistical yearbook of cooperatives 2002, 2004, 2006 and 2008. ODCO, “Attaaaoun” review n 89, winter 2009 and n 100. Copyright © 2012 SciRes. 1046 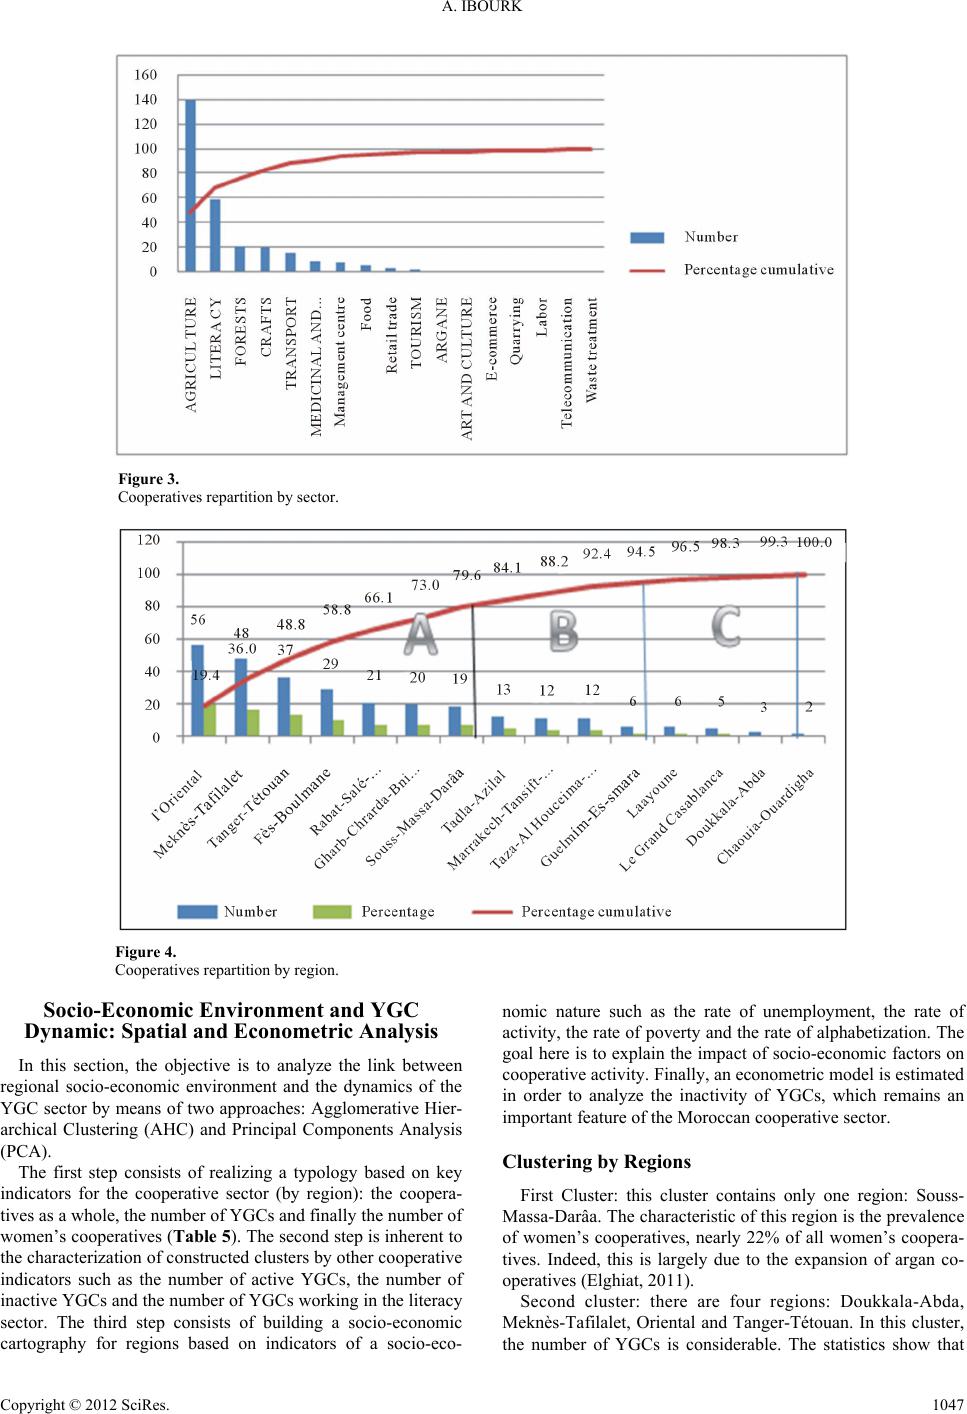 A. IBOURK Figure 3. Cooperatives repartition by sector. Figure 4. Cooperatives repartition by region. Socio-Economic Environment and YGC Dynamic: Spatial and Econometric Analysis In this section, the objective is to analyze the link between regional socio-economic environment and the dynamics of the YGC sector by means of two approaches: Agglomerative Hier- archical Clustering (AHC) and Principal Components Analysis (PCA). The first step consists of realizing a typology based on key indicators for the cooperative sector (by region): the coopera- tives as a whole, the number of YGCs and finally the number of women’s cooperatives (Table 5). The second step is inherent to the characterization of constructed clusters by other cooperative indicators such as the number of active YGCs, the number of inactive YGCs and the number of YGCs working in the literacy sector. The third step consists of building a socio-economic cartography for regions based on indicators of a socio-eco- nomic nature such as the rate of unemployment, the rate of activity, the rate of poverty and the rate of alphabetization. The goal here is to explain the impact of socio-economic factors on cooperative activity. Finally, an econometric model is estimated in order to analyze the inactivity of YGCs, which remains an important feature of the Moroccan cooperative sector. Clustering by Regions First Cluster: this cluster contains only one region: Souss- Massa-Darâa. The characteristic of this region is the prevalence of women’s cooperatives, nearly 22% of all women’s coopera- tives. Indeed, this is largely due to the expansion of argan co- operatives (Elghiat, 2011). Second cluster: there are four regions: Doukkala-Abda, Meknès-Tafilalet, Oriental and Tanger-Tétouan. In this cluster, the number of YGCs is considerable. The statistics show that Copyright © 2012 SciRes. 1047 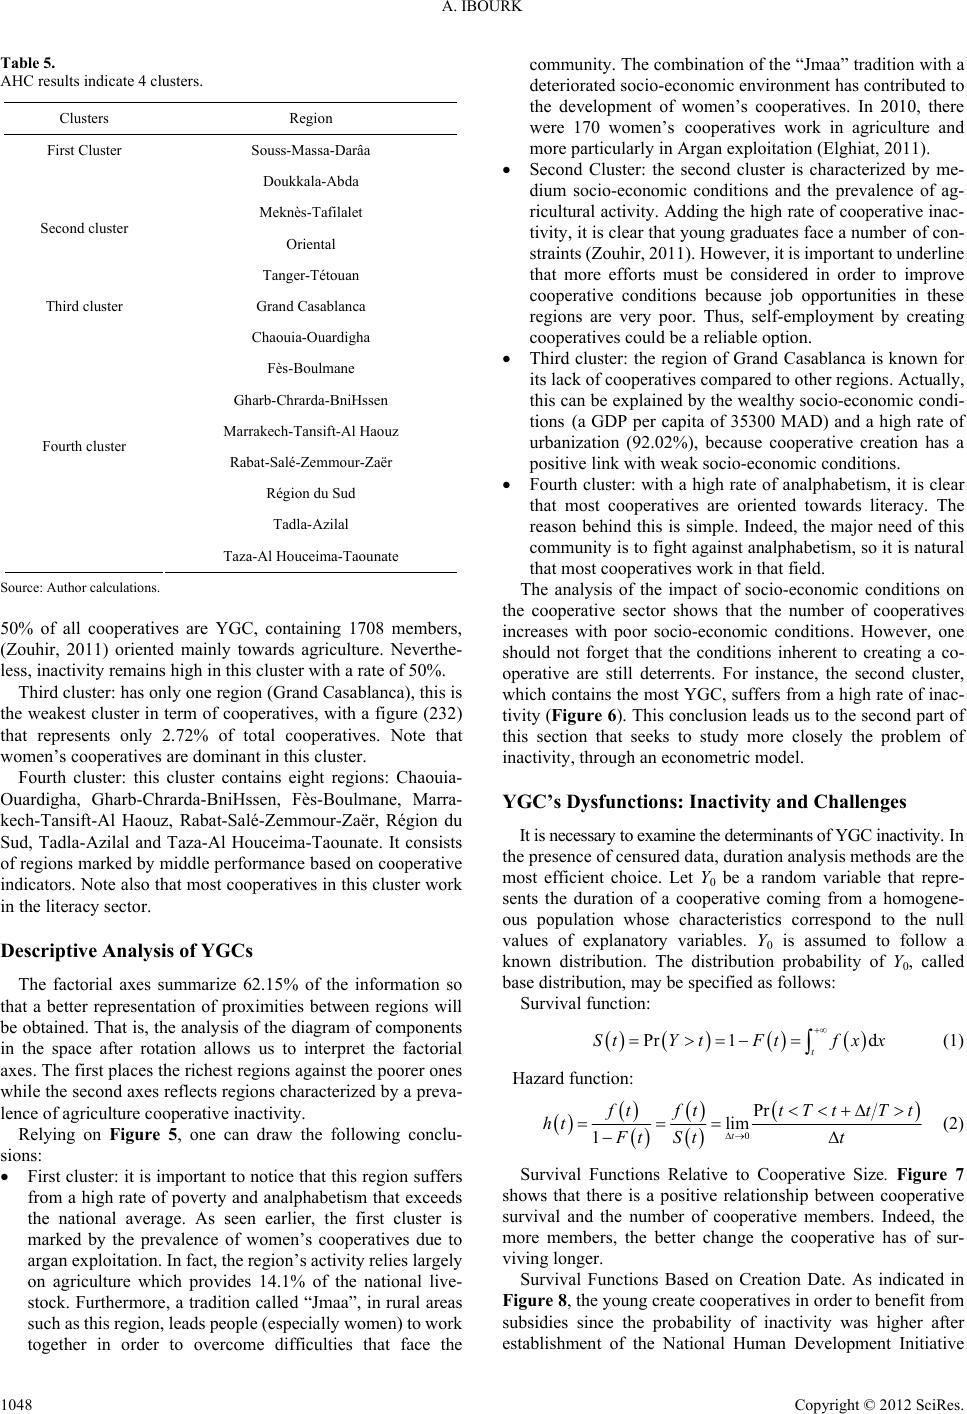 A. IBOURK Table 5. AHC results indicate 4 clusters. Clusters Region First Cluster Souss-Massa-Darâa Doukkala-Abda Meknès-Tafilalet Oriental Second cluster Tanger-Tétouan Third cluster Grand Casablanca Chaouia-Ouardigha Fès-Boulmane Gharb-Chrarda-BniHssen Marrakech-Tansift-Al Haouz Rabat-Salé-Zemmour-Zaër Région du Sud Tadla-Azilal Fourth cluster Taza-Al Houceima-Taounate Source: Author calculations. 50% of all cooperatives are YGC, containing 1708 members, (Zouhir, 2011) oriented mainly towards agriculture. Neverthe- less, inactivity remains high in this cluster with a rate of 50%. Third cluster: has only one region (Grand Casablanca), this is the weakest cluster in term of cooperatives, with a figure (232) that represents only 2.72% of total cooperatives. Note that women’s cooperatives are dominant in this cluster. Fourth cluster: this cluster contains eight regions: Chaouia- Ouardigha, Gharb-Chrarda-BniHssen, Fès-Boulmane, Marra- kech-Tansift-Al Haouz, Rabat-Salé-Zemmour-Zaër, Région du Sud, Tadla-Azilal and Taza-Al Houceima-Taounate. It consists of regions marked by middle performance based on cooperative indicators. Note also that most cooperatives in this cluster work in the literacy sector. Descriptive Analysis of YG Cs The factorial axes summarize 62.15% of the information so that a better representation of proximities between regions will be obtained. That is, the analysis of the diagram of components in the space after rotation allows us to interpret the factorial axes. The first places the richest regions against the poorer ones while the second axes reflects regions characterized by a preva- lence of agriculture cooperative inactivity. Relying on Figure 5, one can draw the following conclu- sions: First cluster: it is important to notice that this region suffers from a high rate of poverty and analphabetism that exceeds the national average. As seen earlier, the first cluster is marked by the prevalence of women’s cooperatives due to argan exploitation. In fact, the region’s activity relies largely on agriculture which provides 14.1% of the national live- stock. Furthermore, a tradition called “Jmaa”, in rural areas such as this region, leads people (especially women) to work together in order to overcome difficulties that face the community. The combination of the “Jmaa” tradition with a deteriorated socio-economic environment has contributed to the development of women’s cooperatives. In 2010, there were 170 women’s cooperatives work in agriculture and more particularly in Argan exploitation (Elghiat, 2011). Second Cluster: the second cluster is characterized by me- dium socio-economic conditions and the prevalence of ag- ricultural activity. Adding the high rate of cooperative inac- tivity, it is clear that young graduates face a number of con- straints (Zouhir, 2011). However, it is important to underline that more efforts must be considered in order to improve cooperative conditions because job opportunities in these regions are very poor. Thus, self-employment by creating cooperatives could be a reliable option. Third cluster: the region of Grand Casablanca is known for its lack of cooperatives compared to other regions. Actually, this can be explained by the wealthy socio-economic condi- tions (a GDP per capita of 35300 MAD) and a high rate of urbanization (92.02%), because cooperative creation has a positive link with weak socio-economic conditions. Fourth cluster: with a high rate of analphabetism, it is clear that most cooperatives are oriented towards literacy. The reason behind this is simple. Indeed, the major need of this community is to fight against analphabetism, so it is natural that most cooperatives work in that field. The analysis of the impact of socio-economic conditions on the cooperative sector shows that the number of cooperatives increases with poor socio-economic conditions. However, one should not forget that the conditions inherent to creating a co- operative are still deterrents. For instance, the second cluster, which contains the most YGC, suffers from a high rate of inac- tivity (Figure 6). This conclusion leads us to the second part of this section that seeks to study more closely the problem of inactivity, through an econometric model. YGC’s Dysfunctions: Inactivity and Chal lenges It is necessary to examine the determinants of YGC inactivity. In the presence of censured data, duration analysis methods are the most efficient choice. Let Y0 be a random variable that repre- sents the duration of a cooperative coming from a homogene- ous population whose characteristics correspond to the null values of explanatory variables. Y0 is assumed to follow a known distribution. The distribution probability of Y0, called base distribution, may be specified as follows: Survival function: Pr 1d t StYtFtf xx (1) Hazard function: 0 Pr lim 1t f tft tTttT ht Ft Stt t (2) Survival Functions Relative to Cooperative Size. Figure 7 shows that there is a positive relationship between cooperative survival and the number of cooperative members. Indeed, the more members, the better change the cooperative has of sur- viving longer. Survival Functions Based on Creation Date. As indicated in Figure 8, the young create cooperatives in order to benefit from subsidies since the probability of inactivity was higher after establishment of the National Human Development Initiative Copyright © 2012 SciRes. 1048 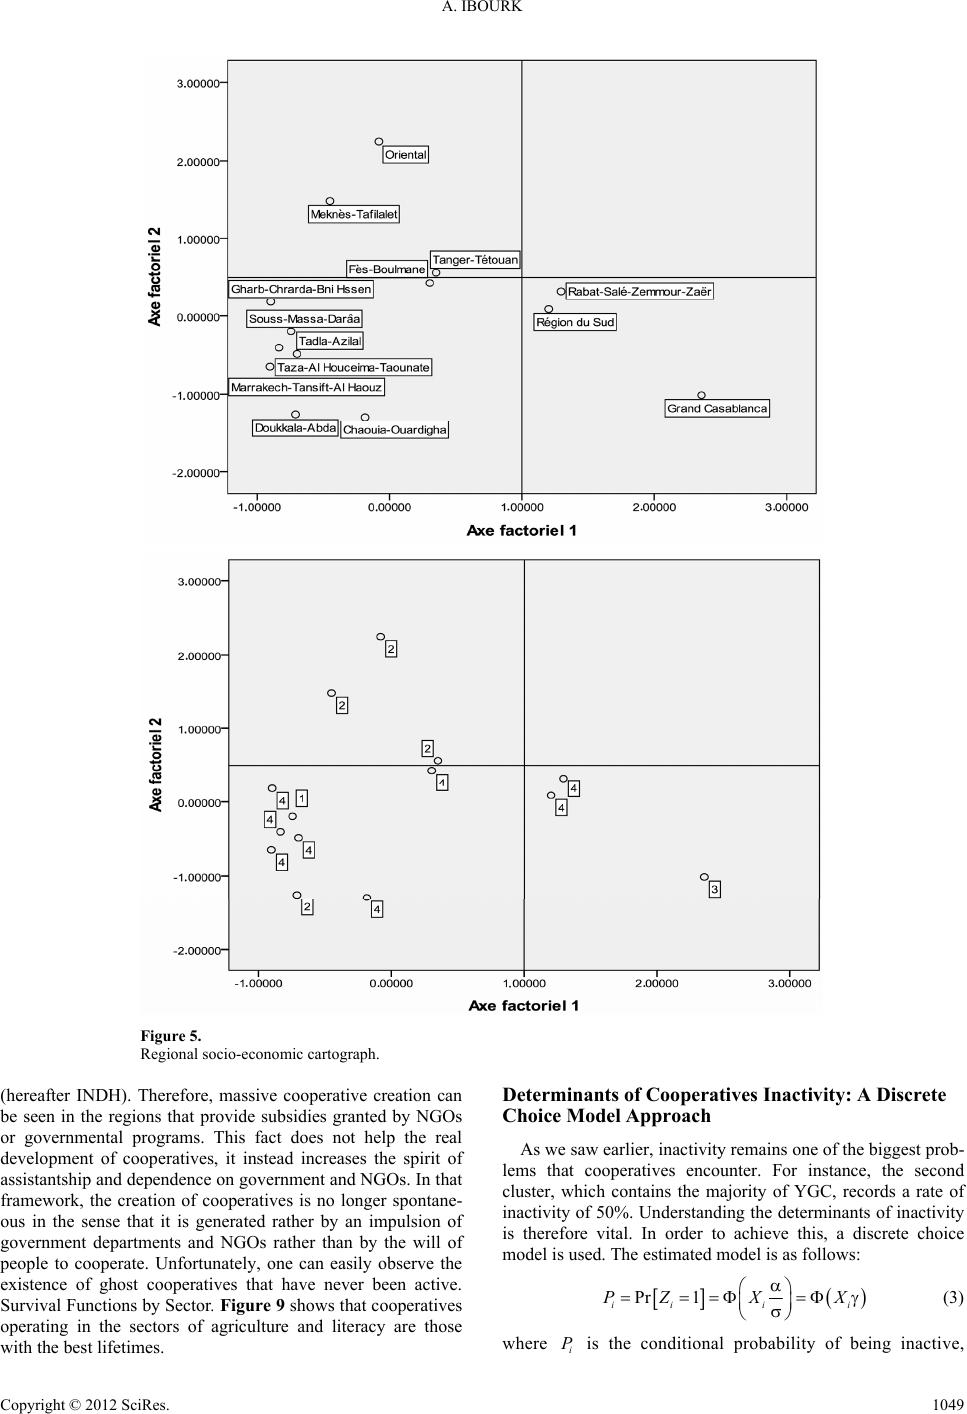 A. IBOURK Copyright © 2012 SciRes. 1049 Figure 5. Regional socio-economic cartograph. Determinants of Cooperatives Inactivity: A Discrete Choice Model Approach (hereafter INDH). Therefore, massive cooperative creation can be seen in the regions that provide subsidies granted by NGOs or governmental programs. This fact does not help the real development of cooperatives, it instead increases the spirit of assistantship and dependence on government and NGOs. In that framework, the creation of cooperatives is no longer spontane- ous in the sense that it is generated rather by an impulsion of government departments and NGOs rather than by the will of people to cooperate. Unfortunately, one can easily observe the existence of ghost cooperatives that have never been active. Survival Functions by Sector. Figure 9 shows that cooperatives operating in the sectors of agriculture and literacy are those with the best lifetimes. As we saw earlier, inactivity remains one of the biggest prob- lems that cooperatives encounter. For instance, the second cluster, which contains the majority of YGC, records a rate of inactivity of 50%. Understanding the determinants of inactivity is therefore vital. In order to achieve this, a discrete choice model is used. The estimated model is as follows: Pr 1 iii i PZXX (3) where is the conditional probability of being inactive, i P 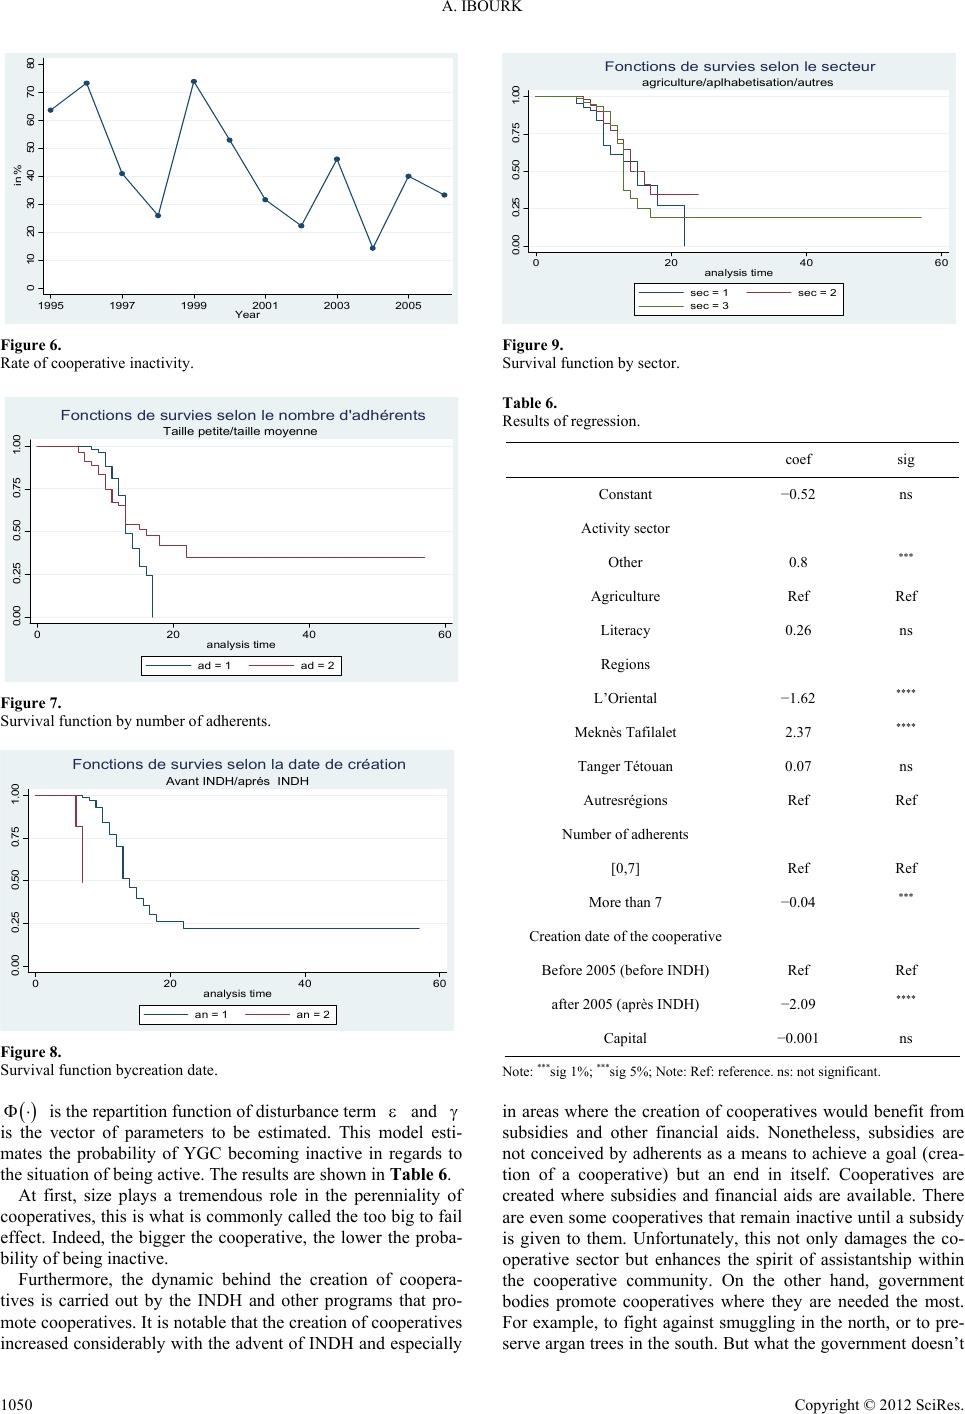 A. IBOURK 010 20 30 40 50 60 70 80 in % 1995 1997 1999 2001 2003 2005 Year Figure 6. Rate of cooperative inactivity. 0.00 0.25 0.50 0.75 1.00 020 40 60 analysis time ad = 1ad = 2 Taille petite/taille moyenne Fonctions de survies selon le nombre d'adhé rents Figure 7. Survival function by number of adherents. 0.00 0.25 0.50 0.75 1.00 020 40 60 analysis time an = 1an = 2 Avant INDH/aprés INDH Fonctions de survies selon la date de création Figure 8. Survival function bycreation date. is the repartition function of disturbance term and is the vector of parameters to be estimated. This model esti- mates the probability of YGC becoming inactive in regards to the situation of being active. The results are shown in Table 6. At first, size plays a tremendous role in the perenniality of cooperatives, this is what is commonly called the too big to fail effect. Indeed, the bigger the cooperative, the lower the proba- bility of being inactive. Furthermore, the dynamic behind the creation of coopera- tives is carried out by the INDH and other programs that pro- mote cooperatives. It is notable that the creation of cooperatives increased considerably with the advent of INDH and especially 0.00 0.25 0.50 0.75 1.00 020 40 60 analysis time sec = 1sec = 2 sec = 3 agriculture/aplhabetisation/autres Fonctions de survies selon le secteur Figure 9. Survival function by sector. Table 6. Results of regression. coef sig Constant −0.52 ns Activity sector Other 0.8 *** Agriculture Ref Ref Literacy 0.26 ns Regions L’Oriental −1.62 **** Meknès Tafilalet 2.37 **** Tanger Tétouan 0.07 ns Autresrégions Ref Ref Number of adherents [0,7] Ref Ref More than 7 −0.04 *** Creation date of the cooperative Before 2005 (before INDH) Ref Ref after 2005 (après INDH) −2.09 **** Capital −0.001 ns Note: ***sig 1%; ***sig 5%; Note: Ref: reference. ns: not significant. in areas where the creation of cooperatives would benefit from subsidies and other financial aids. Nonetheless, subsidies are not conceived by adherents as a means to achieve a goal (crea- tion of a cooperative) but an end in itself. Cooperatives are created where subsidies and financial aids are available. There are even some cooperatives that remain inactive until a subsidy is given to them. Unfortunately, this not only damages the co- operative sector but enhances the spirit of assistantship within the cooperative community. On the other hand, government bodies promote cooperatives where they are needed the most. For example, to fight against smuggling in the north, or to pre- serve argan trees in the south. But what the government doesn’t Copyright © 2012 SciRes. 1050  A. IBOURK seem to understand is that the population of members is too heterogeneous to lead a coherent action. A careful study of individual trajectories may therefore be a powerful tool to de- termine pertinent categories. Cooperatives also deal with several problems related to member retention (Barraud-Didier and Henninger, 2009). Actually, one can seethe opportunism of members: the relationship between members and their coopera- tives has certainly changed. This leads to a weak or even inac- tive cooperative due to a lack of fidelity from its adherents. This econometric analysis confirms the conclusions raised by the previous typological analysis insofar as both analyses shed light on the prevalence of inactivity in the cooperative sector. In addition, the econometric analysis identifies some determinants of cooperative inactivity in Morocco such as the size of the activity sector as well as the creation date. Furthermore, a my- riad of constraints are affecting the cooperative sector and more especially the YGC. Several conclusions can be drawn based on a qualitative survey of the cooperative sector: A member’s professional trajectory is marked by long-term unemployment along with the absence of professional ex- perience. Getting involved with cooperatives is thus basi- cally motivated by the desire to escape from unemployment toa form of self-employment, for lack of a better option. In fact, the main reason behind creating cooperatives is receipt of assistance (i.e., subsidies). From this perspective, little importance is accorded to managerial practice. Unfortu- nately, some cooperatives are badly managed and produce outcomes below expectation due to member skills. Others are managed without any strategy or planning, even though funding is reliable. Worst of all, several cooperatives do not held meetings of governing bodies and suffer from unskilled human resources. When asked about their jobs in cooperatives, almost half the members responded that they were unsatisfied with their job conditions. Difficulties inherent to administrative and logis- tic problems cannot be overcome, cooperative incomes are very low and cooperation between members is hard to settle. It is therefore not surprising that over 60% of cooperative members are looking for another job. No doubt that this situation causes a sort of detachment between members and their cooperative. Moreover, cooperatives suffer from a lack of competitiveness, and there are many reasons for this: cooperatives cannot reach many markets and also suffer from a rude competition. There is huge lack of synergy be- tween them. Finally, since most cooperatives are located in remote areas, where infrastructure leaves much to be desired, the costs of supply and delivery are very high. Conclusion and Implications The priority of professional insertion of young graduates is needed for mainly two reasons. First, unemployment is not socially acceptable. Second, this phenomenon has harmful effects on both economy and society. The magnitude of graduate un- employment in the new Moroccan labor market framework has led the government to intensify and to diversify their inter- ventions in terms of employment policy. YGCs are considered an alternative pathway, but unfortunately their performance is still below expectations. YGCs are oriented towards promising activities such as lite- racy, accounting, e-trade, telecommunications, medicinal and aromatic plants, as well as tourism. Sectoral analysis showed that there is a strong concentration in agriculture (140 entities) followed by the literacy sector (59 entities), forests (21 entities), the craft industry (20 entities) and transport (15 entities). These five sectors include over 88% of total cooperatives. On the other hand, spatial analysis reveals a strong disparity between regions. Indeed, 73% of Moroccan cooperatives are concen- trated in only six regions: Oriental (19.38%), Meknes-Tafilalet 16.61%, Tan-giers-Tetouan 12.80%, Fes-Boulmane 12.80%, Rabat-Salé-Zemmour-Zair 7.27% and Gharb-Chrarda-Bni-Hssen 6.92%. However, considering the problems encountered by the co- operative sector, it is clear that these entities do not play amply their role. Most members are not satisfied with their job condi- tions within the cooperatives and are looking actively for other jobs, leading to a lack of interest in their current job. In addition, cooperatives are not well-managed and are economically weak. Policy makers should readopt their actions in order to resolve the problem by sufficiently training managers and adopting results-based financial aids among other measures. There is no need to recall that cooperatives, which work in proper condi- tions, offer a lot of advantages to the society as a whole: through efficient self-employment, young graduates will not only escape from unemployment but will also help their com- munity to achieve numerous goals (fulfilling specific needs, fighting against analphabetism etc.). Unfortunately, if every- thing remains the same, cooperatives are doomed to failure; and so, a promising lever of social development is wasted. REFERENCES Ahrouch, S. (2011). Les coopératives au Maroc: Enjeux et évolutions. RECMA, 322, 23-26. Barraud-Didier, V., & Henninger, M.-C. (2009). Les déterminants de la fidélité des adhérents de coopérativesagricoles. RECMA, 314, 47-62. Bouchafra, M. (2011). Le secteurcoopératifmarocaindurant les cinq- dernièresannées: Unedynamique à soutenir. Revue Marocaine des Coopératives (REMACOOP), 1. Bougroum, M., & Ibourk, A. (2002a). Politiquepublique de l’emploi en faveur des diplômés au Maroc: Analyse etperspective. Revue Cri- tique Economique, 8, 35-51. Bougroum, M., & Ibourk, A. (2002b). Le chômage des diplômés au Maroc: Quelquesréflexionssur les dispositifsd’aide à l’insertion. Re- vue Formation-Emploi, 79, 83-10. Bougroum, M., & Ibourk, A. (2003). Les effets des dispositifsd’aide à la créationd’emploidans un pays en développement: Cas du Maroc. Revue Internationale du Travail (BI T), 142. doi:10.1111/j.1564-913X.2003.tb00125.x Bougroum, M., Ibourk, A., & Löwenthal, P. (2006). La politiqued’- alphabétisation au Maroc: quelrôle pour le secteurassociatif? Mondes en développement, 134, 63-77. doi:10.3917/med.134.0063 Côté, D. (2007). Fondements d’un nouveau paradigme coopératif: Quellesincitations pour les acteursclés? RECMA, 305, 72-91. Côté, D. (2005). Loyauté et identitécoopérative: l’implantation d’un nouveau paradigme cooperative. RECMA, 295, 50-69. Fath Allah, A. (2011). Le SecteurCoopératif au Maroc. Revue Mar- ocaine des Coopératives (REMACOOP ). Ibourk, A. (2010). Morocco: The challenges of employment, equal opportunities and moving out of informality in jobs, freedom, and social justice: The economic and social roots of the “Arab spring’ (BIT)” Bureau International du travail, Genève. ODCO (1999). Les coopératives de femmes au Maroc: Etat des lieux. Etude Coopératives, 8. ODCO (2002). Les coopératives de jeunes au Maroc: état des lieux. Etude Coopératives, 10. ODCO (2003). Annuairestatistique des coopératives au Marocannée 2002. Edition 2003. Copyright © 2012 SciRes. 1051  A. IBOURK Copyright © 2012 SciRes. 1052 ODCO (2005). Annuairestatistique des coopératives au Marocannée 2004. Edition 2005. ODCO (2007). Annuairestatistique des coopératives au Marocannée 2006. Edition 2007. ODCO (2009). Annuairestatistique des coopératives au Marocannée 2008. Edition 2009. ODCO (2011). Annuairestatistique des coopératives au Marocannée 2010. Edition 2011. ODCO (2012). Revue “Att aaao un”, n 89. ODCO (2012). Revue “Att aaao un”, n 100. |