

Paper Menu >>
Journal Menu >>
 Creative Education 2012. Vol.3, Special Issue, 943-945 Published Online October 2012 in SciRes (http://www.SciRP.org/journal/ce) http://dx.doi.org/10.4236/ce.2012.326143 Copyright © 2012 SciRes. 943 A Systematic Error Leading to Overoptimistic Item Analysis of a Medical Admission Test Gilbert Reibnegger1, Hans-Chri s t i an Ca luba2, Daniel Ithaler2, Simone Manhal3, Heide Maria Neges2 1Institute of Physiological Chemistry, Center of Physiological Chemistry, Medical University of Graz, Graz, Austria 2Organisational Unit for Studies and Teaching, Medical University of Graz, Graz, Austria 3Office of the Vice Rector for Studies and Teaching, Medical University of Graz, Graz, Austria Email: [email protected] Received July 31st, 2012; revised August 26th, 20 12 ; ac ce pt ed Se pt ember 12th, 2012 During the course of the admission procedure for the diploma programs Human Medicine and Dentistry at the Medical University of Graz in July 2009, a serious error occurred in the evaluation process resulting in the publication of an erroneous provisional list of successful applicants. Under considerable public in- terest this wrong list had to be withdrawn and corrected. The publication of the erroneous list had been encouraged by a preceding item analysis yielding falsely optimistic results due to this systematic error. The source of the error and its consequences are described in detail, and a simple recipe to avoid similar errors in the future is provided. Keywords: Item Analysis; Index of Difficulty; Index of Discrimination; Admission Test; Medical Studies Introduction Item analysis examines the responses of students or, more generally, of test subjects to individual test items, and it is one of the standard tools for assessing the quality of test items and of a test as a whole. The basic statistics used in item analysis are the indices of difficulty and of discrimination (Lienert & Raatz, 1988). The index of difficulty of a test item is simply the proportion of correct answers among all tested subjects. Thus, if 60 percent of all test subjects give the correct answer to an item, the index of difficulty of this item is 0.60. Normally, a range of item difficulties between 0.20 and 0.80 would be de- sirable. Some item a nalysts define the index of difficulty as the proportion of wrong answers, but clearly, this does not really alter the substance of this index. The computation of the index of test discrimination is mathe- matically a bit more complex; briefly, this index measures whether or not the proportion of correct answers to a given test item is reliable in comparison with the overall abilities of the tested subjects, estimated from their response behavior regard- ing the complete test. The index of discrimination should be positive; in practice, it seldom would exceed 0.50. If it lies above 0.30, it would be judged as “good”, between 0.10 and 0.30, as “fair”, and below 0.10, as “poor”. A negative index of discrimination would indicate that the test item under scrutiny is correctly answered by a higher proportion of test subjects performing worse on the test as a whole, and by a lower frac- tion of those performing globally better. Such test items are not desirable and should be either changed or even removed from the test before applying the test in the future. In Austria, admission to university studies has generally been open, but for few studies, among them the medical studies of human medicine and dentistry, admission is regulated by ad- mission tests since 2005. The Medical University of Graz has developed an admission test based on secondary school level- knowledge in biology, chemistry, mathematics and physics, and on comprehension of scientific texts. Recent studies have shown a strong improvement of study progress as well as a dramatic reduction of study dropout rate after introducing this admission test (Reibnegger, Caluba, Ithaler, Manhal, Neges, & Smolle, 2010, 2011). The admission procedure consists of three steps: after an electronic preregistration period during February, applicants have to provide written material of application until the end of April. The admission test takes place during the first days of July as a paper and pencil-based multiple choice test. Evalua- tion is performed electronically after scanning in the answer sheets. At this stage, test quality is assured by item analysis. The aim of this important step is to check the test items, based on the response behavior of the applicants, for their quality. If by item analysis one or more test items would be detected with, e.g. a negative index of discrimination, this item could be re- moved from the test and, by re-evaluation, a fair test result would be obtained. By the end of July, a provisional list of results is published via the internet. At this time each applicant is provided an elec- tronic copy of her or his answer sheet, and is entitled to raise an objection if she or he believes something might be wrong with test evaluation. For example, she or he might think that the sum of correct answers had been counted incorrectly. By the mid of August, after due consideration of each objection, a final list of results is published via the internet. The admission test is clearly a high-stakes test: at the Medi- cal University of Graz, the number of available study places is 360 per year, and there are much more applicants. For example, in 2011 and 2012, there were between 1700 and 1800 appli- cants. Importantly, the applicants are ranked according to their test achievements, and only the 360 top ranking applicants are 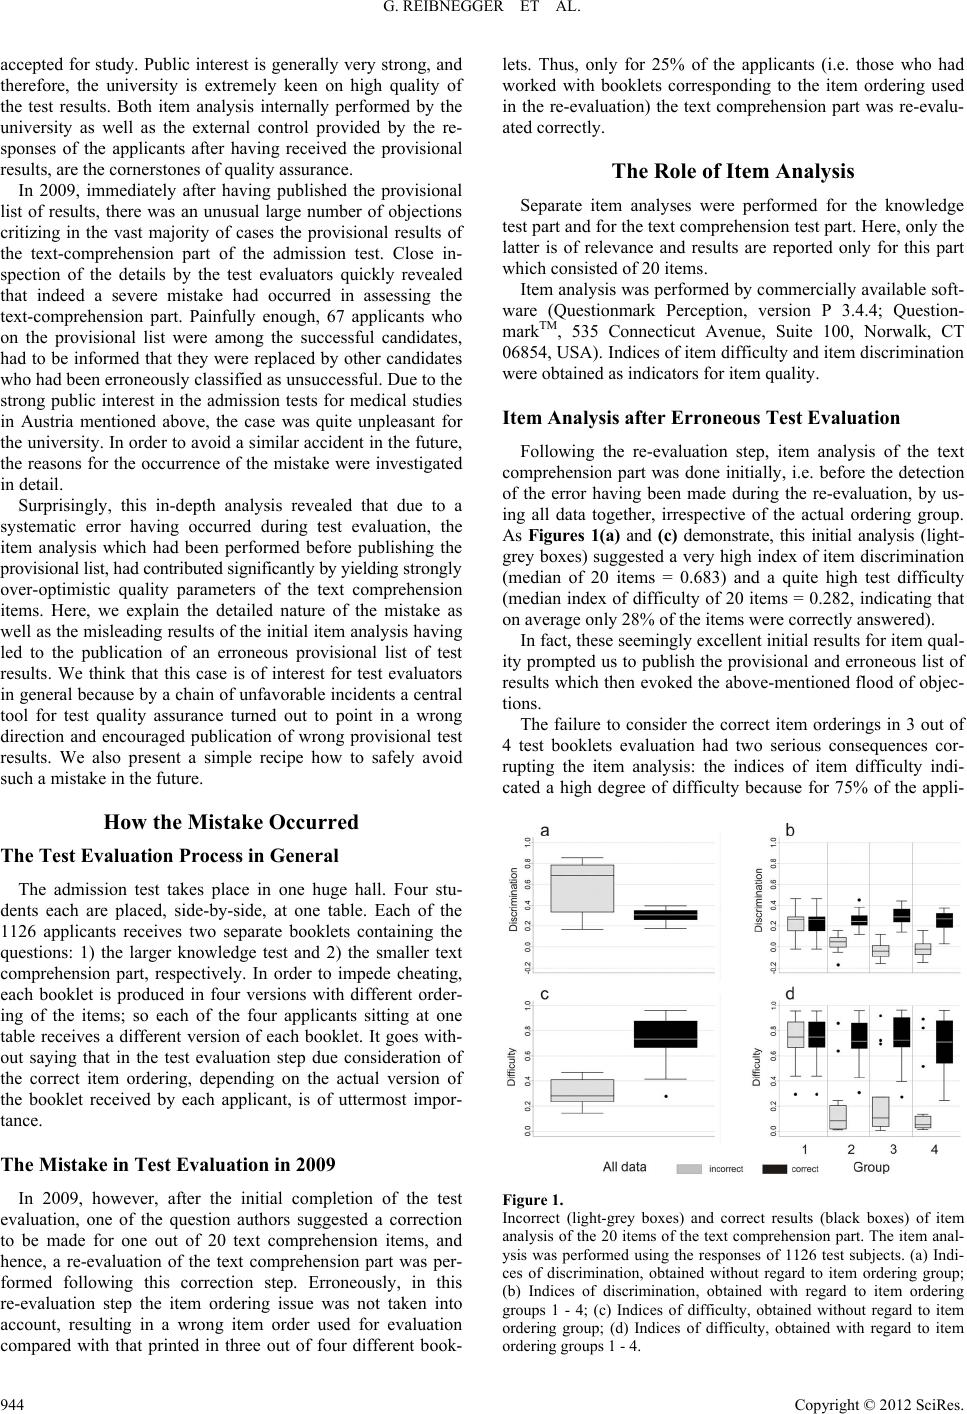 G. REIBNEGGER ET AL. accepted for study. Public interest is generally very strong, and therefore, the university is extremely keen on high quality of the test results. Both item analysis internally performed by the university as well as the external control provided by the re- sponses of the applicants after having received the provisional results, are the cornerstones of quality assurance. In 2009, immediately after having published the provisional list of results, there was an unusual large number of objections critizing in the vast majority of cases the provisional results of the text-comprehension part of the admission test. Close in- spection of the details by the test evaluators quickly revealed that indeed a severe mistake had occurred in assessing the text-comprehension part. Painfully enough, 67 applicants who on the provisional list were among the successful candidates, had to be informed that they were replaced by other candidates who had been erroneously classified as unsuccessful. Due to the strong public interest in the admission tests for medical studies in Austria mentioned above, the case was quite unpleasant for the university. In order to avoid a similar accident in the future, the reasons for the occurrence of the mistake were investigated in detail. Surprisingly, this in-depth analysis revealed that due to a systematic error having occurred during test evaluation, the item analysis which had been performed before publishing the provis ional list, had contr ibute d significantly by yie lding strongly over-optimistic quality parameters of the text comprehension items. Here, we explain the detailed nature of the mistake as well as the misleading results of the initial item analysis having led to the publication of an erroneous provisional list of test results. We think that this case is of interest for test evaluators in general because by a chain of unfavorable incidents a central tool for test quality assurance turned out to point in a wrong direction and encouraged publication of wrong provisional test results. We also present a simple recipe how to safely avoid such a mistake in the future. How the Mistake Occurred The Test Evaluation Process in General The admission test takes place in one huge hall. Four stu- dents each are placed, side-by-side, at one table. Each of the 1126 applicants receives two separate booklets containing the questions: 1) the larger knowledge test and 2) the smaller text comprehension part, respectively. In order to impede cheating, each booklet is produced in four versions with different order- ing of the items; so each of the four applicants sitting at one table receives a different version of each booklet. It goes with- out saying that in the test evaluation step due consideration of the correct item ordering, depending on the actual version of the booklet received by each applicant, is of uttermost impor- tance. The Mistake in Test Evaluation in 2009 In 2009, however, after the initial completion of the test evaluation, one of the question authors suggested a correction to be made for one out of 20 text comprehension items, and hence, a re-evaluation of the text comprehension part was per- formed following this correction step. Erroneously, in this re-evaluation step the item ordering issue was not taken into account, resulting in a wrong item order used for evaluation compared with that printed in three out of four different book- lets. Thus, only for 25% of the applicants (i.e. those who had worked with booklets corresponding to the item ordering used in the re-evaluation) the text comprehension part was re-evalu- ated correctly. The Role of Item Analysis Separate item analyses were performed for the knowledge test part and for the text comprehension test part. Here, only the latter is of relevance and results are reported only for this part which consisted of 20 items. Item analysis was performed by commercially available soft- ware (Questionmark Perception, version P 3.4.4; Question- markTM, 535 Connecticut Avenue, Suite 100, Norwalk, CT 06854, USA). Indices of item difficulty and item discrimination were obtained as indicators for item quality. Item Analysis after Erroneous Test Evaluation Following the re-evaluation step, item analysis of the text comprehension part was done initially, i.e. before the detection of the error having been made during the re-evaluation, by us- ing all data together, irrespective of the actual ordering group. As Figures 1(a) and (c) demonstrate, this initial analysis (light- grey boxes) suggested a very high index of item discrimination (median of 20 items = 0.683) and a quite high test difficulty (median index of difficulty of 20 items = 0.282, indicating that on average only 28% of the items were correctly answered). In fact, these seemingly excellent initial results for item qual- ity prompted us to publish the provisional and erroneous list of results which then evoked the above-mentioned flood of objec- tions. The failure to consider the correct item orderings in 3 out of 4 test booklets evaluation had two serious consequences cor- rupting the item analysis: the indices of item difficulty indi- cated a high degree of difficulty because for 75% of the appli- Figure 1. Incorrect (light-grey boxes) and correct results (black boxes) of item analysis of the 20 items of the text comprehension part. The item anal- ysis was performed using the responses of 1126 test subjects. (a) Indi- ces of discrimination, obtained without regard to item ordering group; (b) Indices of discrimination, obtained with regard to item ordering groups 1 - 4; (c) Indices of difficulty, obtained without regard to item ordering group; (d) Indices of difficulty, obtained with regard to item ordering groups 1 - 4. Copyright © 2012 SciRes. 944  G. REIBNEGGER ET AL. Copyright © 2012 SciRes. 945 cants most answers were falsely judged as being “wrong”. For the indices of discrimination, a particularly fatal interaction occurred: the 25% of applicants who worked with the question booklet with the correct item ordering performed very well on the text comprehension test while the remaining 75% failed nearly completely. So apparently for each of the 20 items those test participants who responded correctly were also particularly successful globally, while those with a seemingly wrong an- swer to each of the 20 items (mainly due to the item ordering issue) also failed on the test as a whole. As the index of dis- crimination judges for each item how well it is mastered by those being among the successful applicants, compared with the performance of the failing applicants, in a self-fulfilling manner the indices of discrimination became very high due to the sys- tematic error made in the re-evaluation step. Item Analysis after Correction of Test Evaluation After detection of the error, the re-evaluation step was re- peated, now using the correct item orderings. The results changed dramatically (Figures 1(a) and (c), black boxes): the indices of discrimination dropped to “normal” values (median 0.307) and the indices of difficulty increased (median 0.736) indicating that the text comprehension test with an average of about 74% percent correctly answered items was only moder- ately difficult. A Simple Recipe to Avoid Mistakes of This Kind Given the fact that in complex processes like the evaluation of a high-stakes admission test with several hundreds or even thousands of participants mistakes may occur despite all efforts, could the unpleasant consequences of this mistake have been avoided? The answer is “yes”: had we performed the item analysis separately for each item ordering scheme (i.e. for each of the four versions of the test booklet), the systematic error would have been safely detected and the publication of the erroneous results would have never occurred. Figures 1(b) and (d) illustrate the results that would have been obtained: for all ordering schemes with the exception of the correct one (de- noted by group 1), highly suspicious results (light-grey boxes) would have had resulted. The strong deviation between the correct ordering group and the remaining ones as well as the unusual poor and partly even negative discrimination indices with certainty would have attracted enough attention to revise the whole assessment and to detect the error prior to publication of the provisional list. Conclusion Item analysis is a powerful tool to detect suspicious test items, and therefore, it constitutes an important cornerstone in the process of quality assurance of a test. Usually problematic test items as well as errors in the test evaluation step become evi- dent for the test evaluators by the results of item analysis. Un- der certain circumstances, however, systematic errors in the evaluation process like the one reported here can lead to mis- leadingly optimistic results of item analysis falsely suggesting a particularly high item quality. Whenever in an assessment situ- ation more than one ordering schemes of items are being used for different subgroups of the test subjects, based on the ex- perience reported herein we strongly suggest to include in the test evaluation process separate item analyses for each of the different item ordering schemes in order to avoid the pitfall reported in this paper. One additional lesson that can be drawn from the case re- ported in this paper, is the value of the external source of qual- ity control due to a transparent communication of the test re- sults: in fact, the quick and immediate objections raised by a considerable number of test applicants after publication of the erroneous provisional list of results led to the expeditious de- tection of the error and its correction. REFERENCES Lienert, G. A., & Raatz, U. (1988). Testaufbau und testanalyse (6th ed.). Weinheim, Baden-Wür tt ember g: Psychologie Verl ags-Union. Reibnegger, G., C aluba , H.-C., Ith al er, D., Manha l, S., Neges, H. M., & Smolle, J. (2010). Progress of medical students after open admission or admission based on knowledge tests. Medical Education, 44, 205- 214. doi:10.1111/j.1365-2923.2009.03576.x Reibnegger, G., C aluba , H.-C., Ith al er, D., Manha l, S., Neges, H. M., & Smolle, J. (2011). Dropout rates in medical students at one school before and after the installation of admission tests in Austria. Aca- demic Medicine, 86, 1040-1048. doi:10.1097/ACM.0b013e3182223a1b |