

Paper Menu >>
Journal Menu >>
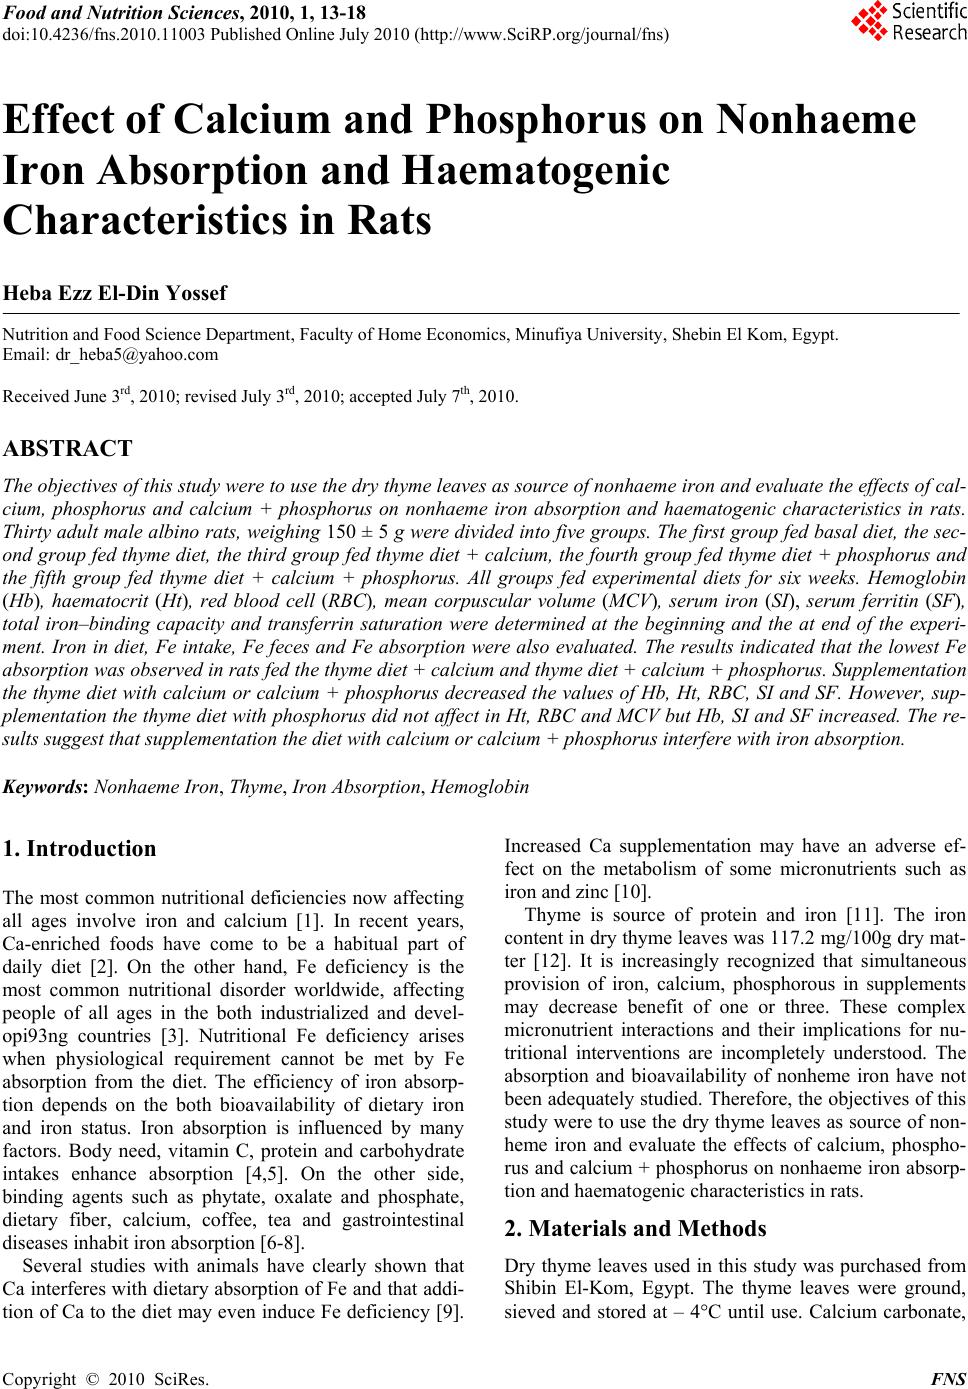 Food and Nutrition Sciences, 2010, 1, 13-18 doi:10.4236/fns.2010.11003 Published Online July 2010 (http://www.SciRP.org/journal/fns) Copyright © 2010 SciRes. FNS 13 Effect of Calcium and Phosphorus on Nonhaeme Iron Absorption and Haematogenic Characteristics in Rats Heba Ezz El-Din Yossef Nutrition and Food Science Department, Faculty of Home Economics, Minufiya University, Shebin El Kom, Egypt. Email: [email protected] Received June 3rd, 2010; revised July 3rd, 2010; accepted July 7th, 2010. ABSTRACT The objectives of this study were to use the dry thyme leaves as source of nonhaeme iron and evaluate the effects of cal- cium, phosphorus and calcium + phosphorus on nonhaeme iron absorption and haematogenic characteristics in rats. Thirty adult male albino ra ts, weighing 150 ± 5 g were divided into five groups. The first group fed basal diet, the sec- ond group fed thyme diet, the third group fed thyme diet + calcium, the fourth group fed thyme diet + phosphorus and the fifth group fed thyme diet + calcium + phosphorus. All groups fed experimental diets for six weeks. Hemoglobin (Hb), haematocrit (Ht), red blood cell (RBC), mean corpuscular volume (MCV), serum iron (SI), serum ferritin (SF), total iron–binding capacity and transferrin saturation were determined at the beginning and the at end of the experi- ment. Iron in diet, Fe intake, Fe feces and Fe absorption were also evaluated. The results indicated that the lowest Fe absorption was observed in rats fed the thyme diet + calcium and thyme diet + calcium + phosphorus. Supplementation the thyme diet with calcium or calcium + phosphorus decreased the values of Hb, Ht, RBC, SI and SF. However, sup- plementation the thyme diet with phosphorus did not affect in Ht, RBC and MCV but Hb, SI and SF increased. The re- sults suggest that supp lementation the diet with calcium or calcium + phosphorus interfere with iron absorption. Keywords: Nonhaeme Iron, Thyme, Iron Absorption, Hemoglobin 1. Introduction The most common nutritional deficiencies now affecting all ages involve iron and calcium [1]. In recent years, Ca-enriched foods have come to be a habitual part of daily diet [2]. On the other hand, Fe deficiency is the most common nutritional disorder worldwide, affecting people of all ages in the both industrialized and devel- opi93ng countries [3]. Nutritional Fe deficiency arises when physiological requirement cannot be met by Fe absorption from the diet. The efficiency of iron absorp- tion depends on the both bioavailability of dietary iron and iron status. Iron absorption is influenced by many factors. Body need, vitamin C, protein and carbohydrate intakes enhance absorption [4,5]. On the other side, binding agents such as phytate, oxalate and phosphate, dietary fiber, calcium, coffee, tea and gastrointestinal diseases inhabit iron absorption [6-8]. Several studies with animals have clearly shown that Ca interferes with dietary absorption of Fe and that addi- tion of Ca to the diet may even induce Fe deficiency [9]. Increased Ca supplementation may have an adverse ef- fect on the metabolism of some micronutrients such as iron and zinc [10]. Thyme is source of protein and iron [11]. The iron content in dry thyme leaves was 117.2 mg/100g dry mat- ter [12]. It is increasingly recognized that simultaneous provision of iron, calcium, phosphorous in supplements may decrease benefit of one or three. These complex micronutrient interactions and their implications for nu- tritional interventions are incompletely understood. The absorption and bioavailability of nonheme iron have not been adequately studied. Therefore, the objectives of this study were to use the dry thyme leaves as source of non- heme iron and evaluate the effects of calcium, phospho- rus and calcium + phosphorus on nonhaeme iron absorp- tion and haematogenic characteristics in rats. 2. Materials and Methods Dry thyme leaves used in this study was purchased from Shibin El-Kom, Egypt. The thyme leaves were ground, sieved and stored at – 4°C until use. Calcium carbonate, 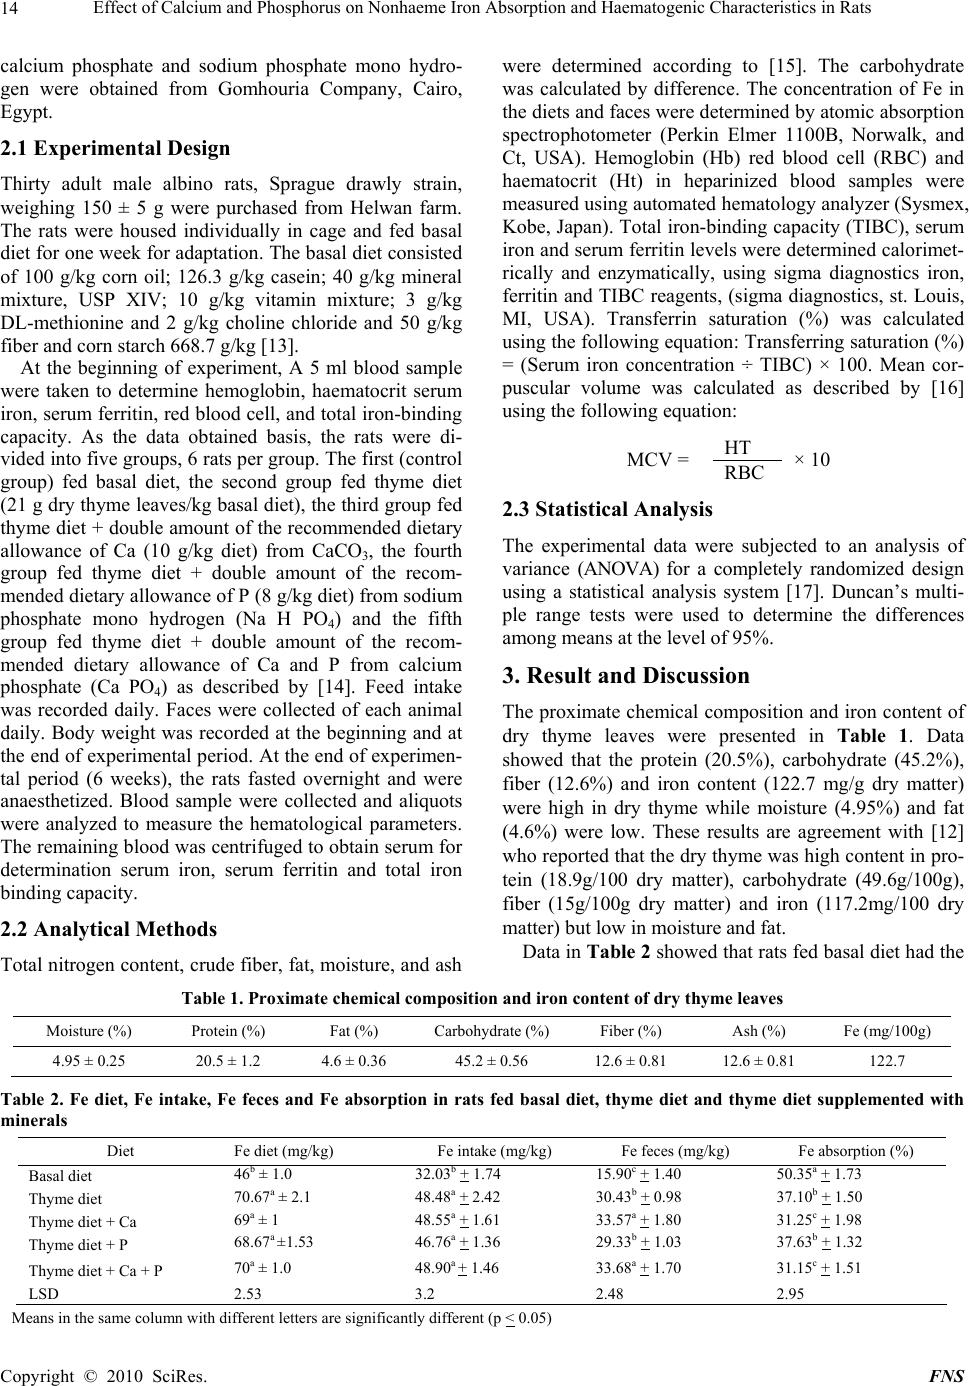 Effect of Calcium and Phosphorus on Nonhaeme Iron Absorption and Haematogenic Characteristics in Rats 14 calcium phosphate and sodium phosphate mono hydro- gen were obtained from Gomhouria Company, Cairo, Egypt. 2.1 Experimental Design Thirty adult male albino rats, Sprague drawly strain, weighing 150 ± 5 g were purchased from Helwan farm. The rats were housed individually in cage and fed basal diet for one week for adaptation. The basal diet consisted of 100 g/kg corn oil; 126.3 g/kg casein; 40 g/kg mineral mixture, USP XIV; 10 g/kg vitamin mixture; 3 g/kg DL-methionine and 2 g/kg choline chloride and 50 g/kg fiber and corn starch 668.7 g/kg [13]. At the beginning of experiment, A 5 ml blood sample were taken to determine hemoglobin, haematocrit serum iron, serum ferritin, red blood cell, and total iron-binding capacity. As the data obtained basis, the rats were di- vided into five groups, 6 rats per group. The first (control group) fed basal diet, the second group fed thyme diet (21 g dry thyme leaves/kg basal diet), the third group fed thyme diet + double amount of the recommended dietary allowance of Ca (10 g/kg diet) from CaCO3, the fourth group fed thyme diet + double amount of the recom- mended dietary allowance of P (8 g/kg diet) from sodium phosphate mono hydrogen (Na H PO4) and the fifth group fed thyme diet + double amount of the recom- mended dietary allowance of Ca and P from calcium phosphate (Ca PO4) as described by [14]. Feed intake was recorded daily. Faces were collected of each animal daily. Body weight was recorded at the beginning and at the end of experimental period. At the end of experimen- tal period (6 weeks), the rats fasted overnight and were anaesthetized. Blood sample were collected and aliquots were analyzed to measure the hematological parameters. The remaining blood was centrifuged to obtain serum for determination serum iron, serum ferritin and total iron binding capacity. 2.2 Analytical Methods Total nitrogen content, crude fiber, fat, moisture, and ash were determined according to [15]. The carbohydrate was calculated by difference. The concentration of Fe in the diets and faces were determined by atomic absorption spectrophotometer (Perkin Elmer 1100B, Norwalk, and Ct, USA). Hemoglobin (Hb) red blood cell (RBC) and haematocrit (Ht) in heparinized blood samples were measured using automated hematology analyzer (Sysmex, Kobe, Japan). Total iron-binding capacity (TIBC), serum iron and serum ferritin levels were determined calorimet- rically and enzymatically, using sigma diagnostics iron, ferritin and TIBC reagents, (sigma diagnostics, st. Louis, MI, USA). Transferrin saturation (%) was calculated using the following equation: Transferring saturation (%) = (Serum iron concentration ÷ TIBC) × 100. Mean cor- puscular volume was calculated as described by [16] using the following equation: HT MCV = RBC × 10 2.3 Statistical Analysis The experimental data were subjected to an analysis of variance (ANOVA) for a completely randomized design using a statistical analysis system [17]. Duncan’s multi- ple range tests were used to determine the differences among means at the level of 95%. 3. Result and Discussion The proximate chemical composition and iron content of dry thyme leaves were presented in Table 1. Data showed that the protein (20.5%), carbohydrate (45.2%), fiber (12.6%) and iron content (122.7 mg/g dry matter) were high in dry thyme while moisture (4.95%) and fat (4.6%) were low. These results are agreement with [12] who reported that the dry thyme was high content in pro- tein (18.9g/100 dry matter), carbohydrate (49.6g/100g), fiber (15g/100g dry matter) and iron (117.2mg/100 dry matter) but low in moisture and fat. Data in Table 2 showed that rats fed basal diet had the Table 1. Proximate chemical composition and iron content of dry thyme leaves Moisture (%) Protein (%) Fat (%) Carbohydrate (%) Fiber (%) Ash (%) Fe (mg/100g) 4.95 ± 0.25 20.5 ± 1.2 4.6 ± 0.36 45.2 ± 0.56 12.6 ± 0.81 12.6 ± 0.81 122.7 Table 2. Fe diet, Fe intake, Fe feces and Fe absorption in rats fed basal diet, thyme diet and thyme diet supplemented with minerals Diet Fe diet (mg/kg) Fe intake (mg/kg) Fe feces (mg/kg) Fe absorption (%) Basal diet 46b ± 1.0 32.03b + 1.74 15.90c + 1.40 50.35a + 1.73 Thyme diet 70.67a ± 2.1 48.48a + 2.42 30.43b + 0.98 37.10b + 1.50 Thyme diet + Ca 69a ± 1 48.55a + 1.61 33.57a + 1.80 31.25c + 1.98 Thyme diet + P 68.67a ±1.53 46.76a + 1.36 29.33b + 1.03 37.63b + 1.32 Thyme diet + Ca + P 70a ± 1.0 48.90a + 1.46 33.68a + 1.70 31.15c + 1.51 LSD 2.53 3.2 2.48 2.95 Means in the same column with different letters are significantly different (p < 0.05) Copyright © 2010 SciRes. FNS 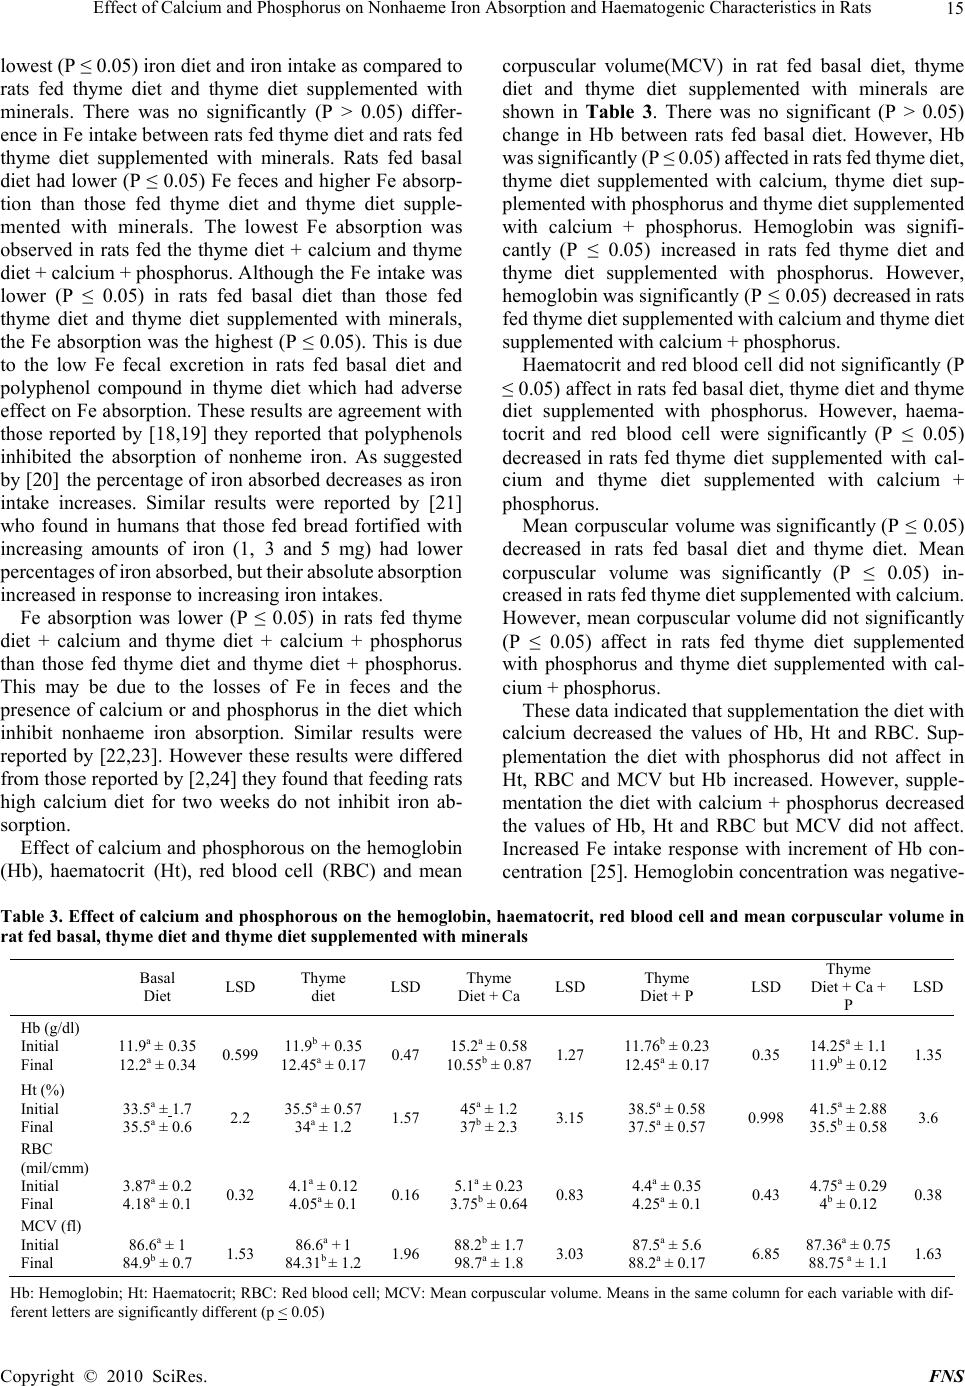 Effect of Calcium and Phosphorus on Nonhaeme Iron Absorption and Haematogenic Characteristics in Rats 15 lowest (P ≤ 0.05) iron diet and iron intake as compared to rats fed thyme diet and thyme diet supplemented with minerals. There was no significantly (P > 0.05) differ- ence in Fe intake between rats fed thyme diet and rats fed thyme diet supplemented with minerals. Rats fed basal diet had lower (P ≤ 0.05) Fe feces and higher Fe absorp- tion than those fed thyme diet and thyme diet supple- mented with minerals. The lowest Fe absorption was observed in rats fed the thyme diet + calcium and thyme diet + calcium + phosphorus. Although the Fe intake was lower (P ≤ 0.05) in rats fed basal diet than those fed thyme diet and thyme diet supplemented with minerals, the Fe absorption was the highest (P ≤ 0.05). This is due to the low Fe fecal excretion in rats fed basal diet and polyphenol compound in thyme diet which had adverse effect on Fe absorption. These results are agreement with those reported by [18,19] they reported that polyphenols inhibited the absorption of nonheme iron. As suggested by [20] the percentage of iron absorbed decreases as iron intake increases. Similar results were reported by [21] who found in humans that those fed bread fortified with increasing amounts of iron (1, 3 and 5 mg) had lower percentages of iron absorbed, but their absolute absorption increased in response to increasing iron intakes. Fe absorption was lower (P ≤ 0.05) in rats fed thyme diet + calcium and thyme diet + calcium + phosphorus than those fed thyme diet and thyme diet + phosphorus. This may be due to the losses of Fe in feces and the presence of calcium or and phosphorus in the diet which inhibit nonhaeme iron absorption. Similar results were reported by [22,23]. However these results were differed from those reported by [2,24] they found that feeding rats high calcium diet for two weeks do not inhibit iron ab- sorption. Effect of calcium and phosphorous on the hemoglobin (Hb), haematocrit (Ht), red blood cell (RBC) and mean corpuscular volume(MCV) in rat fed basal diet, thyme diet and thyme diet supplemented with minerals are shown in Table 3. There was no significant (P > 0.05) change in Hb between rats fed basal diet. However, Hb was significantly (P ≤ 0.05) affected in rats fed thyme diet, thyme diet supplemented with calcium, thyme diet sup- plemented with phosphorus and thyme diet supplemented with calcium + phosphorus. Hemoglobin was signifi- cantly (P ≤ 0.05) increased in rats fed thyme diet and thyme diet supplemented with phosphorus. However, hemoglobin was significantly (P ≤ 0.05) decreased in rats fed thyme diet supplemented with calcium and thyme diet supplemented with calcium + phosphorus. Haematocrit and red blood cell did not significantly (P ≤ 0.05) affect in rats fed basal diet, thyme diet and thyme diet supplemented with phosphorus. However, haema- tocrit and red blood cell were significantly (P ≤ 0.05) decreased in rats fed thyme diet supplemented with cal- cium and thyme diet supplemented with calcium + phosphorus. Mean corpuscular volume was significantly (P ≤ 0.05) decreased in rats fed basal diet and thyme diet. Mean corpuscular volume was significantly (P ≤ 0.05) in- creased in rats fed thyme diet supplemented with calcium. However, mean corpuscular volume did not significantly (P ≤ 0.05) affect in rats fed thyme diet supplemented with phosphorus and thyme diet supplemented with cal- cium + phosphorus. These data indicated that supplementation the diet with calcium decreased the values of Hb, Ht and RBC. Sup- plementation the diet with phosphorus did not affect in Ht, RBC and MCV but Hb increased. However, supple- mentation the diet with calcium + phosphorus decreased the values of Hb, Ht and RBC but MCV did not affect. Increased Fe intake response with increment of Hb con- centration [25]. Hemoglobin concentration was negative- Table 3. Effect of calcium and phosphorous on the he moglobin, haematocrit, red blood cell and mean corpuscular volume in rat fed basal, thyme diet and thyme diet supplemented with mine r a ls Basal Diet LSD Thyme diet LSD Thyme Diet + Ca LSD Thyme Diet + P LSD Thyme Diet + Ca + P LSD Hb (g/dl) Initial Final 11.9a ± 0.35 12.2a ± 0.34 0.599 11.9b + 0.35 12.45a ± 0.17 0.47 15.2a ± 0.58 10.55b ± 0.87 1.27 11.76b ± 0.23 12.45a ± 0.17 0.35 14.25a ± 1.1 11.9b ± 0.12 1.35 Ht (%) Initial Final 33.5a ± 1.7 35.5a ± 0.6 2.2 35.5a ± 0.57 34a ± 1.2 1.57 45a ± 1.2 37b ± 2.3 3.15 38.5a ± 0.58 37.5a ± 0.57 0.998 41.5a ± 2.88 35.5b ± 0.58 3.6 RBC (mil/cmm) Initial Final 3.87a ± 0.2 4.18a ± 0.1 0.32 4.1a ± 0.12 4.05a ± 0.1 0.16 5.1a ± 0.23 3.75b ± 0.64 0.83 4.4a ± 0.35 4.25a ± 0.1 0.43 4.75a ± 0.29 4b ± 0.12 0.38 MCV (fl) Initial Final 86.6a ± 1 84.9b ± 0.7 1.53 86.6a + 1 84.31b ± 1.2 1.96 88.2b ± 1.7 98.7a ± 1.8 3.03 87.5a ± 5.6 88.2a ± 0.17 6.85 87.36a ± 0.75 88.75 a ± 1.1 1.63 Hb: Hemoglobin; Ht: Haematocrit; RBC: Red blood cell; MCV: Mean corpuscular volume. Means in the same column for each variable with dif- ferent letters are significantly different (p < 0.05) Copyright © 2010 SciRes. FNS 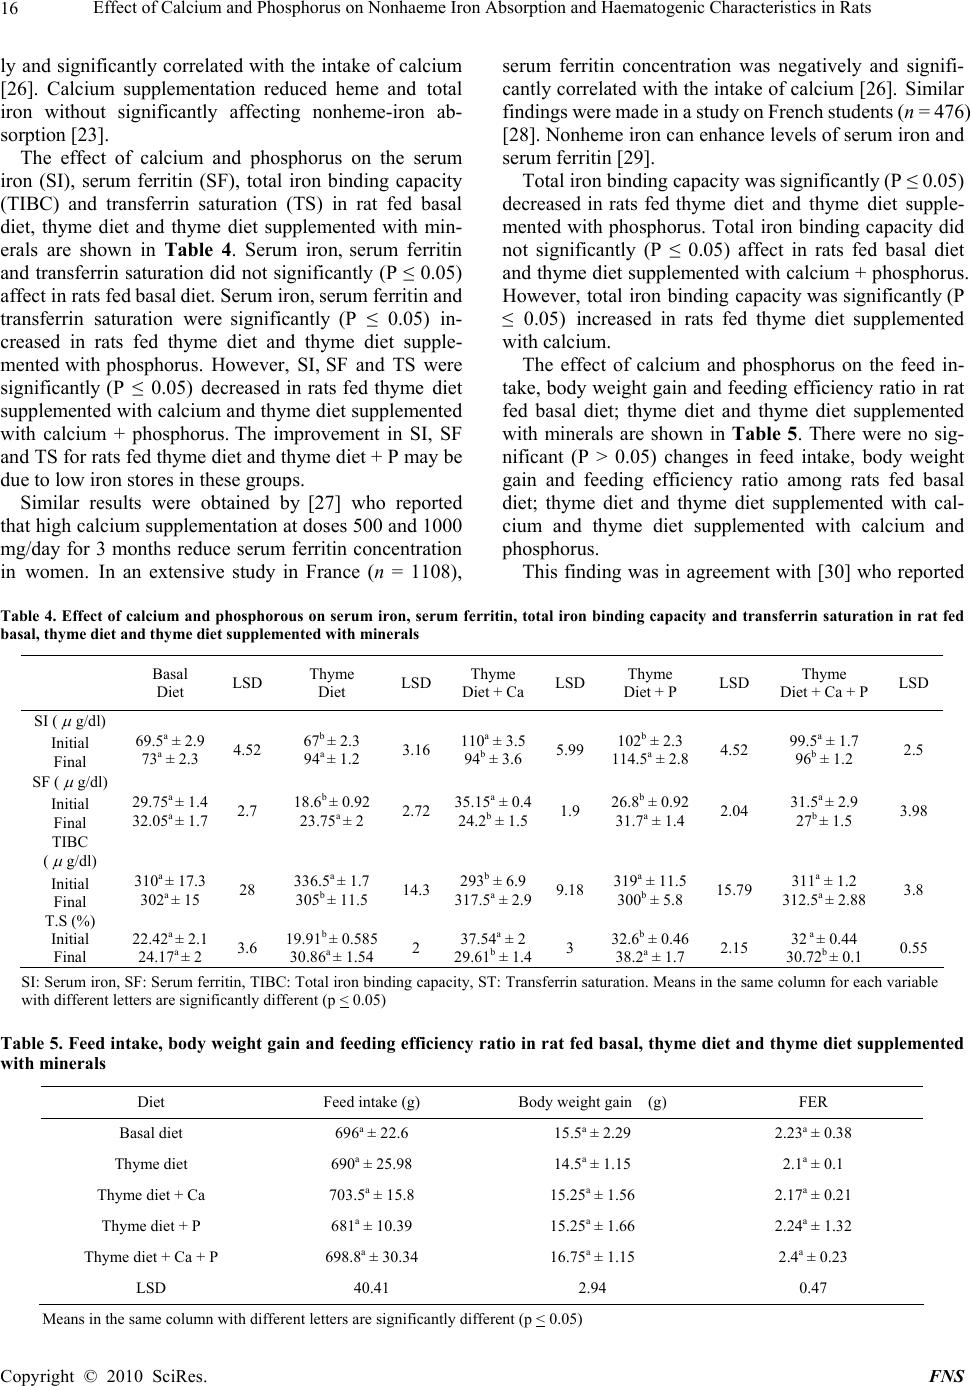 Effect of Calcium and Phosphorus on Nonhaeme Iron Absorption and Haematogenic Characteristics in Rats 16 ly and significantly correlated with the intake of calcium [26]. Calcium supplementation reduced heme and total iron without significantly affecting nonheme-iron ab- sorption [23]. The effect of calcium and phosphorus on the serum iron (SI), serum ferritin (SF), total iron binding capacity (TIBC) and transferrin saturation (TS) in rat fed basal diet, thyme diet and thyme diet supplemented with min- erals are shown in Table 4. Serum iron, serum ferritin and transferrin saturation did not significantly (P ≤ 0.05) affect in rats fed basal diet. Serum iron, serum ferritin and transferrin saturation were significantly (P ≤ 0.05) in- creased in rats fed thyme diet and thyme diet supple- mented with phosphorus. However, SI, SF and TS were significantly (P ≤ 0.05) decreased in rats fed thyme diet supplemented with calcium and thyme diet supplemented with calcium + phosphorus. The improvement in SI, SF and TS for rats fed thyme diet and thyme diet + P may be due to low iron stores in these groups. Similar results were obtained by [27] who reported that high calcium supplementation at doses 500 and 1000 mg/day for 3 months reduce serum ferritin concentration in women. In an extensive study in France (n = 1108), serum ferritin concentration was negatively and signifi- cantly correlated with the intake of calcium [26]. Similar findings were made in a study on French students (n = 476) [28]. Nonheme iron can enhance levels of serum iron and serum ferritin [29]. Total iron binding capacity was significantly (P ≤ 0.05) decreased in rats fed thyme diet and thyme diet supple- mented with phosphorus. Total iron binding capacity did not significantly (P ≤ 0.05) affect in rats fed basal diet and thyme diet supplemented with calcium + phosphorus. However, total iron binding capacity was significantly (P ≤ 0.05) increased in rats fed thyme diet supplemented with calcium. The effect of calcium and phosphorus on the feed in- take, body weight gain and feeding efficiency ratio in rat fed basal diet; thyme diet and thyme diet supplemented with minerals are shown in Table 5. There were no sig- nificant (P > 0.05) changes in feed intake, body weight gain and feeding efficiency ratio among rats fed basal diet; thyme diet and thyme diet supplemented with cal- cium and thyme diet supplemented with calcium and phosphorus. This finding was in agreement with [30] who reported Table 4. Effect of calcium and phosphorous on serum iron, serum ferritin, total iron binding capacity and transferrin saturation in rat fed basal, thyme diet and thyme diet supplemented with minerals Basal Diet LSD Thyme Diet LSD Thyme Diet + Ca LSD Thyme Diet + P LSD Thyme Diet + Ca + P LSD SI ( g/dl) Initial Final 69.5a ± 2.9 73a ± 2.3 4.52 67b ± 2.3 94a ± 1.2 3.16 110a ± 3.5 94b ± 3.6 5.99 102b ± 2.3 114.5a ± 2.8 4.52 99.5a ± 1.7 96b ± 1.2 2.5 SF ( g/dl) Initial Final 29.75a ± 1.4 32.05a ± 1.7 2.7 18.6b ± 0.92 23.75a ± 2 2.72 35.15a ± 0.4 24.2b ± 1.5 1.9 26.8b ± 0.92 31.7a ± 1.4 2.04 31.5a ± 2.9 27b ± 1.5 3.98 TIBC ( g/dl) Initial Final 310a ± 17.3 302a ± 15 28 336.5a ± 1.7 305b ± 11.5 14.3 293b ± 6.9 317.5a ± 2.9 9.18 319a ± 11.5 300b ± 5.8 15.79 311a ± 1.2 312.5a ± 2.88 3.8 T.S (%) Initial Final 22.42a ± 2.1 24.17a ± 2 3.6 19.91b ± 0.585 30.86a ± 1.54 2 37.54a ± 2 29.61b ± 1.4 3 32.6b ± 0.46 38.2a ± 1.7 2.15 32 a ± 0.44 30.72b ± 0.1 0.55 SI: Serum iron, SF: Serum ferritin, TIBC: Total iron binding capacity, ST: Transferrin saturation. Means in the same column for each variable with different letters are significantly different (p < 0.05) Table 5. Feed intake, body weight gain and feeding efficiency ra tio in rat fed basal, thyme diet and thyme diet supplemented with minerals Diet Feed intake (g) Body weight gain (g) FER Basal diet 696a ± 22.6 15.5a ± 2.29 2.23a ± 0.38 Thyme diet 690a ± 25.98 14.5a ± 1.15 2.1a ± 0.1 Thyme diet + Ca 703.5a ± 15.8 15.25a ± 1.56 2.17a ± 0.21 Thyme diet + P 681a ± 10.39 15.25a ± 1.66 2.24a ± 1.32 Thyme diet + Ca + P 698.8a ± 30.34 16.75a ± 1.15 2.4a ± 0.23 LSD 40.41 2.94 0.47 Means in the same column with different letters are significantly different (p < 0.05) Copyright © 2010 SciRes. FNS  Effect of Calcium and Phosphorus on Nonhaeme Iron Absorption and Haematogenic Characteristics in Rats 17 that there no differences in food intake and body weight gain among groups fed flours supplemented with reduced and increased iron. From the above results, it could be concluded that supplementation the diets with calcium carbonate (as a source of Ca) and calcium phosphate (as a source of Ca + P) reduced the iron absorption in rats fed these diets, which must be continuous to have a long – term influ- ence on serum ferritin, total iron binding capacity, trans- ferrin saturation, hemoglobin, haematocrit, red blood cell and mean corpuscular volume. REFERENCES [1] J. D. Cook, S. A. Dassenko and P. Whittaker, “Calcium Supplementation: Effect on Iron Absorption,” American Journal of Clinical Nutrition, Vol. 53, No. 1, 1991, pp. 106-111. [2] I. Lόpez-Aliaga, J. Diaz-Castro, T. Nestares, M. J. M. Alférez and M. S. Campos, “Calcium-Supplemented Goat Milk Does Not Interfere with Iron Absorption in Rats with Anaemia Induced by Dietary Iron Depletion,” Food Chemistry, Vol. 113, No. 3, 2009, pp. 839-841. [3] World Health Organization, “Iron Deficiency Anaemia: Assessment, Prevention and Control. A Guide for Pro- gramme Managers,” World Health Organization, Geneva, 2001, pp. 1-114. [4] T. Hazell, “Chemical Forms and Bioavailability of Dietary Minerals,” World Review of Nutriton and Dietetics, Vol. 46, 1985, pp. 45-63. [5] L. A. Seekib, N. M. El-Shimi and M. A. Kenawi, “Effect of Some Organic Acids on the Iron Bioavailability of Spinach and Faba Beans,” Alexandria Journal of Agri- cultural Research, Vol. 36, 1991, pp. 117-129. [6] M. K. Sweeten, G. C. Smith and H. R. Cross, “Heme Iron Relative to Total Dietary Intake of Iron–Review,” Journal of Food Quality, Vol. 9, No. 4, 1986, pp. 263-275. [7] J. D. Cook, “Determinants on Nonheme Iron Absorption in Man,” Food Technology, Vol. 37, No. 10, 1983, pp. 124-126. [8] S. J. Fairweather-Tait, “Symposium on ‘Micronutrient Interactions’,” Proceedings of the Nutrition Society, Vol. 54, No. 2, 1995, pp. 465-473. [9] L. Hallberg and L. Rossander-Hulten, “The Interaction between Calcium and Iron. Are there Explanations for Conflicting Results?” Scandinavian Journal of Nutrition, Vol. 43, No. 2, 1999, pp. 77-81. [10] J. Díaz-Castro, M. J. M. Alféreza, I. López-Aliagaa, T. Nestaresa, and M. S. Campos, “Effect of Calcium-Sup- plemented Goat or Cow Milk on Zinc Status in Rats with Nutritional Ferropenic Anaemia,” Internati onal Dairy Jour- nal, Vol. 19, No. 2, 2009, pp. 116-121. [11] B. Holland, A. Welch, I. D. Unwin, D. H. Buss, A. A. Paul and D. A. Southgate, “McCance and Widdowson’s: The Composition of Foods,” 5th Edition, Royal Society of Chemistry, Cambridge, 1992. [12] S. A. Jadayll, S. K Tukan and H. R. Takruri, “Bio- availability of Iron from Four Different Local Food Plants in Jordan,” Plant Foods for Human Nutrition, Vol. 54, No. 4, 1999, pp. 285-294. [13] A. M. Cadden, F. W. Sosulski and J. P. Olson, “Physio- logical Responses of Rats to High Fiber Bread Diets Containing Several Sources of Hulls or Bran,” Journal of Food Science, Vol. 48, No. 4, 1983, pp. 1151-1156. [14] P. G. Reeves, F. H. Nielsen and G. C. Fahey, Jr., “AIN-93 Purified Diets for Laboratory Rodents: Final Report of the American Institute of Nutrition Ad Hoc Writing Committee on the Reformulation of the AIN-76A Rodent Diet,” Journal of Nutrition, Vol. 123, No. 11, 1993, pp. 1939-1951. [15] AOAC, “Official Methods of Analysis,” 15th Edition, Association of Official Analysis Chemists, Washington, D.C., 1990. [16] R. Lee and D. Nieman, “Nutritronal Assessment,” 2nd Edition, McGraw-Hill Science/Engineering/Math, Mosby, 1996. [17] SAS, “Statistics Analysis System. SAS Users Guide: Statistics Version,” 5th Edition, SAS Institute Inc., Cary, 2000. [18] M. Brune, L. Rossander and L. Hallberg, “Iron Absorption and Phenolic Compounds: Importance of Different Phenolic Structures,” European Journal of Clinical Nutrition, Vol. 43, No. 8, 1989, pp. 547-558. [19] J. D. Cook, M. B. Reddy, J. Burry, M. A. Juillerat and R. F. Hurrell, “The Influence of Different Cereal Grains on Iron Absorption from Infant Cereal Foods,” American Journal of Clinical Nutrition, Vol. 65, No. 4, 1997, pp. 964-969. [20] M. Layrisse and M. N. Garcia-Casal, “Strategies for the Prevention of Iron Deficiency through Foods in the Household,” Nutrition Reviews, Vol. 55, No. 6, 1997, pp. 233-239. [21] J. D. Cook, V. Minnich, C. V. Moore, A. Rasmussen, W. B. Bradley and C. A. Finch, “Absorption of Fortification Iron in Bread,” American Journal of Clinical Nutrition, Vol. 26, No. 8, 1973, pp. 861-872. [22] L. S. Peng, H. Omar, A. S. Abdullah, R. Dahalan and M. Ismail, “The Effect of Calcium, Ascorbic Acid and Tannic Acid on Iron Availability from Arthrospira Platensis by Caco-2 Cell Model,” Malaysian Journal of Nutrition, Vol. 11, No. 2, 2005, pp. 177-188. [23] Z. K. Roughead, C. A. Zito and J. R. Hunt, “Inhibitory Effects of Dietary Calcium on the Initial Uptake and Subsequent Retention of Heme and Nonheme Iron in Humans: Comparisons Using an Intestinal Lavage Method,” American Journal of Clinical Nutrition, Vol. 82, No. 3, 2005, pp. 589-597. [24] M. J. M. Alférez, I. López-Aliaga, T. Nestares, J. Díaz- Castro, M. Barrionuevo and P. B. Ros, “Dietary Goat Milk Improves Iron Bioavailability in Rats with Induced Ferropenic Anaemia in Comparison with Cow Milk,” International Dairy Journal, Vol. 16, No. 7, 2006, pp. 813-821. Copyright © 2010 SciRes. FNS  Effect of Calcium and Phosphorus on Nonhaeme Iron Absorption and Haematogenic Characteristics in Rats Copyright © 2010 SciRes. FNS 18 [25] M. Hernández, V. Sousa, S. Villalpando, A. Moreno, I. Montalvo and M. Lόpez-Alarcόn, “Cooking and Fe Fortification Have Different Effects on Fe Bioavailability of Bread and Tortillas,” Journal of the American College of Nutrition, Vol. 25, No. 1, 2006, pp. 20-25. [26] P. Preziosi, S. Hercberg, P. Galan, M. Devanlay, F. Cherouvrier and H. Dupin, “Iron Status of a Healthy French Population: Factors Determining Biochemical Markers,” Annals of Nutrition and Metabolism, Vol. 38, No. 4, 1994, pp. 192-202. [27] L. P. Van de Vijver, A. F. Kardinaal and J. Charzewska, “Calcium Intake is Weakly but Consistently Negatively Associated with Iron Status in Girls and Women in Six European Countries,” Journal of Nutrition, Vol. 129, No. 5, 1999, pp. 963-968. [28] P. Galan, S. Hercberg, Y. Soustre, M. C. Dop and H. Dupin, “Factors Affecting Iron Stores in French Female Students,” Human Nutrition–Clinical Nutrition, Vol. 39, No. 4, 1985, pp. 279-287. [29] M. K. Abdel-Rahman, A. A. Anein and A. M. Hussien, “Effect of Iron-Food Intake on Anaemia Indices; Hae- moglobin, Iron and Ferritin among Childbearing Egyptian Females,” World Journal of Agricultural Sciences, Vol. 4, No. 1, 2008, pp. 7-12. [30] M. Hernández, V. Sousa, A. Moreno, S. Villapando and M. Lόpez-Alarcόn, “Iron Bioavailability and Utilization in Rats are Lower from Lime Treated Corn Flour than from Wheat Flour when they are Fortified with Different Sources of Iron,” Journal of Nutrition, Vol. 133, No. 1, 2003, pp. 154-159. |