

Paper Menu >>
Journal Menu >>
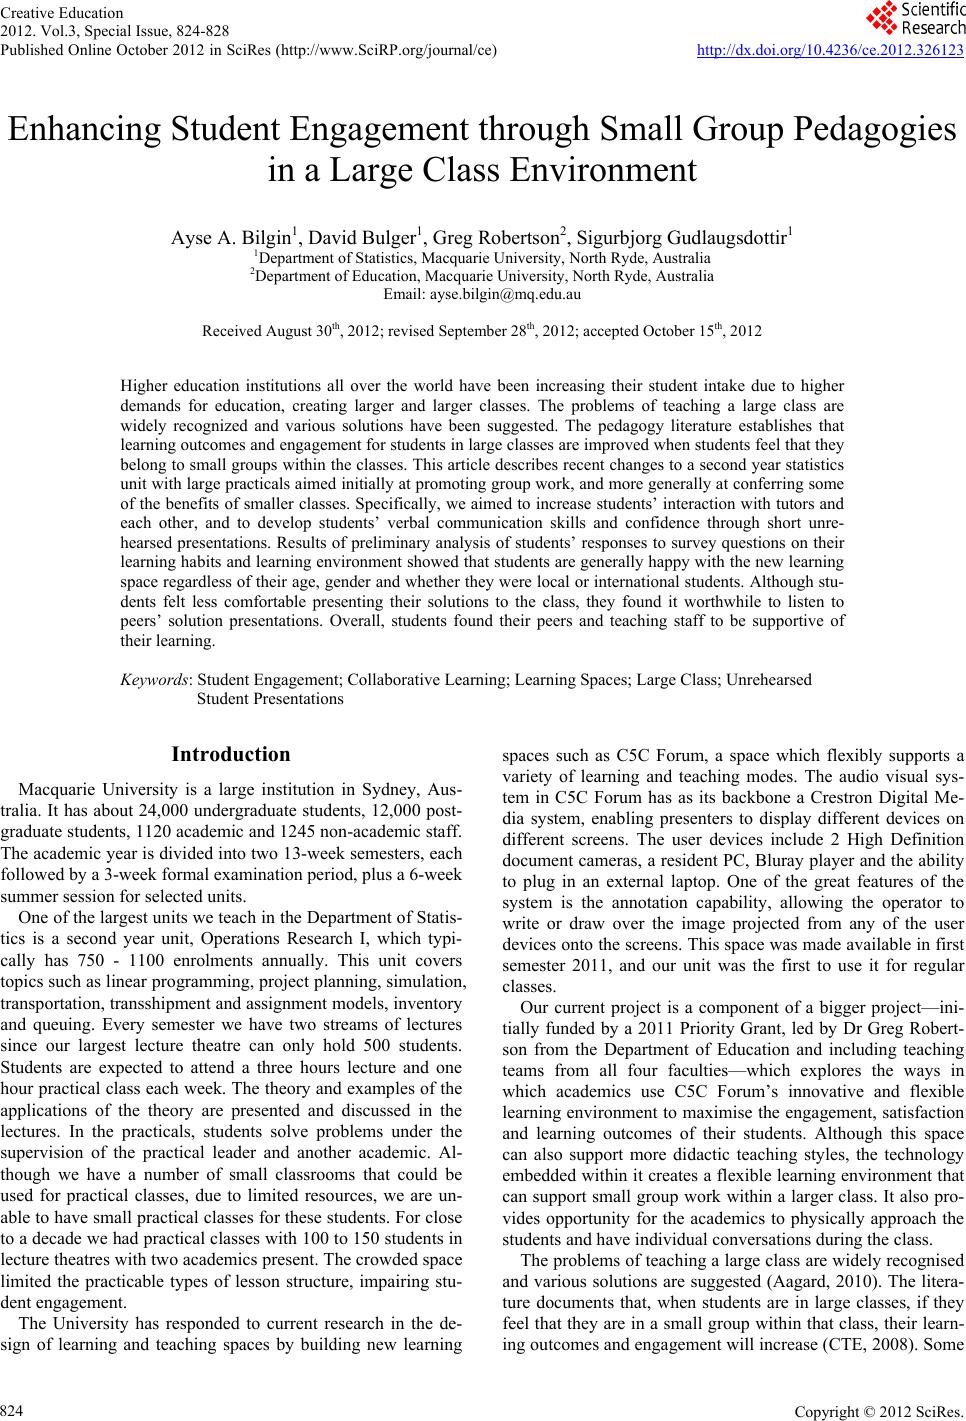 Creative Education 2012. Vol.3, Special Issue, 824-828 Published Online October 2012 in SciRes (http://www.SciRP.org/journal/ce) http://dx.doi.org/10.4236/ce.2012.326123 Copyright © 2012 SciRes. 824 Enhancing Student Engagement through Small Group Pedagogies in a Large Class Environment Ayse A. Bilgin1, David Bulger1, Greg Robertson2, Sigurbjorg Gudlaugsdottir1 1Department of Statistics, Macquarie University, North Ryde, Australia 2Department of Education, Macquarie University, North Ryde, Australia Email: [email protected] Received August 30th, 2012; revised September 28th, 2012; accepted October 15th, 2012 Higher education institutions all over the world have been increasing their student intake due to higher demands for education, creating larger and larger classes. The problems of teaching a large class are widely recognized and various solutions have been suggested. The pedagogy literature establishes that learning outcomes and engagement for students in large classes are improved when students feel that they belong to small groups within the classes. This article describes recent changes to a second year statistics unit with large practicals aimed initially at promoting group work, and more generally at conferring some of the benefits of smaller classes. Specifically, we aimed to increase students’ interaction with tutors and each other, and to develop students’ verbal communication skills and confidence through short unre- hearsed presentations. Results of preliminary analysis of students’ responses to survey questions on their learning habits and learning environment showed that students are generally happy with the new learning space regardless of their age, gender and whether they were local or international students. Although stu- dents felt less comfortable presenting their solutions to the class, they found it worthwhile to listen to peers’ solution presentations. Overall, students found their peers and teaching staff to be supportive of their learning. Keywords: Student Engagement; Collaborative Learning; Learning Spaces; Large Class; Unrehearsed Student Presentations Introduction Macquarie University is a large institution in Sydney, Aus- tralia. It has about 24,000 undergraduate students, 12,000 post- graduate students, 1120 academic and 1245 non-academic staff. The academic year is divided into two 13-week semesters, each followed by a 3-week formal examination period, plus a 6-week summer session for selected units. One of the largest units we teach in the Department of Statis- tics is a second year unit, Operations Research I, which typi- cally has 750 - 1100 enrolments annually. This unit covers topics such as linear programming, project planning, simulation, transportation, transshipment and assignment models, inventory and queuing. Every semester we have two streams of lectures since our largest lecture theatre can only hold 500 students. Students are expected to attend a three hours lecture and one hour practical class each week. The theory and examples of the applications of the theory are presented and discussed in the lectures. In the practicals, students solve problems under the supervision of the practical leader and another academic. Al- though we have a number of small classrooms that could be used for practical classes, due to limited resources, we are un- able to have small practical classes for these students. For close to a decade we had practical classes with 100 to 150 students in lecture theatres with two academics present. The crowded space limited the practicable types of lesson structure, impairing stu- dent engagement. The University has responded to current research in the de- sign of learning and teaching spaces by building new learning spaces such as C5C Forum, a space which flexibly supports a variety of learning and teaching modes. The audio visual sys- tem in C5C Forum has as its backbone a Crestron Digital Me- dia system, enabling presenters to display different devices on different screens. The user devices include 2 High Definition document cameras, a resident PC, Bluray player and the ability to plug in an external laptop. One of the great features of the system is the annotation capability, allowing the operator to write or draw over the image projected from any of the user devices onto the screens. This space was made available in first semester 2011, and our unit was the first to use it for regular classes. Our current project is a component of a bigger project—ini- tially funded by a 2011 Priority Grant, led by Dr Greg Robert- son from the Department of Education and including teaching teams from all four faculties—which explores the ways in which academics use C5C Forum’s innovative and flexible learning environment to maximise the engagement, satisfaction and learning outcomes of their students. Although this space can also support more didactic teaching styles, the technology embedded within it creates a flexible learning environment that can support small group work within a larger class. It also pro- vides opportunity for the academics to physically approach the students and have individual conversations during the class. The problems of teaching a large class are widely recognised and various solutions are suggested (Aagard, 2010). The litera- ture documents that, when students are in large classes, if they feel that they are in a small group within that class, their learn- ing outcomes and engagement will increase (CTE, 2008). Some 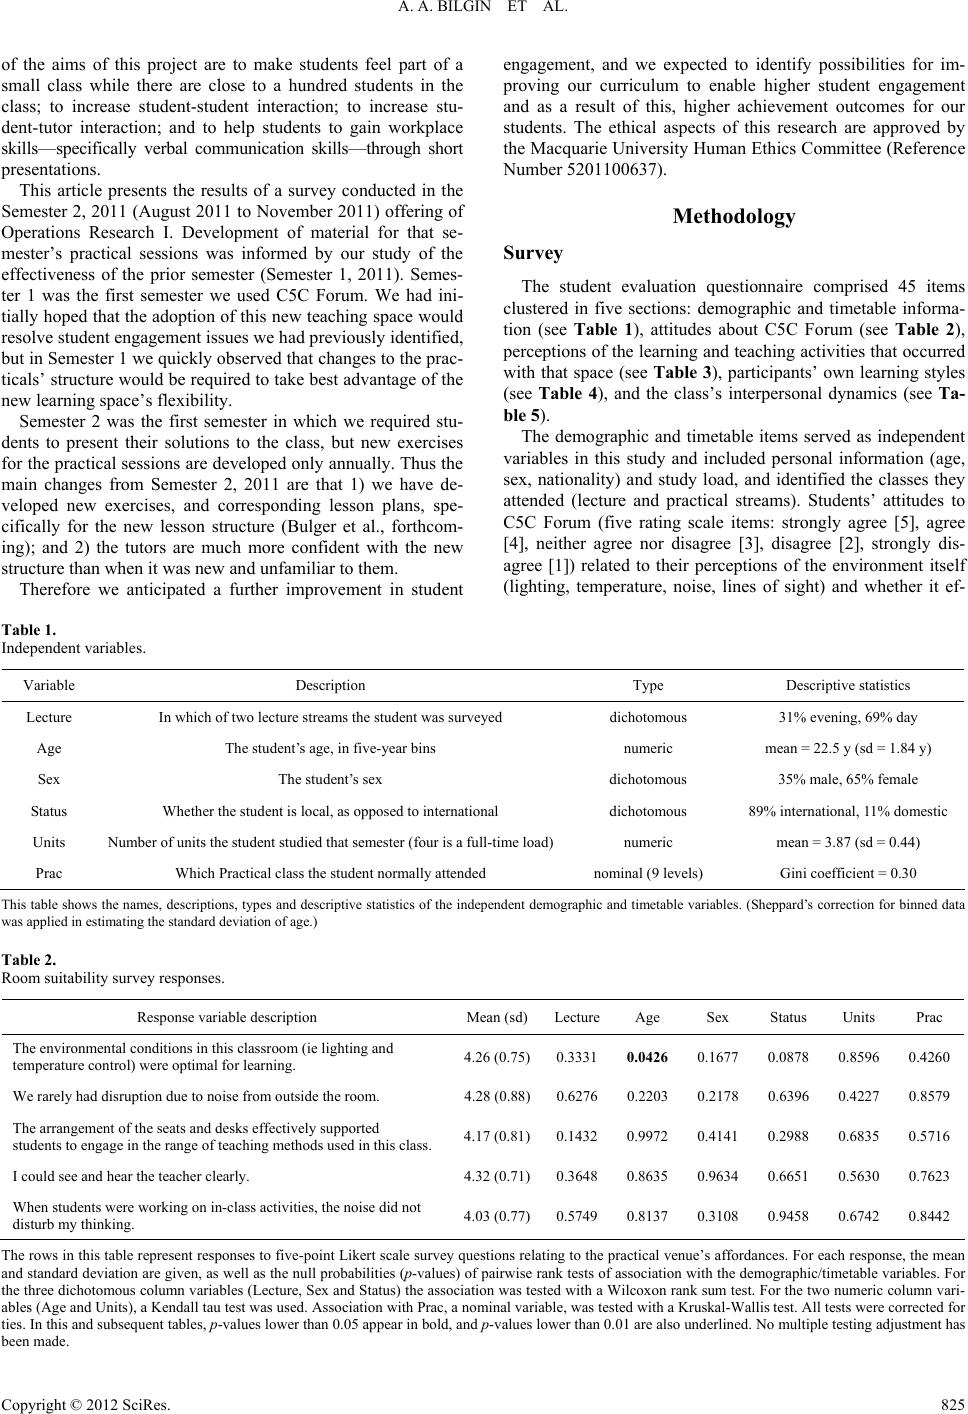 A. A. BILGIN ET AL. of the aims of this project are to make students feel part of a small class while there are close to a hundred students in the class; to increase student-student interaction; to increase stu- dent-tutor interaction; and to help students to gain workplace skills—specifically verbal communication skills—through short presentations. This article presents the results of a survey conducted in the Semester 2, 2011 (August 2011 to November 2011) offering of Operations Research I. Development of material for that se- mester’s practical sessions was informed by our study of the effectiveness of the prior semester (Semester 1, 2011). Semes- ter 1 was the first semester we used C5C Forum. We had ini- tially hoped that the adoption of this new teaching space would resolve student engagement issues we had previously identified, but in Semester 1 we quickly observed that changes to the prac- ticals’ structure would be required to take best advantage of the new learning space’s flexibility. Semester 2 was the first semester in which we required stu- dents to present their solutions to the class, but new exercises for the practical sessions are developed only annually. Thus the main changes from Semester 2, 2011 are that 1) we have de- veloped new exercises, and corresponding lesson plans, spe- cifically for the new lesson structure (Bulger et al., forthcom- ing); and 2) the tutors are much more confident with the new structure than when it was new and unfamiliar to them. Therefore we anticipated a further improvement in student engagement, and we expected to identify possibilities for im- proving our curriculum to enable higher student engagement and as a result of this, higher achievement outcomes for our students. The ethical aspects of this research are approved by the Macquarie University Human Ethics Committee (Reference Number 5201100637). Methodology Survey The student evaluation questionnaire comprised 45 items clustered in five sections: demographic and timetable informa- tion (see Table 1), attitudes about C5C Forum (see Table 2), perceptions of the learning and teaching activities that occurred with that space (see Table 3), participants’ own learning styles (see Table 4), and the class’s interpersonal dynamics (see Ta- ble 5). The demographic and timetable items served as independent variables in this study and included personal information (age, sex, nationality) and study load, and identified the classes they attended (lecture and practical streams). Students’ attitudes to C5C Forum (five rating scale items: strongly agree [5], agree [4], neither agree nor disagree [3], disagree [2], strongly dis- agree [1]) related to their perceptions of the environment itself (lighting, temperature, noise, lines of sight) and whether it ef- Table 1. Independent variables. Variable Description Type Descriptive statistics Lecture In which of two lecture streams the student was surveyed dichotomous 31% evening, 69% day Age The student’s age, in five-year bins numeric mean = 22.5 y (sd = 1.84 y) Sex The student’s sex dichotomous 35% male, 65% female Status Whether the student is local, as opposed to international dichotomous 89% international, 11% domestic Units Number of units the student studied that semester (four is a full-time load)numeric mean = 3.87 (sd = 0.44) Prac Which Practical class the student normally attended nominal (9 levels) Gini coefficient = 0.30 This table shows the names, descriptions, types and descriptive statistics of the independent demographic and timetable variables. (Sheppard’s correction for binned data was applied in estimating the standard deviation of age.) Table 2. Room suitability survey responses. Response variable description Mean (sd)LectureAge Sex Status Units Prac The environmental conditions in this classroom (ie lighting and temperature control) were optimal for learning. 4.26 (0.75)0.33310.0426 0.1677 0.0878 0.85960.4260 We rarely had disruption due to noise from outside the room. 4.28 (0.88)0.62760.22030.2178 0.6396 0.42270.8579 The arrangement of the seats and desks effectively supported students to engage in the range of teaching methods used in this class. 4.17 (0.81)0.14320.99720.4141 0.2988 0.68350.5716 I could see and hear the teacher clearly. 4.32 (0.71)0.36480.86350.9634 0.6651 0.56300.7623 When students were working on in-class activities, the noise did not disturb my thinking. 4.03 (0.77)0.57490.81370.3108 0.9458 0.67420.8442 The rows in this table represent responses to five-point Likert scale survey questions relating to the practical venue’s affordances. For each response, the mean and standard deviation are given, as well as the null probabilities (p-values) of pairwise rank tests of association with the demographic/timetable variables. For the three dichotomous column variables (Lecture, Sex and Status) the association was tested with a Wilcoxon rank sum test. For the two numeric column vari- ables (Age and Units), a Kendall tau test was used. Association with Prac, a nominal variable, was tested with a Kruskal-Wallis test. All tests were corrected for ties. In this and subsequent tables, p-values lower than 0.05 appear in bold, and p-values lower than 0.01 are also underlined. No multiple testing adjustment has been made. Copyright © 2012 SciRes. 825 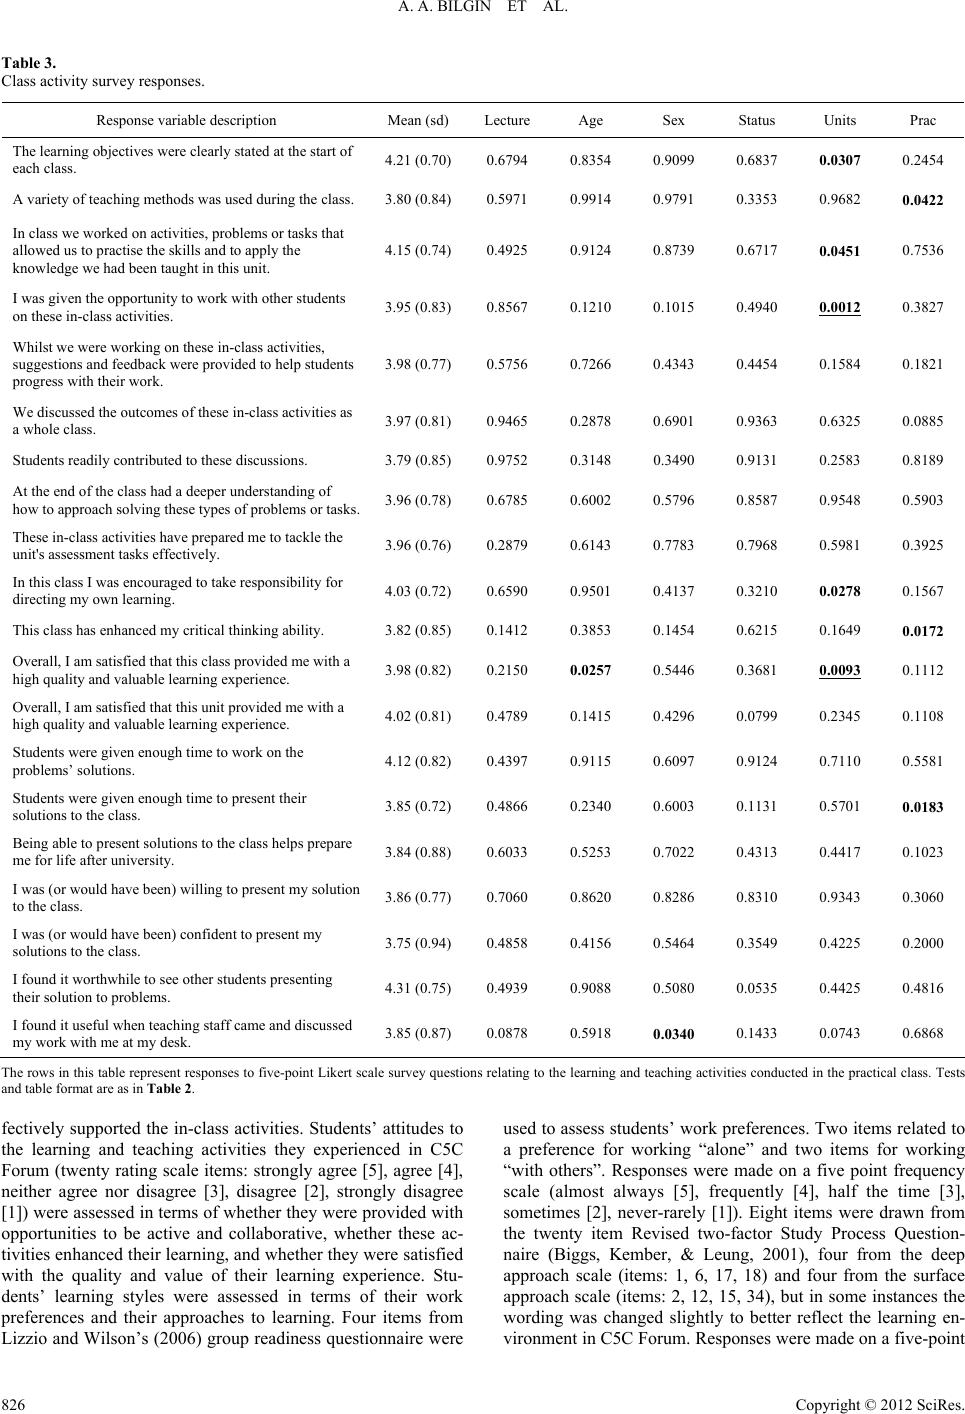 A. A. BILGIN ET AL. Table 3. Class activity survey responses. Response variable description Mean (sd) Lecture Age Sex Status Units Prac The learning objectives were clearly stated at the start of each class. 4.21 (0.70)0.6794 0.8354 0.9099 0.6837 0.0307 0.2454 A variety of teaching methods was used during the class. 3.80 (0.84)0.5971 0.9914 0.9791 0.3353 0.9682 0.0422 In class we worked on activities, problems or tasks that allowed us to practise the skills and to apply the knowledge we had been taught in this unit. 4.15 (0.74)0.4925 0.9124 0.8739 0.6717 0.0451 0.7536 I was given the opportunity to work with other students on these in-class activities. 3.95 (0.83)0.8567 0.1210 0.1015 0.4940 0.0012 0.3827 Whilst we were working on these in-class activities, suggestions and feedback were provided to help students progress with their work. 3.98 (0.77)0.5756 0.7266 0.4343 0.4454 0.1584 0.1821 We discussed the outcomes of these in-class activities as a whole class. 3.97 (0.81)0.9465 0.2878 0.6901 0.9363 0.6325 0.0885 Students readily contributed to these discussions. 3.79 (0.85)0.9752 0.3148 0.3490 0.9131 0.2583 0.8189 At the end of the class had a deeper understanding of how to approach solving these types of problems or tasks. 3.96 (0.78)0.6785 0.6002 0.5796 0.8587 0.9548 0.5903 These in-class activities have prepared me to tackle the unit's assessment tasks effectively. 3.96 (0.76)0.2879 0.6143 0.7783 0.7968 0.5981 0.3925 In this class I was encouraged to take responsibility for directing my own learning. 4.03 (0.72)0.6590 0.9501 0.4137 0.3210 0.0278 0.1567 This class has enhanced my critical thinking ability. 3.82 (0.85)0.1412 0.3853 0.1454 0.6215 0.1649 0.0172 Overall, I am satisfied that this class provided me with a high quality and valuable learning experience. 3.98 (0.82)0.2150 0.0257 0.5446 0.3681 0.0093 0.1112 Overall, I am satisfied that this unit provided me with a high quality and valuable learning experience. 4.02 (0.81)0.4789 0.1415 0.4296 0.0799 0.2345 0.1108 Students were given enough time to work on the problems’ solutions. 4.12 (0.82)0.4397 0.9115 0.6097 0.9124 0.7110 0.5581 Students were given enough time to present their solutions to the class. 3.85 (0.72)0.4866 0.2340 0.6003 0.1131 0.5701 0.0183 Being able to present solutions to the class helps prepare me for life after university. 3.84 (0.88)0.6033 0.5253 0.7022 0.4313 0.4417 0.1023 I was (or would have been) willing to present my solution to the class. 3.86 (0.77)0.7060 0.8620 0.8286 0.8310 0.9343 0.3060 I was (or would have been) confident to present my solutions to the class. 3.75 (0.94)0.4858 0.4156 0.5464 0.3549 0.4225 0.2000 I found it worthwhile to see other students presenting their solution to problems. 4.31 (0.75)0.4939 0.9088 0.5080 0.0535 0.4425 0.4816 I found it useful when teaching staff came and discussed my work with me at my desk. 3.85 (0.87)0.0878 0.5918 0.0340 0.1433 0.0743 0.6868 The rows in this table represent responses to five-point Likert scale survey questions relating to the learning and teaching activities conducted in the practical class. Tests and table format are as in Table 2. fectively supported the in-class activities. Students’ attitudes to the learning and teaching activities they experienced in C5C Forum (twenty rating scale items: strongly agree [5], agree [4], neither agree nor disagree [3], disagree [2], strongly disagree [1]) were assessed in terms of whether they were provided with opportunities to be active and collaborative, whether these ac- tivities enhanced their learning, and whether they were satisfied with the quality and value of their learning experience. Stu- dents’ learning styles were assessed in terms of their work preferences and their approaches to learning. Four items from Lizzio and Wilson’s (2006) group readiness questionnaire were used to assess students’ work preferences. Two items related to a preference for working “alone” and two items for working “with others”. Responses were made on a five point frequency scale (almost always [5], frequently [4], half the time [3], sometimes [2], never-rarely [1]). Eight items were drawn from the twenty item Revised two-factor Study Process Question- naire (Biggs, Kember, & Leung, 2001), four from the deep approach scale (items: 1, 6, 17, 18) and four from the surface approach scale (items: 2, 12, 15, 34), but in some instances the wording was changed slightly to better reflect the learning en- vironment in C5C Forum. Responses were made on a five-point Copyright © 2012 SciRes. 826 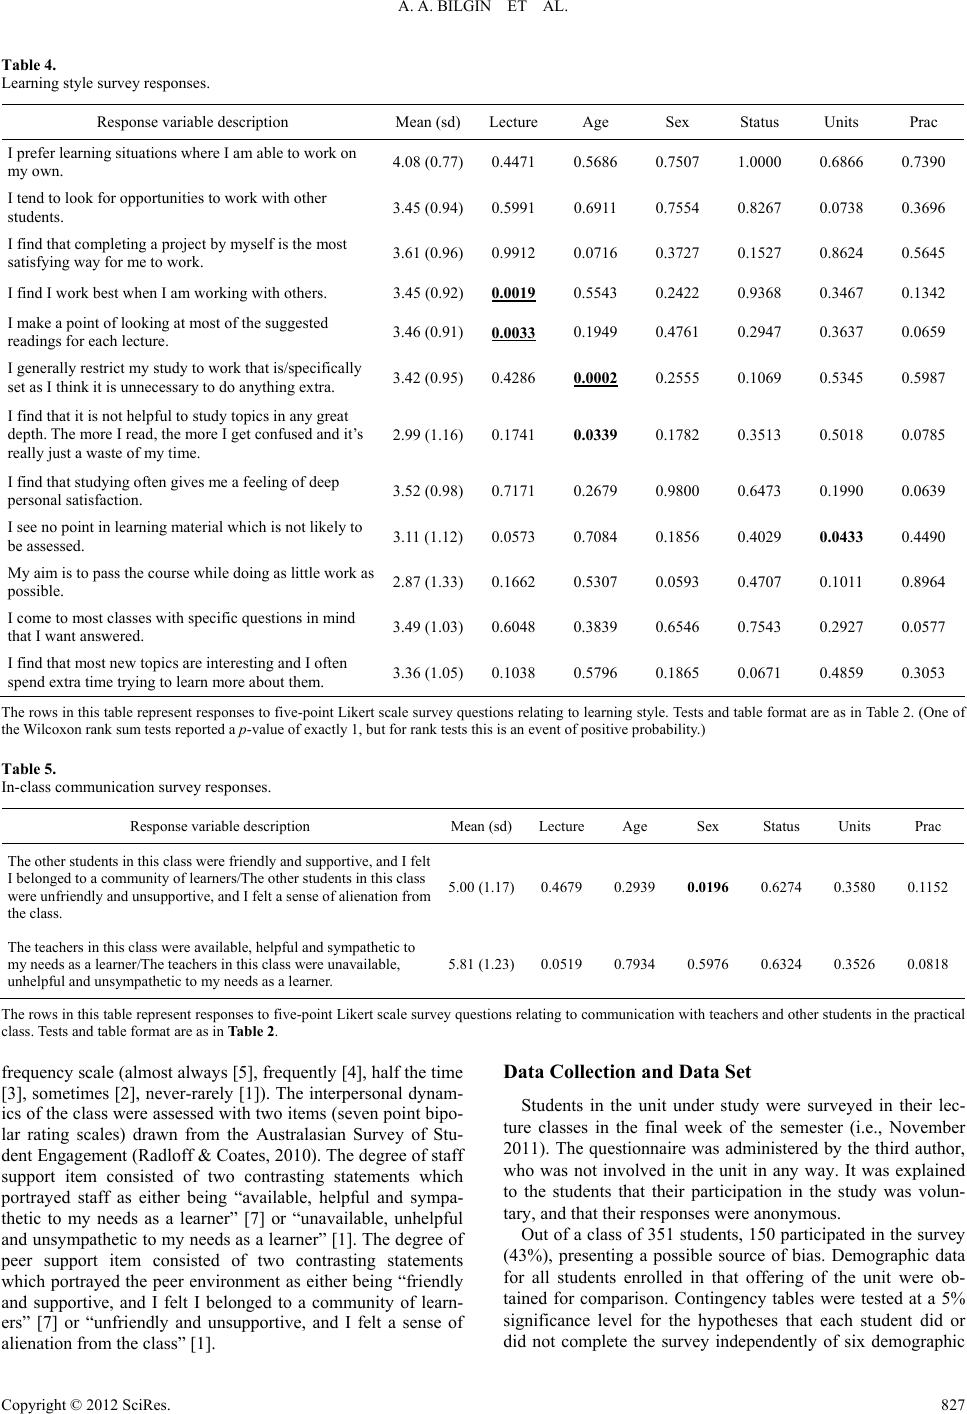 A. A. BILGIN ET AL. Table 4. Learning style survey responses. Response variable description Mean (sd)Lecture Age Sex Status Units Prac I prefer learning situations where I am able to work on my own. 4.08 (0.77)0.4471 0.5686 0.7507 1.0000 0.6866 0.7390 I tend to look for opportunities to work with other students. 3.45 (0.94)0.5991 0.6911 0.7554 0.8267 0.0738 0.3696 I find that completing a project by myself is the most satisfying way for me to work. 3.61 (0.96)0.9912 0.0716 0.3727 0.1527 0.8624 0.5645 I find I work best when I am working with others. 3.45 (0.92)0.0019 0.5543 0.2422 0.9368 0.3467 0.1342 I make a point of looking at most of the suggested readings for each lecture. 3.46 (0.91)0.0033 0.1949 0.4761 0.2947 0.3637 0.0659 I generally restrict my study to work that is/specifically set as I think it is unnecessary to do anything extra. 3.42 (0.95)0.4286 0.0002 0.2555 0.1069 0.5345 0.5987 I find that it is not helpful to study topics in any great depth. The more I read, the more I get confused and it’s really just a waste of my time. 2.99 (1.16)0.1741 0.0339 0.1782 0.3513 0.5018 0.0785 I find that studying often gives me a feeling of deep personal satisfaction. 3.52 (0.98)0.7171 0.2679 0.9800 0.6473 0.1990 0.0639 I see no point in learning material which is not likely to be assessed. 3.11 (1.12)0.0573 0.7084 0.1856 0.4029 0.0433 0.4490 My aim is to pass the course while doing as little work as possible. 2.87 (1.33)0.1662 0.5307 0.0593 0.4707 0.1011 0.8964 I come to most classes with specific questions in mind that I want answered. 3.49 (1.03)0.6048 0.3839 0.6546 0.7543 0.2927 0.0577 I find that most new topics are interesting and I often spend extra time trying to learn more about them. 3.36 (1.05)0.1038 0.5796 0.1865 0.0671 0.4859 0.3053 The rows in this table represent responses to five-point Likert scale survey questions relating to learning style. Tests and table format are as in Table 2. (One of the Wilcoxon rank sum tests reported a p-value of exactly 1, but for rank tests this is an event of positive probability.) Table 5. In-class communication survey responses. Response variable description Mean (sd)LectureAge Sex Status Units Prac The other students in this class were friendly and supportive, and I felt I belonged to a community of learners/The other students in this class were unfriendly and unsupportive, and I felt a sense of alienation from the class. 5.00 (1.17)0.4679 0.2939 0.0196 0.6274 0.3580 0.1152 The teachers in this class were available, helpful and sympathetic to my needs as a learner/The teachers in this class were unavailable, unhelpful and unsympathetic to my needs as a learner. 5.81 (1.23)0.0519 0.7934 0.5976 0.6324 0.3526 0.0818 The rows in this table represent responses to five-point Likert scale survey questions relating to communication with teachers and other students in the practical class. Tests and table format are as in Table 2. frequency scale (almost always [5], frequently [4], half the time [3], sometimes [2], never-rarely [1]). The interpersonal dynam- ics of the class were assessed with two items (seven point bipo- lar rating scales) drawn from the Australasian Survey of Stu- dent Engagement (Radloff & Coates, 2010). The degree of staff support item consisted of two contrasting statements which portrayed staff as either being “available, helpful and sympa- thetic to my needs as a learner” [7] or “unavailable, unhelpful and unsympathetic to my needs as a learner” [1]. The degree of peer support item consisted of two contrasting statements which portrayed the peer environment as either being “friendly and supportive, and I felt I belonged to a community of learn- ers” [7] or “unfriendly and unsupportive, and I felt a sense of alienation from the class” [1]. Data Collection and Data Set Students in the unit under study were surveyed in their lec- ture classes in the final week of the semester (i.e., November 2011). The questionnaire was administered by the third author, who was not involved in the unit in any way. It was explained to the students that their participation in the study was volun- tary, and that their responses were anonymous. Out of a class of 351 students, 150 participated in the survey (43%), presenting a possible source of bias. Demographic data for all students enrolled in that offering of the unit were ob- tained for comparison. Contingency tables were tested at a 5% significance level for the hypotheses that each student did or did not complete the survey independently of six demographic Copyright © 2012 SciRes. 827  A. A. BILGIN ET AL. variables: age, sex, international/domestic status, whether Eng- lish is the main language spoken at home, part-time/full-time status, and the faculty of enrolment. Categorical variables overwhelmingly taking a single value were removed from consideration. The collected surveys had very little missing data (1.7% of fields). The items in the data set are presented in Tables 1-5: Table 1 describes the demographic and timetable variables, and Tables 2-4 describe Likert scale variables measuring students’ attitudes to the space, the learning and teaching activities, their own learning style, and the class’s interpersonal dynamics, respectively. Statistics and Data Analysis The statistical analysis was done in R (R Development Core Team 2012) using the coin package (Conditional Inference Procedures in a Permutation Test Framework) and the built-in stats package. Descriptive statistics (mean and standard devia- tion) for all variables are presented. Associations between demographic/timetable variables and Likert responses were tested at 5% and 1% significance levels, using rank tests: the Wilcoxon rank sum test for dichotomous—ordinal associations, the Kendall tau test for ordinal—ordinal associations and the Kruskal-Wallis test for nominal—ordinal associations. Results Demographic groups found to be significantly overrepre- sented in the survey sample were women (65.3% of respon- dents but 54.4% of the class), students who spoke English at home (10.0% of respondents but 3.7% of the class) and part-time students (2.7% of respondents but 0.3% of the class). In fact, more students claimed on the survey to speak English at home and to be part-time students than were counted in those categories in the enrolment database, suggesting varying inter- pretations. These two variables, whether English is spoken at home and full-time/part-time status, were both omitted from subsequent analysis, along with faculty of enrolment, because in each case, in either the class or the sample or both, one value was overwhelmingly popular. The sex bias is substantial but tolerable. Table 2 shows that students generally considered the room (C5C Forum) a suitable learning environment, with no very significant (p < 0.01) demographic or timetable trends. Table 3 shows an overall positive response to the teaching and learning activities. Interestingly, in this group, students most often agreed that they found it worthwhile to see other students presenting their solutions to problems, but least often feltconfident themselves to present solutions to the class. There were two very significant associations: students with a heavier course load showed a greater tendency to agree that they were given an opportunity to work with other students on in-class activities, and to be satisfied that the class provided a high quality and valuable learning experience. Table 3 also shows that a student’s timetabled practical class was significantly (0.01 ≤ p < 0.05) associated with the percep- tion that a variety of teaching methods were used, that the class enhanced critical thinking ability, and that students were given enough time to present their solutions to the class. Table 4 gauged students’ learning styles. There were three very significant associations, with older students more likely to estrict their study to set work, and students in the evening lec- tures more likely to look at the suggested readings and to find working with others productive. r Table 5 shows that, overall, students found each other and, especially, the teaching staff to be supportive and available. Women found other students friendly and supportive (mean 5.21) significantly more than men did (mean = 4.61). Conclusion and Discussion Overall the results of this survey support the innovations we have made to the location and structure of the practical classes. The very significant associations in Table 4 are consistent with our prior impression that older students and employed students (who tend to be the ones in evening lectures) have more focused and strategic study habits. We have no control over the demographic variables, so the associations most relevant to the refinement of our teaching practice were those involving which practical class a student attended. We found that the practical sessions varied in effect- tive time management, in enhancement of critical thinking, and in students’ perception of a variety of teaching methods. This accorded with our finding, in observing the practical sessions that the various tutors took quite different approaches to run- ning the sessions, and that some were more skilled than others at running the sessions to a workable schedule. We have, of course, no wish to stamp out the personality of any of our tutors, but more consistency seemed desirable, and the quantitative and qualitative data collected from this study led us to develop prescriptive lesson plans, outlining each prac- tical session’s learning objectives and a timetabled sequence of activities. This is an ongoing study, and the results of this re- finement will be reported in a future publication. Acknowledgements This project is funded through the Innovation and Scholar- ship Program, Faculty of Science Learning and Teaching Grants Scheme at Macquarie University. The authors also wish to express their appreciation to Dr Nino Kordzhakhia, Ms Bala Pasupathy, Mr Anthony Lam, Mr Darren Johnson,Mr Ademir Hajdarpasic , and Mr Grant Adams. REFERENCES Aagard, H., Bowen, K., & Olesova, L. (2010). Hotseat: Opening the Backchannel in Large Lectures. Educause Quarterly, 33, 3. Biggs, J., Kember, D., & Leung, D. Y. (2001). The revised two-factor study process questionnaire: R-SPQ-2F. British Journal of Educa- tional Psychology, 71, 133-149. doi:10.1348/000709901158433 Bulger, D., Bilgin, A., Robertson, G., & Gudlaugsdottir, S. (Forthcom- ing). Consistency of the repeat practical session for a large unit. [De- tails to come]. Center for Teaching Excellence (CTE), University of Maryland. (2008). Large classes: A teaching guide: Personalizing the large class. http://www.cte.umd.edu/library/teachingLargeClass/guide/ch4.html Lizzio, A., & Wilson, K. (2006). Enhancing the effectiveness of self- managed learning groups: Understanding students’ choices and con- cerns. Studies in Higher Education, 31, 689-703. doi:10.1080/03075070601004309 R Development Core Team (2012). An introduction to R, version 2.15.1 R foundation for statistical computing. URL (last checked 29 August 2012). http://cran.r-project.org/ Radloff, A., & Coates, H. (2010). Doing more for learning: Enhancing engagement and outcomes: Australasian survey of student engage- ment: Australasian student engagement report. Camberwell, VIC: Australian Council for Educational Research. Copyright © 2012 SciRes. 828 |