

Paper Menu >>
Journal Menu >>
 Journal of Surface Engineered Materials and Advanced Technology, 2012, 2, 292-294 http://dx.doi.org/10.4236/jsemat.2012.24044 Published Online October 2012 (http://www.SciRP.org/journal/jsemat) Plastic Waste Management by Substituting Natural Fibres Surabhi Srivastava Department of Civil Engineering, Bahra University, Shimla Hills, Himachal Pradesh, India. Email: [email protected] Received December 31st, 2011; revised February 1st, 2012; accepted February 11th, 2012 ABSTRACT This paper presents substitute for non-biodegradable plastic packed material which comes as a part of municipal solid waste and becoming global problem due to its overuse. The plastic as packaging material has its advantages but also have more disadvantages because of its durability that it does not degraded. If the packaging material is made up of natural fibres it has more effect on local ecosystem. This paper provides the solution that use of natural fibres as pack- aging due to its light weight, high strength to weight ratio, corrosion resistance and other advantages are useful for the industry as well as commercially availability for the markets. Keywords: Solid Waste; Biodegradable; Non-Biodegradable; Plastic; Natural Fibres 1. Introduction In developing countries of the world, plastic waste has become a current challenge for the environmental engi- neers to solve. For an example developing country like India, statistics show that the exponential growth rate of India with 1,210,000,000 (1.21 billion) people is the second most populous country in the world, while China is on the top with over 1,350,044,605 (1.35 billion) peo- ple. The figures show that India represents almost 17.31% of the world's population, which means one out of six people on this planet live in India. Although, the crown of the world's most populous country is on China’s head for decades, India is all set to take the numerous positions by 2030. With the population growth rate at 1.58%, India is predicted to have more than 1.53 billion people by the end of 2030. Being second most populous country in the wor ld, India continuously k eeps on adding waste material within its geographical boundaries. India has about 16% of the world population and 2.5% of world’s land area. In an already densely populated coun- try with even more densely packed urban centers, land for proper waste treatment, disposal and overall man- agement is scarce. Recent and sustained economic growth increasing living standards of the people, in- creased manufacturing and production activities has led to increased to rapid rise in the waste generation rated [1]. India produces around 42 Million tons of solid waste annually. There is wide difference in the waste genera- tion rates in rural and urban areas. Even within the urban areas, the composition includes more paper and inert material and less of organic and compostable material as the city population and size increases. The per capita ge n- eration rate increases and the overall calorific value of the waste drops with increase in the size of the city (Study by NEE RI). Now with the above data we can calculate the per day generation of solid waste of India & also we can calcu- late the expected cost for its management which can be done by the processes minimization, recycling & dis- posal of the solid waste generated. These processes have been adopted by the most developed countries as the menu for developing solid waste management strategies [2,3]. Depending upon a number of factors such as to- pography climate [4], population density (village to metro city), transportation infrastructure, socioeconomic and environmental laws of India it is important to make proper pre action plan to manage solid waste. 2. Composition of Municipal Solid Waste in India The biodegradable portion dominates the bulk of Mu- nicipal Solid Waste. Generally the biod egradable portion is mainly due to food and yard waste. With rising ur- banization and change in lifestyle and food habits, the amount of municipal solid waste has been increasing rapidly and its composition changing. Figure 1 repre- sents Pie chart for the various category of waste gener- ated. There are different categories of waste generated, each take their own time to degenerate (as illustrated in the Table 1 [5]). 3. Method of Data Collection There is a manual method of data collection [6,7], which will be important whi le designing a t ool or waste treatment Copyright © 2012 SciRes. JSEMAT 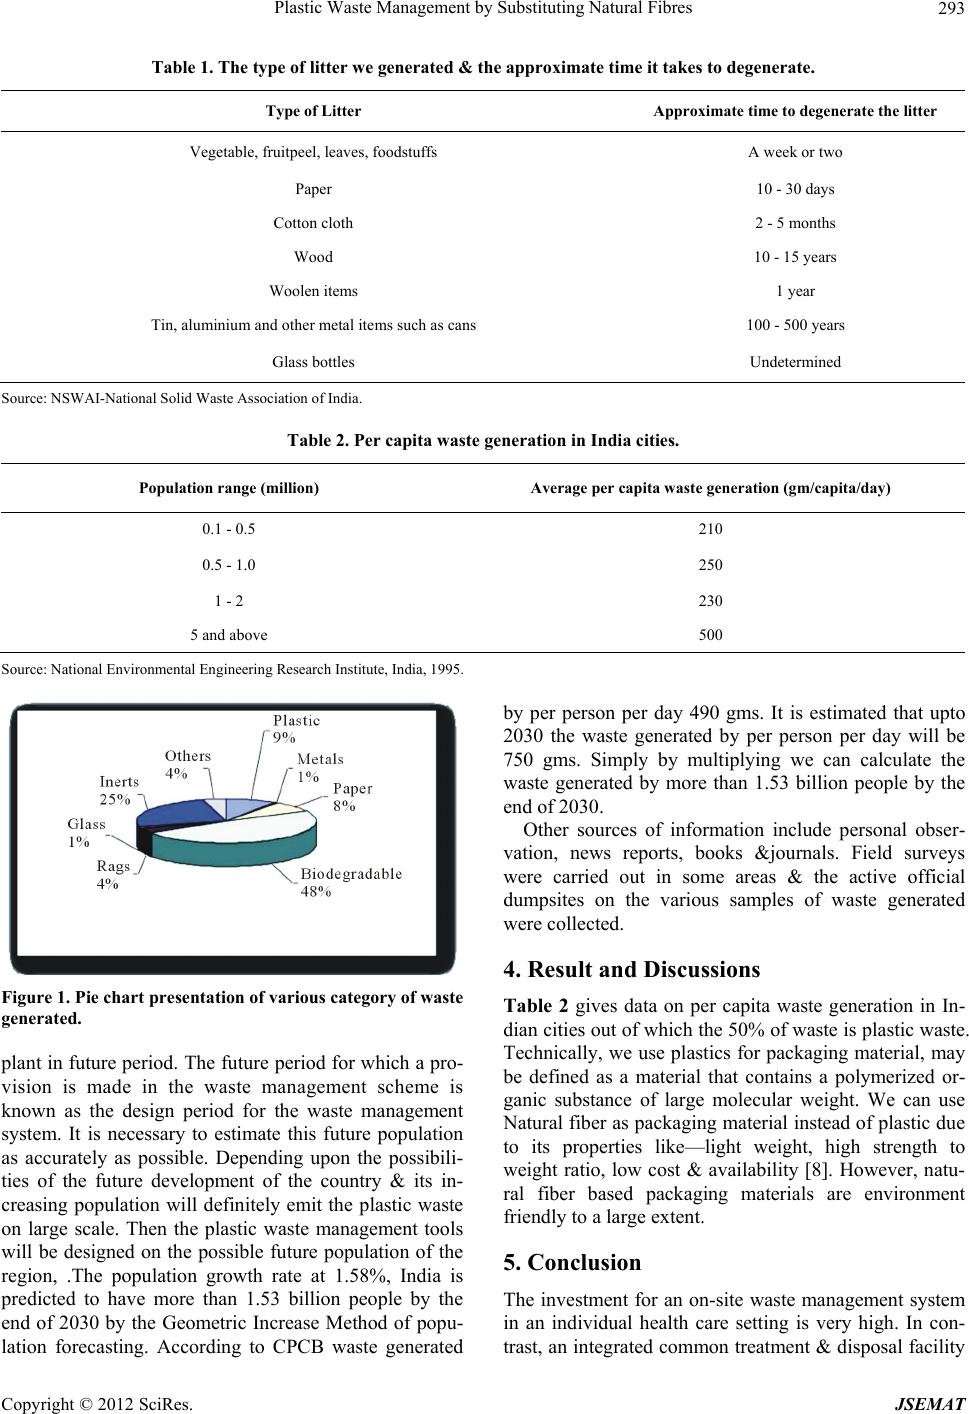 Plastic Waste Management by Substituting Natural Fibres 293 Table 1. The type of litter we generated & the approximate time it takes to degenerate. Type of Litter Approximate time to degenerate the litter Vegetable, fruitpeel, leaves, foodstuffs A week or two Paper 10 - 30 days Cotton cloth 2 - 5 months Wood 10 - 15 years Woolen items 1 year Tin, aluminium and other metal items such as cans 100 - 500 years Glass bottles Undetermined Source: NSWAI-National Solid Waste Association of India. Table 2. Per capita waste generation in India cities. Population range (million) Average per capita waste generation (gm/capita/day) 0.1 - 0.5 210 0.5 - 1.0 250 1 - 2 230 5 and above 500 Source: National Environm ental Engineering Research Institute, India, 1995. Figure 1. Pie chart presentation of various category of waste generated. plant in future period. The future period for which a pro- vision is made in the waste management scheme is known as the design period for the waste management system. It is necessary to estimate this future population as accurately as possible. Depending upon the possibili- ties of the future development of the country & its in- creasing population will definitely emit the plastic waste on large scale. Then the plastic waste management tools will be designed on the possible future population of the region, .The population growth rate at 1.58%, India is predicted to have more than 1.53 billion people by the end of 2030 by the Geometric Increase Method of popu- lation forecasting. According to CPCB waste generated by per person per day 490 gms. It is estimated that upto 2030 the waste generated by per person per day will be 750 gms. Simply by multiplying we can calculate the waste generated by more than 1.53 billion people by the end of 2030. Other sources of information include personal obser- vation, news reports, books &journals. Field surveys were carried out in some areas & the active official dumpsites on the various samples of waste generated were collected. 4. Result and Discussions Table 2 gives data on per capita waste generation in In- dian cities out of which the 50% of waste is plastic waste. Technically, we use plastics for packaging material, may be defined as a material that contains a polymerized or- ganic substance of large molecular weight. We can use Natural fiber as packaging material instead of plastic due to its properties like—light weight, high strength to weight ratio, low cost & availability [8]. However, natu- ral fiber based packaging materials are environment friendly to a large exten t. 5. Conclusion The investment for an on-site waste management system in an individual health care setting is very high. In con- trast, an integrated common treatment & disposal facility Copyright © 2012 SciRes. JSEMAT  Plastic Waste Management by Substituting Natural Fibres 294 cost a maximum of Rs. 3 to 15/kg/day with an added benefit of no capital investment being required. The company could have profit about 35% making it a sus- tainable venture if they use natural fibres as packaging material instead of plastic [4]. The natural fibres are en- vironmentally sound it will also give good market cost to the farmers REFERENCES [1] F. Ackerman, “Wa ste Management and Climate Change,” Local Environment, Vol. 5, No. 2, 2000, pp. 223-229. doi:10.1080/13549830050009373 [2] N. Berge, D. Reinhart and T. Town send, “A Review of the Fate of Nitrogen in Bioreactor Landfills,” Critical Re- views in Environmental Science and Technology, Vol. 35, No. 4, 2005, pp. 365-399. doi:10.1080/10643380590945003 [3] B. Bockreis and I. Steinberg, “Influence of Mechanical- Biological Waste Pre-Treatment Methods on Gas Forma- tion in Landfills,” Waste Management, Vol. 25, No. 4, 2005, pp. 337-343. doi:10.1016/j.wasman.2005.02.004 [4] D. De Jager and K. Blok, “Cost-Effectiveness of Emis- sion-Reduction Measures for CH4 in the Netherlands,” Energy Conservation Manage ment, Vol. 37, No. 6 -8, 1996, pp. 1181-1186. doi:10.1016/0196-8904(95)00317-7 [5] L. F. Diaz, A. Chiumenti, G. Savage and L. Eggerth, “Managing the Organic Fraction of Municipal Solid Waste,” Biocycle, Vol. 47, No. 10, 2006, pp. 50-53. [6] R. R. Jenkins, S. A. Martinez, K. Palmer and M. J. Podol- sky, “The Determinants of Household Recycling: A Ma- terial-Specific Analysis of Recycling Program Features and Unit Pricing,” Journal of Environmental Economics and Management, Vol. 45, No. 2, 2003, pp. 294-318. doi:10.1016/S0095-0696(02)00054-2 [7] Swedish Environmental Protection Agency, “A Strategy for Sustainable Waste Management: Sweden’s Waste Plan,” Swedish Environmental Protection Agency, Stock- holm, 2005, p. 54. [8] US Environmental Protection Agency, “Municipal Solid Waste Generation, Recycling and Disposal in the United States: Facts and Figures for 2003,” US Environmental Protection Agency, Washington DC, 2005. Copyright © 2012 SciRes. JSEMAT |