

Paper Menu >>
Journal Menu >>
 Materials Sciences and Applications, 2012, 3, 739-744 http://dx.doi.org/10.4236/msa.2012.310108 Published Online October 2012 (http://www.SciRP.org/journal/msa) Method of Crack Formation Analysis Based on Mechanoluminecence Sergej Aman, Alexander Aman, Juergen Tomas Mechanical Process Engineering, Otto-von-Guericke University Magdeburg, Magdeburg, Germany. Email: [email protected] Received July 24th, 2012; revised August 21st, 2012; accepted September 23rd, 2012 ABSTRACT This paper presents the method of monitoring of cracks formation based on analysis of light impulses that appear during the cracks formation. The light impulses appear simultaneously in the ultraviolet (UV) and near-infrared (NIR) wave- length ranges. However, during the plastic deformation, where the building of micro cracks with narrow width is domi- nant, the light appears frequently in the UV-wavelength range. With the cracks growth the width become wide-ranging and the spectrum of light shifts to the NIR-waveleng th range. This spectral shift was used to estimate the stage of cracks formation as degree of damage. The fracture of tested material can be predic t ed based on estima te d degree of da mage. Keywords: Crack; Light Impulses; Fracture; Spectral Shift 1. Introduction The fracture of materials by repeated loading can be di- vided in two stages: crack initiation and crack propaga- tion [1]. This arrangement assumes that an intensive generation of single micro cracks takes place during the first stage—crack initiation. By repeated stressing the crack initiation takes a major part of the total stressing time [1-5]. The second stage—crack propagation occurs when the concentration of small single micro cracks at- tains a critical degree and micro cracks coalesce together to form larger cracks. In this phase the cracks width be- come wide-ranging. The future intensive stressing leads to the formation of a macroscopic crack and to fragmen- tation. The most important and difficult problem in frac- ture mechanics seems to be the use of crack initiation data in predicting of the remaining useful life time of machinery components. This problem is of great impor- tance for safety and reliability of machinery and plants. A number of models of fatigue damage evolution have been developed to predict the remaining useful life time [1-3]. However, it is difficult to predict exactly remain- ing useful life based only on fracture models due to the inherent stochastic nature of cracks. Gupta et al. [4,5] have shown that the small defects in- side the material surface can be detected with ultrasonic signals. This method performs the monitoring of micro cracks during the early stages of fatigue damage on po- lycrystalline alloys. There are a number of methods of fracture analyses based on fracto-emission during the cracks formation [6-9]. The fracto-emission included the emission of elec- trons, ions, ground state neutral particles, free radicals, electromagnetic radiation in the frequency range from tenths of Hz up to X-ray frequencies [5-9]. In this paper, the light emission which appears during the loading of specimens (mechanoluminescence) will be used to estimate of degree of cracks formation. Mecha- noluminescence (ML) is a widely spread phenomenon that is often described in the literature [6,7,10]. Nearly 50% of all inorganic salts and organic molecular solids exhibit mechanoluminescence [7]. Accordin g to Chandra [7], there is to distinguish between plastic and fracture ML. The first one occurs during the plastic deformation due to generation of microcracks and the second one oc- curs during the fragmentation . The fundamental scientific aspect is the subject of common investigation of ML. However, a practical ap- plication of ML in process engineering and in visualiza- tion of cracks development seems to be successful. In mechanical process engineering, the ML is used to con- trol grinding processes [11,12]. A direct monitoring of crack initiation during plastic deformation is useful to predict material fracture [13]. The generally accepted mechanism ML is based on the micro discharges occurring during the crack opening. During the initiation and propagation of cracks the elec- tric charges at the fresh created crack surfaces were pro- duced. If the charge density i.e. electrical field in crack opening reaches a critical value, the series of micro dis- Copyright © 2012 SciRes. MSA 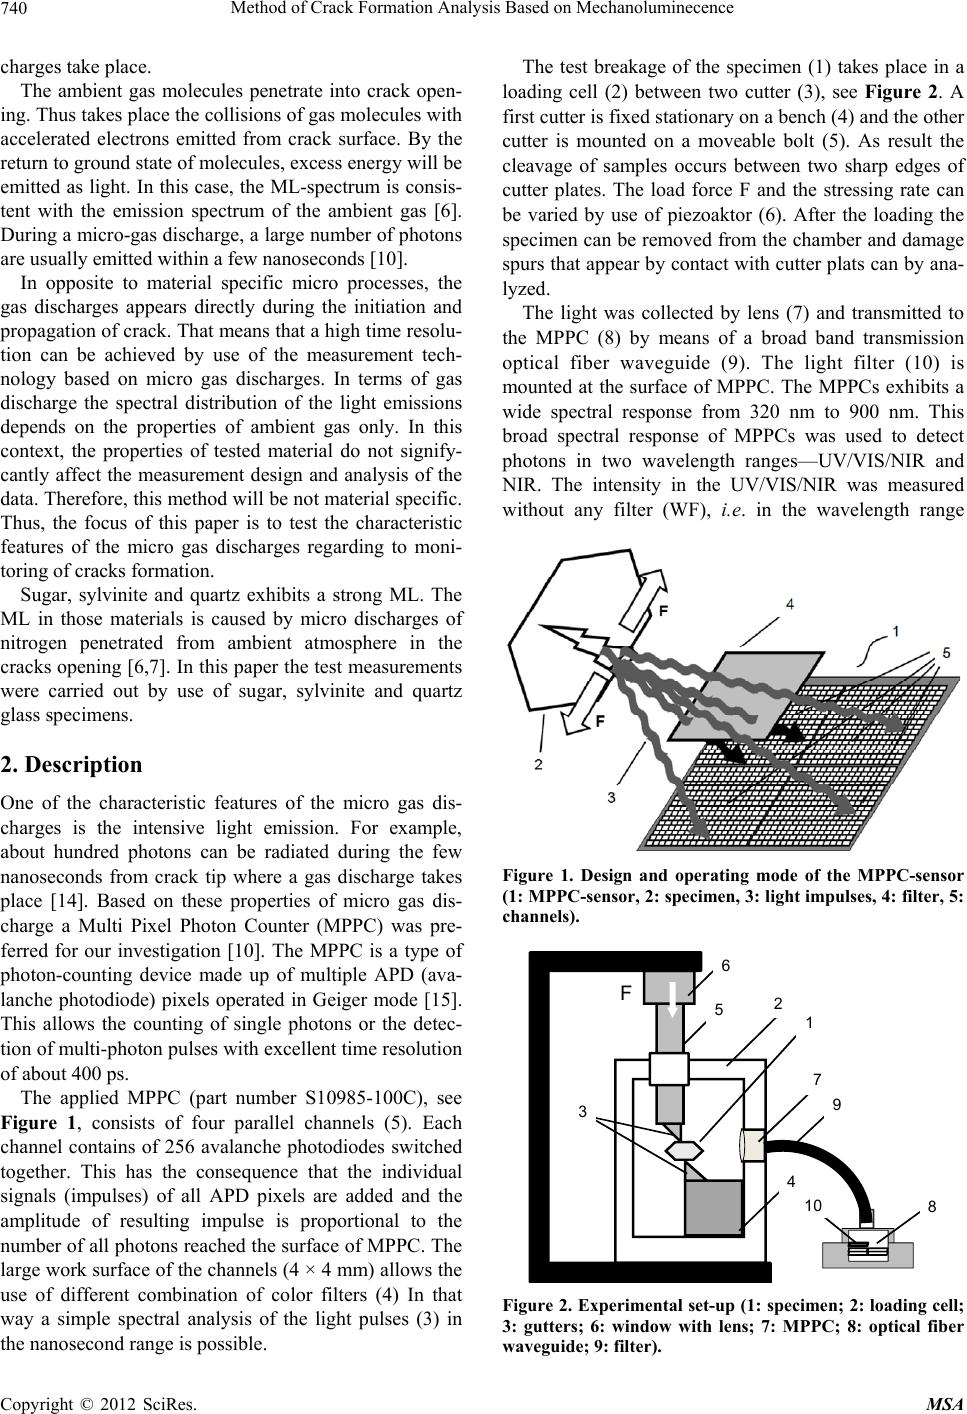 Method of Crack Formation Analysis Based on Mechanoluminecence 740 charges take place. The ambient gas molecules penetrate into crack open- ing. Thus takes place the collisions of gas molecules with accelerated electrons emitted from crack surface. By the return to ground state of molecules, excess energy will be emitted as light. In this case, the ML-spectrum is consis- tent with the emission spectrum of the ambient gas [6]. During a micro-gas discharge, a large number of photons are usually emitted within a few nanoseconds [10]. In opposite to material specific micro processes, the gas discharges appears directly during the initiation and propagation of crack. That means that a high time resolu- tion can be achieved by use of the measurement tech- nology based on micro gas discharges. In terms of gas discharge the spectral distribution of the light emissions depends on the properties of ambient gas only. In this context, the properties of tested material do not signify- cantly affect the measurement design and analysis of the data. Therefore, this method will be not material specific. Thus, the focus of this paper is to test the characteristic features of the micro gas discharges regarding to moni- toring of cracks formation. Sugar, sylvinite and quartz exhibits a strong ML. The ML in those materials is caused by micro discharges of nitrogen penetrated from ambient atmosphere in the cracks opening [6,7]. In this paper the test measurements were carried out by use of sugar, sylvinite and quartz glass specimens. 2. Description One of the characteristic features of the micro gas dis- charges is the intensive light emission. For example, about hundred photons can be radiated during the few nanoseconds from crack tip where a gas discharge takes place [14]. Based on these properties of micro gas dis- charge a Multi Pixel Photon Counter (MPPC) was pre- ferred for our investigation [10]. The MPPC is a type of photon-counting device made up of multiple APD (ava- lanche photodiode) pixels operated in Geiger mode [15]. This allows the counting of single photons or the detec- tion of multi-photon pulses with excellent time resolutio n of about 400 ps. The applied MPPC (part number S10985-100C), see Figure 1, consists of four parallel channels (5). Each channel contains of 256 avalanche photodiodes switched together. This has the consequence that the individual signals (impulses) of all APD pixels are added and the amplitude of resulting impulse is proportional to the number of all photons reached the surface of MPPC. The large work surface of the channels (4 × 4 mm) allows the use of different combination of color filters (4) In that way a simple spectral analysis of the light pulses (3) in the nanosecond range is possible. The test breakage of the specimen (1) takes place in a loading cell (2) between two cutter (3), see Figure 2. A first cutter is fixed stationary on a bench (4) and the other cutter is mounted on a moveable bolt (5). As result the cleavage of samples occurs between two sharp edges of cutter plates. The load force F and the stressing rate can be varied by use of piezoaktor (6). After the loading the specimen can be removed from the chamber and damage spurs that appear by contact with cutter plats can by ana- lyzed. The light was collected by lens (7) and transmitted to the MPPC (8) by means of a broad band transmission optical fiber waveguide (9). The light filter (10) is mounted at the surface of MPPC. The MPPCs exhibits a wide spectral response from 320 nm to 900 nm. This broad spectral response of MPPCs was used to detect photons in two wavelength ranges—UV/VIS/NIR and NIR. The intensity in the UV/VIS/NIR was measured without any filter (WF), i.e. in the wavelength range Figure 1. Design and operating mode of the MPPC-sensor (1: MPPC-sensor, 2: specimen, 3: light impulses, 4: filter, 5: channels). 51 7 9 8 2 3 4 10 F 6 Figure 2. Experimental set-up (1: specimen; 2: loading cell; 3: gutters; 6: window with lens; 7: MPPC; 8: optical fiber waveguide; 9: filter). Copyright © 2012 SciRes. MSA 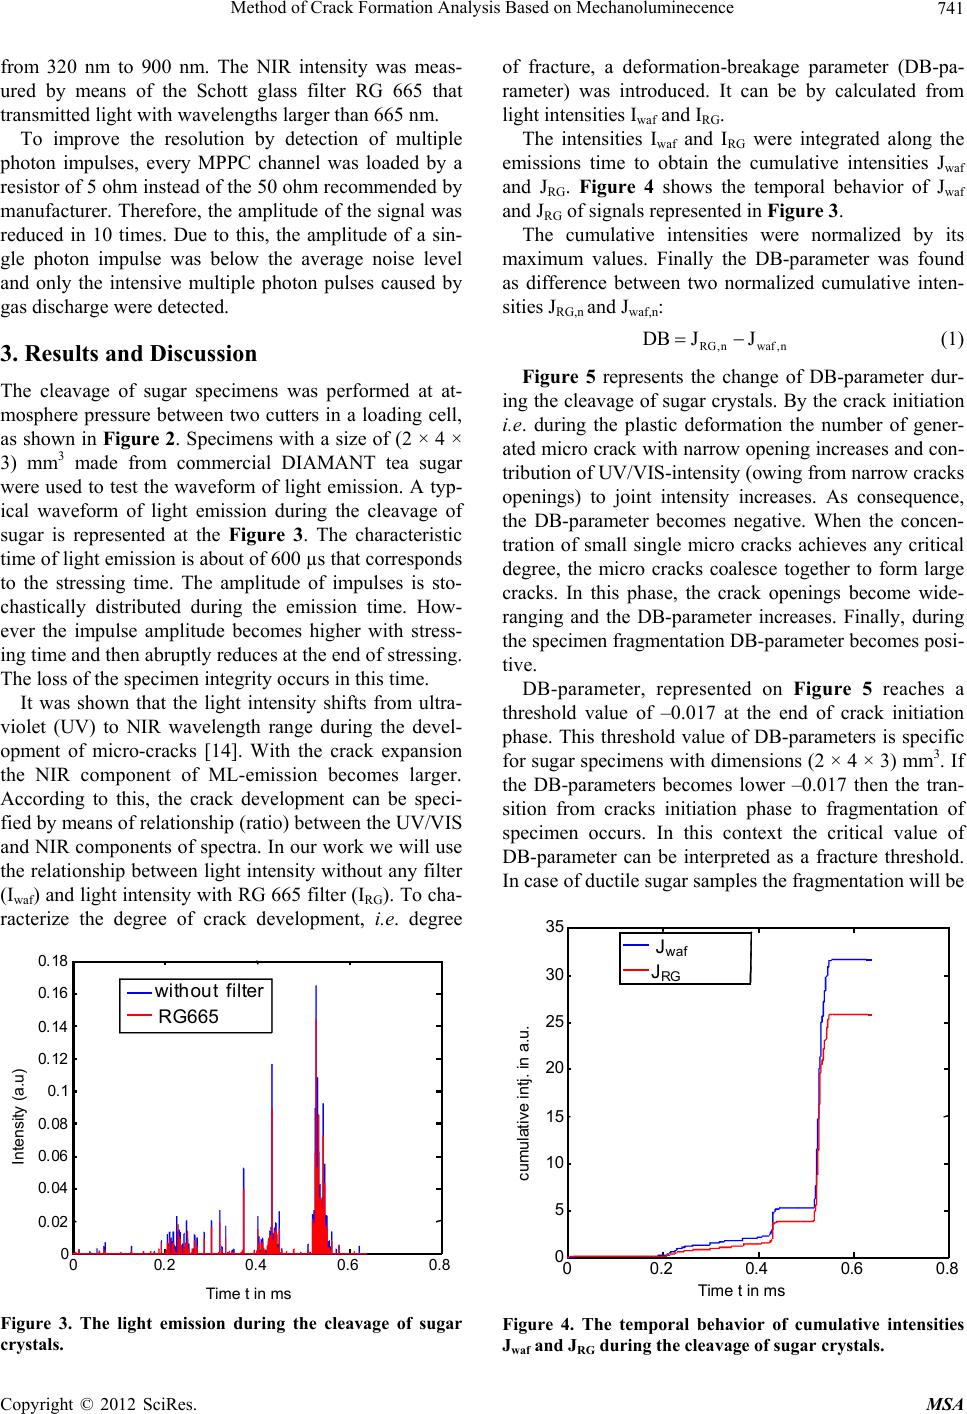 Method of Crack Formation Analysis Based on Mechanoluminecence 741 from 320 nm to 900 nm. The NIR intensity was meas- ured by means of the Schott glass filter RG 665 that transmitted light with waveleng ths larger than 665 nm. To improve the resolution by detection of multiple photon impulses, every MPPC channel was loaded by a resistor of 5 ohm instead of the 50 ohm recommended by manufacturer. Therefore, the amplitude of the signal was reduced in 10 times. Due to this, the amplitude of a sin- gle photon impulse was below the average noise level and only the intensive multiple photon pulses caused by gas dischar ge were detected. 3. Results and Discussion The cleavage of sugar specimens was performed at at- mosphere pressure between two cutters in a loading cell, as shown in Figure 2. Specimens with a size of (2 × 4 × 3) mm3 made from commercial DIAMANT tea sugar were used to test the waveform of light emission. A typ- ical waveform of light emission during the cleavage of sugar is represented at the Figure 3. The characteristic time of light emission is abou t of 600 µs that correspon d s to the stressing time. The amplitude of impulses is sto- chastically distributed during the emission time. How- ever the impulse amplitude becomes higher with stress- ing time and then abruptly reduces at the end of stressing. The loss of the specimen integrity o ccurs in this time. It was shown that the light intensity shifts from ultra- violet (UV) to NIR wavelength range during the devel- opment of micro-cracks [14]. With the crack expansion the NIR component of ML-emission becomes larger. According to this, the crack development can be speci- fied by means of relationship (ratio) between the UV/VIS and NIR components of spectra. In our work we will use the relationship between light intensity without any filter (Iwaf) and light intensity with RG 665 filter (IRG). To cha- racterize the degree of crack development, i.e. degree 00.2 0.4 0.6 0.8 0 0.02 0.04 0.06 0.08 0.1 0.12 0.14 0.16 0.18 without filter RG665 Time t inms I n t e n s i t y ( a . u . ) Intensity (a.u) Time t in ms Figure 3. The light emission during the cleavage of sugar crystals. of fracture, a deformation-breakage parameter (DB-pa- rameter) was introduced. It can be by calculated from light intensities Iwaf and IRG. The intensities Iwaf and IRG were integrated along the emissions time to obtain the cumulative intensities Jwaf and JRG. Figure 4 shows the temporal behavior of Jwaf and JRG of signals represented in Figure 3. The cumulative intensities were normalized by its maximum values. Finally the DB-parameter was found as difference between two normalized cumulative inten- sities JRG,n and Jwaf,n: RG nwafn DB JJ (1) Figure 5 represents the change of DB-parameter dur- ing the cleavage of sugar crystals. By the crack initiation i.e. during the plastic deformation the number of gener- ated micro crack with narrow opening increases and con- tribution of UV/VIS-intensity (owing from narrow cracks openings) to joint intensity increases. As consequence, the DB-parameter becomes negative. When the concen- tration of small single micro cracks achieves any critical degree, the micro cracks coalesce together to form large cracks. In this phase, the crack openings become wide- ranging and the DB-parameter increases. Finally, during the specimen fragmentation DB-parameter becomes posi- tive. DB-parameter, represented on Figure 5 reaches a threshold value of –0.017 at the end of crack initiation phase. This threshold value of DB-parameters is specific for sugar specimens with dimensions (2 × 4 × 3) mm3. If the DB-parameters becomes lower –0.017 then the tran- sition from cracks initiation phase to fragmentation of specimen occurs. In this context the critical value of DB-parameter can be interpreted as a fracture threshold. In case of ductile sugar samples the fragmentation will be 00.2 0.4 0.6 0.8 0 5 10 15 20 25 30 35 Jwaf JRG C u m u l a t i v e I n t . J . i n a . u . Ti me tin ms cumulative intj. in a.u. Time t in ms Figure 4. The temporal behavior of cumulative intensities Jwaf and JRG during the cleavage of sugar crystals. Copyright © 2012 SciRes. MSA 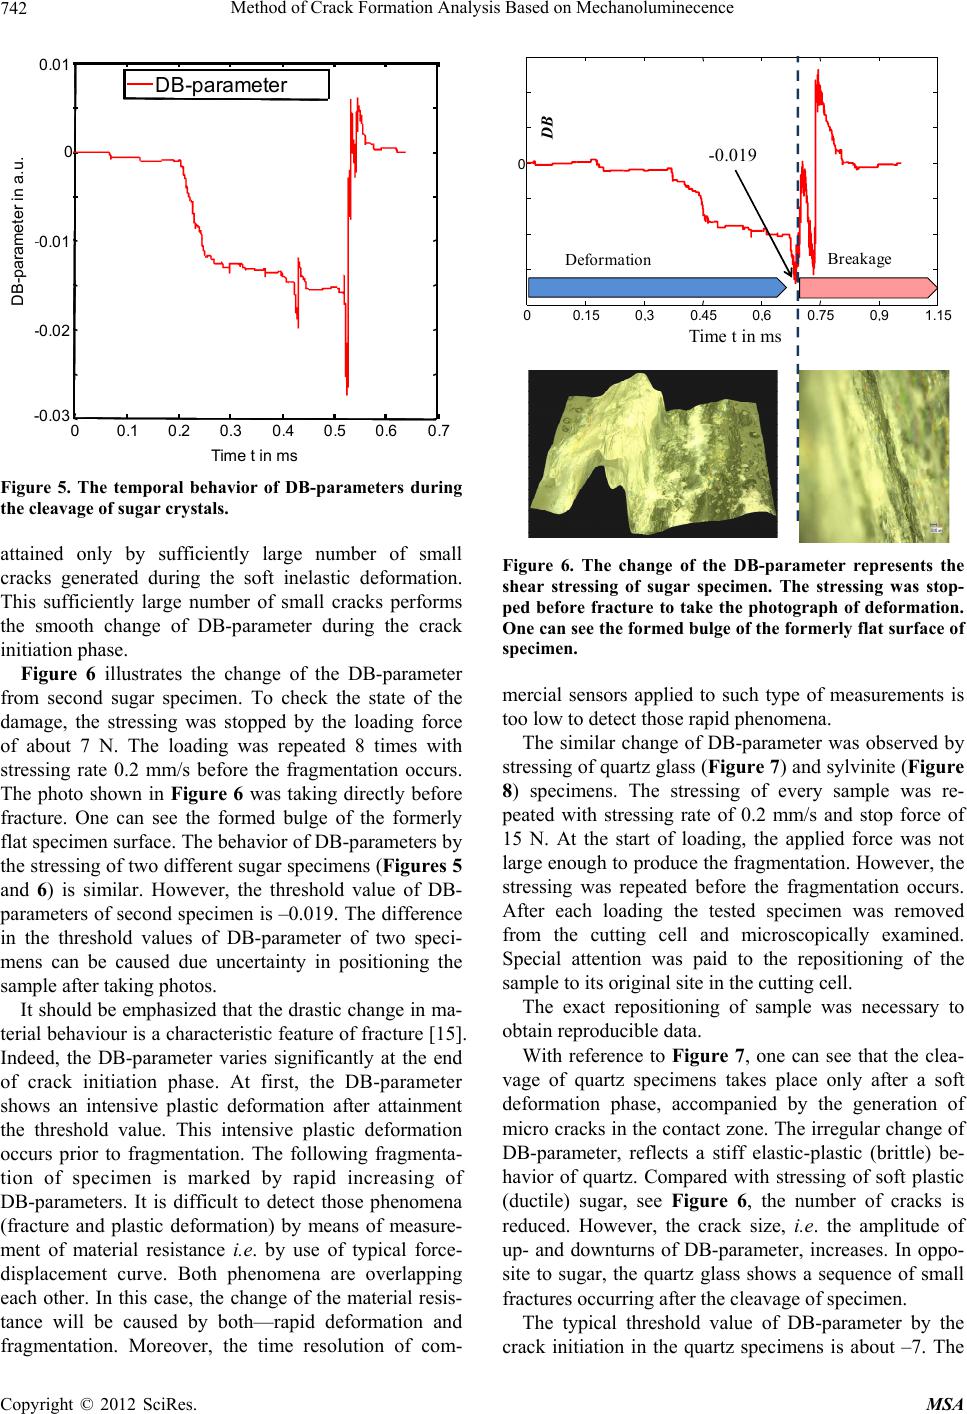 Method of Crack Formation Analysis Based on Mechanoluminecence 742 00.1 0.20.3 0.40.50.6 0.7 -0.03 -0.02 -0.01 0 0.01 DB-parameter Ti t i D B - p a r a m e t e r i n a . u . Time t in ms DB-parameter i n a.u. Figure 5. The temporal behavior of DB-parameters during the cleavage of sugar crystals. attained only by sufficiently large number of small cracks generated during the soft inelastic deformation. This sufficiently large number of small cracks performs the smooth change of DB-parameter during the crack initiation phase. Figure 6 illustrates the change of the DB-parameter from second sugar specimen. To check the state of the damage, the stressing was stopped by the loading force of about 7 N. The loading was repeated 8 times with stressing rate 0.2 mm/s before the fragmentation occurs. The photo shown in Figure 6 was taking directly before fracture. One can see the formed bulge of the formerly flat specimen surface. The behavior of DB-parameters by the stressing of two different sugar specimens (Figures 5 and 6) is similar. However, the threshold value of DB- parameters of second specimen is –0.019. The difference in the threshold values of DB-parameter of two speci- mens can be caused due uncertainty in positioning the sample after taking photos. It should be emphasized that the drastic change in ma- terial behaviour is a characteristic feature of fracture [15]. Indeed, the DB-parameter varies significantly at the end of crack initiation phase. At first, the DB-parameter shows an intensive plastic deformation after attainment the threshold value. This intensive plastic deformation occurs prior to fragmentation. The following fragmenta- tion of specimen is marked by rapid increasing of DB-parameters. It is difficult to detect those phenomena (fracture and plastic deformation) by means of measure- ment of material resistance i.e. by use of typical force- displacement curve. Both phenomena are overlapping each other. In this case, the change of the material resis- tance will be caused by both—rapid deformation and fragmentation. Moreover, the time resolution of com- Deformation Fragmentation D B = - 0,027 Time t in ms 00,15 0,3 0,450,6 0,750,9 1,15 0 Deformation Breaka ge DB -0.019 Figure 6. The change of the DB-parameter represents the shear stressing of sugar specimen. The stressing was stop- ped before fracture to take the photograph of deformation. One can see the formed bulge of the formerly flat surface of specimen. mercial sensors applied to such type of measurements is too low to detect those rapid phenomena. The similar change of DB-parameter was observed by stressing of quartz glass (Figure 7) and sylvinite (Figure 8) specimens. The stressing of every sample was re- peated with stressing rate of 0.2 mm/s and stop force of 15 N. At the start of loading, the applied force was not large enough to produce th e fragmentation. However, the stressing was repeated before the fragmentation occurs. After each loading the tested specimen was removed from the cutting cell and microscopically examined. Special attention was paid to the repositioning of the sample to its original site in the cutting cell. The exact repositioning of sample was necessary to obtain reproducible data. With reference to Figure 7, one can see that the clea- vage of quartz specimens takes place only after a soft deformation phase, accompanied by the generation of micro cracks in the contact zone. The irregular change of DB-parameter, reflects a stiff elastic-plastic (brittle) be- havior of quartz. Compared with stressing of soft plastic (ductile) sugar, see Figure 6, the number of cracks is reduced. However, the crack size, i.e. the amplitude of up- and downturns of DB-parameter, increases. In oppo- site to sugar, the quartz glass shows a sequence of small fractures occurring after the cleavage of specimen. The typical threshold value of DB-parameter by the crack initiation in the quartz specimens is about –7. The Copyright © 2012 SciRes. MSA  Method of Crack Formation Analysis Based on Mechanoluminecence 743 00.05 0.1 0.150.2 0.25 0.3 0.35 0.40.45 0 0 Time t in ms Deformation Fragmentation DB = -7 Figure 7. The change of the DB-parameter during the shear stressing of quartz glass specimen. The left photo represents a narrow contact spur of the cutting plate on the sample surface. The right photo represents a breakage surface with a characteristic morphology of brittle fracture. 00.2 0.4 0.6 0.8 11.2 1.4 0 Time t in ms Frag ment- ation1 Deformation DB DB = -0,036 Fragmentation 1 Figure 8. The change of the DB-parameter during the stressing of sylvinite specimen. The left photo represents a contact spur associated with plastic deform ation during the cracks initiation. The right photo represents a breakage surface with cr ac ks. brittle behavior of quartz is verified by photo of breakage surface (right photo Figure 7). The sharp edge of the cutter produce a narrow contact spur on the sample sur- face with a width of about 100 microns, see left photo. Only small deformation was observed before fracture. A fracture surface with characteristic pattern of stiff elas- tic-plastic (brittle) fracture is presented on the right photo. One can see relative smooth surface with striations and large cracks. Figure 8 shows the elastic-plastic behavior of sylvinite. The soft plastic contribution is reflected by the smooth change of DB-parameter during the phase of cracks ini- tiation. However, from time to time the plastic deforma- tion is accompanied by generation intermediate cracks marked by fluctuations of DB-parameter. In these phases the brittle behavior of specimen is dominant. The photo links verified this mixed behavior. Indeed, the surface with significant plastic deformation of speci- men is presented. However, the large striations owning from contact zone is a specific feature of brittle fracture. The right photo represents a smooth breakage surface with large cracks. 4. Conclusions The cracks formation was characterized by use of the light impulses emitted during the micro gas discharges in cracks opening. The periodical stressing of sugar, quartz and sylvinite samples shows the existence of fragmenta- tion thresholds. When the concentration of micro cracks overcomes a fragmentation threshold the crack openings become wide-ranging and fragmentation occurs. By means of an introduced deformation-breakage parameter this transition can be predicted based on the crack initia- tion data. The developed measurement technique can be suc- cessful applied to cracks formation analyses. Often the plastic deformation and generation of cracks are occur- ring simultaneously. However, it is possible to distin- guish between those processes by means of the deforma- tion-breakage parameter. The monitoring of plastic de- formation and generation of cracks can be accomplished separately with high temporal resolution. Finally, it should be mentioned that the fracture analy- sis based on light emission in real situations is often connected with difficulties. The main problem is the change of material transparence caused by formation of new cracks. To reduce the influence of specimen trans- parence on results of the fracture analyses, the DB-pa- rameter was introduced. Only the normalized cumulative intensities were used to calculate the DB-parameter. Due to this the results of crack formation analysis will not be significantly affected by change of specimen transpar- ence. 5. Acknowledgements This work is carried out in the framework of the DFG priority program: Partikel im Kontakt—Mikromechanik, Copyright © 2012 SciRes. MSA  Method of Crack Formation Analysis Based on Mechanoluminecence Copyright © 2012 SciRes. MSA 744 Mikroprozessdynamik und Partikelkollektive (SPP 1486). Project: AM 336/1-2. REFERENCES [1] J. Schive, “Fatigue of Structures and Materials, Dor- drecht,” Kluwer Academic, Boston, 2001. [2] L. C. H. Ricardo, “Numerical Determination of Crack Opening and Closure Stress Intensity Factors,” Engi- neering Letters, Vol. 17, No. 3, 2009, 5 p. [3] A. Ray, “Stochastic Measure of Fatigue Crack Damage for Health Monitoring of Ductile Alloy Structures,” Structural Health Monitoring, Vol. 3, No. 3, 2004, pp. 245-263. doi:10.1177/1475921704045626 [4] S. Gupta, A. Ray and E. Keller, “Symbolic Time Series Analysis of Ultrasonic Data for Early Detection of Fa- tigue Damage,” Mechanical Systems and Signal Process- ing, Vol. 21, No. 2, 2007, pp. 866-884. doi:10.1016/j.ymssp.2005.08.022 [5] S. Gupta and A. Ray, “Real-Time Fatigue Life Estimation in Mechanical Structures,” Measurement Science and Technology, Vol. 18, No. 7, 2007, pp. 1947-1957. doi:10.1088/0957-0233/18/7/022 [6] B. P. Chandra, C. N. Xu, H. Yamada and X. G. Zheng, “Luminescence Induced by Elastic Deformation of ZnS:Mn Nanoparticles,” Journal of Luminescence, Vol. 130, No. 3, 2010, pp. 442-450. doi:10.1016/j.jlumin.2009.10.010 [7] B. P. Chandra, “Mechanoluminescence,” In: R. D. Vij, Ed., Luminescence of Solids, Plenum Press, New York, 1998, p. 368. doi:10.1007/978-1-4615-5361-8_10 [8] J. T. Dickinson, E. E. Donaldson and M. K. Park, “The Emission of Electrons and Positive Ions from Fracture of Materials,” Journal of Materials Science, Vol. 16, No. 10, 1981, pp. 2897-2911. doi:10.1007/BF02402856 [9] J. T. Dickinson, L. C. Jensen, S. Lee, L. Scudiero and S. C. Langford, “Fractoemission and Electrical Transients Due to Interfacial Failure,” Journal of Adhesion Science and Technology, Vol. 8, No. 11, 1994, pp. 1285-1309. doi:10.1163/156856194X00618 [10] MPPC Technical Information, 2009. http://sales.hamamatsu.com/de/produkte/solid-state-divisi on/si-photodiode-series/mppc.php?src=hp [11] S. Aman and J. Tomas, “Mechanolumineszenz Während der Nasszerkleinerung von Feinen Partikeln,” Chemie Ingenieur Technik, Vol. 76, No. 1-2, 2004, pp. 81-83. doi:10.1002/cite.200403301 [12] S. Aman and J. Tomas, “On-Line Determination of Parti- cle Size during Fine Grinding Based on Luminescence Properties of Solid,” International Journal of Mineral Processing, Vol. 74, No. 2, 2005, pp. 345-348. doi:10.1016/j.minpro.2004.07.006 [13] S. Aman, J. Tomas, M. Molitor, A. Aman and M. Pieper, “Sensoreinrichtung und Verfahren zur Vorhersage Eines Schädigungszustands von Bauteilen,” 2011. [14] S. Aman, J. Tomas and A. N. Streletskii, “Fast Modifica- tion of Microdischarge Emission Bands by Fracture of Sugar,” Chinese Physics Letters, Vol. 28, No. 8, 2011, Article ID: 087802. doi:10.1088/0256-307X/28/8/087802 [15] D. Gross and T. Seelig, “Fracture Mechanics. With an Introduction to Micromechanics,” Springer, Berlin, Vol. 39, 2011. |