

Paper Menu >>
Journal Menu >>
 Vol.3, No.6, 865-870 (2012) Agricultural Sciences http://dx.doi.org/10.4236/as.2012.36105 Robust and cost-effective system for measuring and logging of data on soil water content and soil temperature profile Mitja Ferlan1,2*, Primoz Simončič2 1University of Ljubljana, Biotechnical Faculty, Ljubljana, Slovenia; *Corresponding Author: [email protected] 2Slovenian Forestry Institute, Ljubljana, Slovenia Received 13 June 2012; revised 22 July 2012; accepted 10 August 2012 ABSTRACT The paper describes the system for measuring and logging of data on soil water content and soil temperature profile. The system was tested in a field and shows great potential for per- forming continuous measurements. It has sev- eral benefits including ease of manufacture, low cost, reliable performance and the ability to download the data without specialized software. Keywords: Data-Logger; Soil Temperature; Soil Water Content; Microcontrollers; Sensors 1. INTRODUCTION Continuous and automated systems for measuring and data-logging are needed nowadays in almost every natu- ral environmental research project. Each natural envi- ronment or ecosystem is composed of different segments. For all terrestrial ecosystems, the common segment is soils, where numerous processes take place. One of the most important is soil respiration, which is also, after photosynthetic assimilation, the second largest flux of carbon and one of the key determinants of net-ecosystem carbon exchange [1]. To measure soil respiration, the researchers have used different techniques. Simple but time consuming technique is using close dynamic or open dynamic chambers [2] and portable infrared gas analyzer with an appropriate data logger and system for pumping air. The weakness of portable system for meas- uring soil respiration is non-continuous measurements. One of such portable system for measuring soil respire- tion with close dynamic chamber is LI-6400 (LI-COR Biosciences Inc., Lincoln, NE). More complicate and more expensive but less time consuming is the use of automated systems for measuring soil respiration (e.g.: LI-8100, LI-COR Biosciences Inc., Lincoln, NE). Main feature of these systems is continuous measurements of soil respiration. Another expensive way to measure soil respiration is the profile method, but it is not widely used in comparison with the previously mentioned methods [3]. In natural environments, high spatial variability, es- pecially in soils, is not rare and therefore several repeti- tions of soil respiration measurement are needed. The main drivers of soil respiration are soil temperature (Ts) and soil water content (SWC). Continuous measurements of these two parameters can be relatively easily per- formed. In the case of using portable systems for meas- uring soil respiration, we are limited to sensing temporal variability but in the case of using automated systems we are limited to sensing spatial variability. Both limitations can be minimized with additional measurements of Ts and SWC using apropriate model to gap-fill the data [4]. Spatial and temporal variability of these two parameters could be observed with an appropriate number of Ts and SWC profiles. Several profiles mean that many connec- tions with cables must be made, or alternatively, expen- sive installation of wireless sensors could be used. Due to these needs, we have developed, constructed and tested a robust and cost-effective system for measuring and data logging Ts and SWC, which is presented in this paper. 2. SYSTEM DESCRIPTION The system for measuring and data logging soil water content and soil temperature profiles is microcontroller- based with sensors and peripheral components connected to it. All selected electronic components have low power consumption and allow battery-powered operation. Cost estimation and electronic parts of the system are listed in Table 1. 2.1. Unit for Measuring Soil Water Content Two frequency domain sensors EC-5 (Decagon De- vices Inc., Pullman, WA) for measuring soil water con- tent were used. For correct supply voltage of 2.5 V for Copyright © 2012 SciRes. OPEN ACCESS 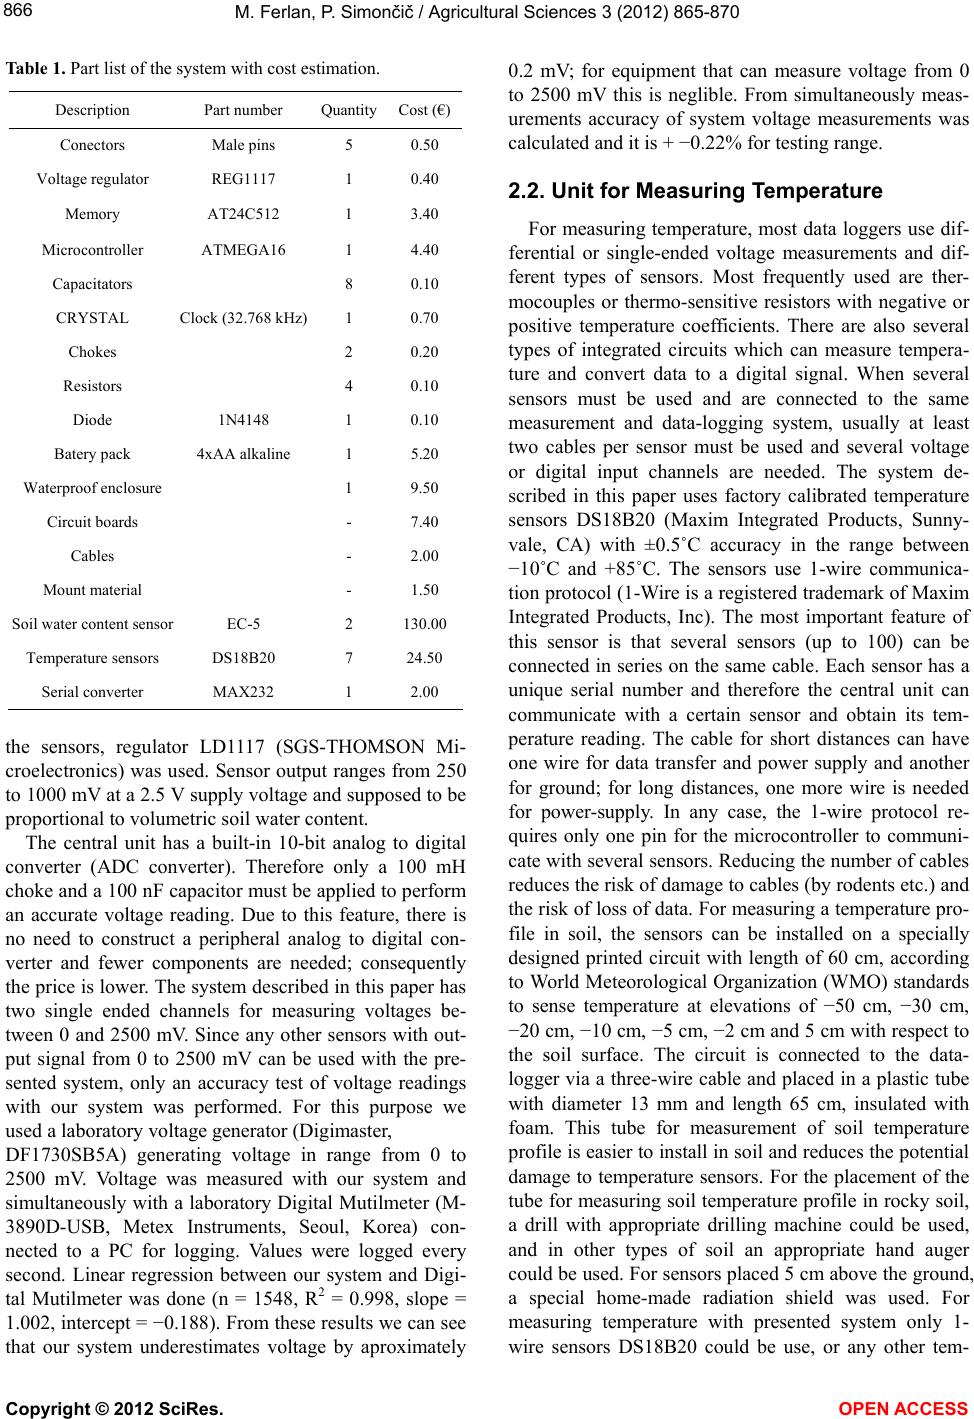 M. Ferlan, P. Simončič / Agricultural Sciences 3 (2012) 865-870 866 Table 1. Part list of the system with cost estimation. Description Part number Quantity Cost (€) Conectors Male pins 5 0.50 Voltage regulator REG1117 1 0.40 Memory AT24C512 1 3.40 Microcontroller ATMEGA16 1 4.40 Capacitators 8 0.10 CRYSTAL Clock (32.768 kHz) 1 0.70 Chokes 2 0.20 Resistors 4 0.10 Diode 1N4148 1 0.10 Batery pack 4xAA alkaline 1 5.20 Waterproof enclosure 1 9.50 Circuit boards - 7.40 Cables - 2.00 Mount material - 1.50 Soil water content sensor EC-5 2 130.00 Temperature sensors DS18B20 7 24.50 Serial converter MAX232 1 2.00 the sensors, regulator LD1117 (SGS-THOMSON Mi- croelectronics) was used. Sensor output ranges from 250 to 1000 mV at a 2.5 V supply voltage and supposed to be proportional to volumetric soil water content. The central unit has a built-in 10-bit analog to digital converter (ADC converter). Therefore only a 100 mH choke and a 100 nF capacitor must be applied to perform an accurate voltage reading. Due to this feature, there is no need to construct a peripheral analog to digital con- verter and fewer components are needed; consequently the price is lower. The system described in this paper has two single ended channels for measuring voltages be- tween 0 and 2500 mV. Since any other sensors with out- put signal from 0 to 2500 mV can be used with the pre- sented system, only an accuracy test of voltage readings with our system was performed. For this purpose we used a laboratory voltage generator (Digimaster, DF1730SB5A) generating voltage in range from 0 to 2500 mV. Voltage was measured with our system and simultaneously with a laboratory Digital Mutilmeter (M- 3890D-USB, Metex Instruments, Seoul, Korea) con- nected to a PC for logging. Values were logged every second. Linear regression between our system and Digi- tal Mutilmeter was done (n = 1548, R2 = 0.998, slope = 1.002, intercept = −0.188). From these results we can see that our system underestimates voltage by aproximately 0.2 mV; for equipment that can measure voltage from 0 to 2500 mV this is neglible. From simultaneously meas- urements accuracy of system voltage measurements was calculated and it is + −0.22% for testing range. 2.2. Unit for Measuring Temperature For measuring temperature, most data loggers use dif- ferential or single-ended voltage measurements and dif- ferent types of sensors. Most frequently used are ther- mocouples or thermo-sensitive resistors with negative or positive temperature coefficients. There are also several types of integrated circuits which can measure tempera- ture and convert data to a digital signal. When several sensors must be used and are connected to the same measurement and data-logging system, usually at least two cables per sensor must be used and several voltage or digital input channels are needed. The system de- scribed in this paper uses factory calibrated temperature sensors DS18B20 (Maxim Integrated Products, Sunny- vale, CA) with ±0.5˚C accuracy in the range between −10˚C and +85˚C. The sensors use 1-wire communica- tion protocol (1-Wire is a registered trademark of Maxim Integrated Products, Inc). The most important feature of this sensor is that several sensors (up to 100) can be connected in series on the same cable. Each sensor has a unique serial number and therefore the central unit can communicate with a certain sensor and obtain its tem- perature reading. The cable for short distances can have one wire for data transfer and power supply and another for ground; for long distances, one more wire is needed for power-supply. In any case, the 1-wire protocol re- quires only one pin for the microcontroller to communi- cate with several sensors. Reducing the number of cables reduces the risk of damage to cables (by rodents etc.) and the risk of loss of data. For measuring a temperature pro- file in soil, the sensors can be installed on a specially designed printed circuit with length of 60 cm, according to World Meteorological Organization (WMO) standards to sense temperature at elevations of −50 cm, −30 cm, −20 cm, −10 cm, −5 cm, −2 cm and 5 cm with respect to the soil surface. The circuit is connected to the data- logger via a three-wire cable and placed in a plastic tube with diameter 13 mm and length 65 cm, insulated with foam. This tube for measurement of soil temperature profile is easier to install in soil and reduces the potential damage to temperature sensors. For the placement of the tube for measuring soil temperature profile in rocky soil, a drill with appropriate drilling machine could be used, and in other types of soil an appropriate hand auger could be used. For sensors placed 5 cm above the ground, a special home-made radiation shield was used. For measuring temperature with presented system only 1- wire sensors DS18B20 could be use, or any other tem- Copyright © 2012 SciRes. OPEN ACCESS  M. Ferlan, P. Simončič / Agricultural Sciences 3 (2012) 865-870 867 perature sensors with output ranged from 0 to 2500 mV can be connected to single ended channels. Despite manufacturer guarantee that sensors are calibrated, we performed a test with seven temperature sensors placed in a measurement stick and classical meteorological ther- mometer (mercury thermometer). As a testing media, water with ice was used and appropriate hand mixing was performed. Temperature ranged from 4˚C to 17˚C and values were logged or manually read every 30 min- utes. For each temperature sensor, linear regression with mercury thermometer measurements (n = 12) was made. From all parameters of linear regression (N = 7), we cal- culated means and standard deviations (R2 = 0.997 + −0.001, slope = 0.975 + −0.023, intercept = 0.124 + −0.377). With these temperature sensors, the temperature is slightly underestimated compared with the mercury thermometer. From simultaneously measurements accu- racy of system temperature measurements was calculated and it is ±1.1% for testing range. 2.3. Unit for Data Logging The Philips Inter-IC communications (I2C) protocol (Philips Semiconductors, The Netherlands) is commonly used for interfacing peripheral devices and microcon- trollers. We used this type of communication for data- logging of nine measured parameters and time stamp on an AT24C512 (Atmel Corporation, San Jose, CA) mem- ory module. Measurement frequency in range from 5 to 3600s can be set and system informs us for how many days the data-logger can store data (For example: meas- uring frequency set to 30 minutes, the data-logger can store data for 59 days). If we do not download the data to an external device (notebook, handheld computer…) and the memory module is full, the microcontroller stops measuring and goes into power-down mode. 2.4. Unit for Communication with Other Devices The user can communicate with the circuit using ter- minal software on a notebook or handheld computer. Communication is available via serial interface (baud rate: 56,000, Data bits: 8, Parity: none, Stop bits: 1, Handshaking: none). To establish serial communication with computer also serial to USB converter could be used. When connection with the computer is established the microcontroller program starts a user-interface rou- tine and displays in the terminal program a notice with the instructions on how to set up time and date, the loca- tion of data-logger or download the data. One of the ad- vantages of the presented system for measuring and data-logging is that you do not need to install any special software on your computer. Hyper Terminal (Windows) or any other free software for reading data from serial ports can be used. 2.5. Unit for Constant Power Supply with Battery Pack The microcontroller circuit is powered by a battery pack, consisting of four AA-size, 1.5 V alkaline batteries. Since the microcontroller and other devices (except sen- sors EC-5 for which a voltage regulator is used) can op- erate at a voltage between 4.5 and 5.5 V, only a diode was used in the supply line to avoid short-circuits and to reduce the voltage from the battery pack. The current drawn is approximately 15 µA in power save mode and 22 mA during measurement. Each measurement lasts less than 2 seconds and if the measurement frequency is set to 30 minutes, using standard AA alkaline batteries, with a capacity of approximately 2500 mAh, we can expect a battery life of approximately 5.5 years. 2.6. Central Unit with Real-Time Clock and Running Program For the central unit a microcontroller (ATmega16, Atmel Corporation, San Jose, CA) was used. The AT- mega16 is a low-power CMOS 8-bit microcontroller based on the AVR enhanced RISC architecture. The AT- mega16 offers several functions that allow the construc- tion of the system with minimum peripheral components, because of which it is cost-effective and robust. To apply a real-time clock, the crystal oscillator with 32.768 kHz frequency must be connected to the microcontroller. The software for the microcontroller was written in a BASIC-like language (BASCOM-AVR, MCS Electron- ics, Holland) for Microsoft Windows XP. The program was compiled in microcontroller assembly language and uploaded to the microcontroller using a programmer (PROGGY AVR, AX Elektronika, Slovenia) connected to a desktop computer via AVR Studio 4 software (Atmel Corporation, San Jose, CA). 2.7. System Fabrication and Housing The system with all its components was built by the authors, who have also designed the electrical schematic of the circuit board (Figure 1). The schematic was trans- ferred to the circuit board, which was drilled out on a small CNC machine in the laboratory for electronic sys- tems at the Slovenian Forestry Institute. Electronic components and connectors were soldered onto each circuit board and sensor cables were prepared. The tubes for temperature profile measurements were prepared according to World Meteorological Organiza- tion standards. For the fabrication and testing of one sys- tem approximately 4 hours are required. The system has a waterproof housing. Three cables for Copyright © 2012 SciRes. OPEN ACCESS 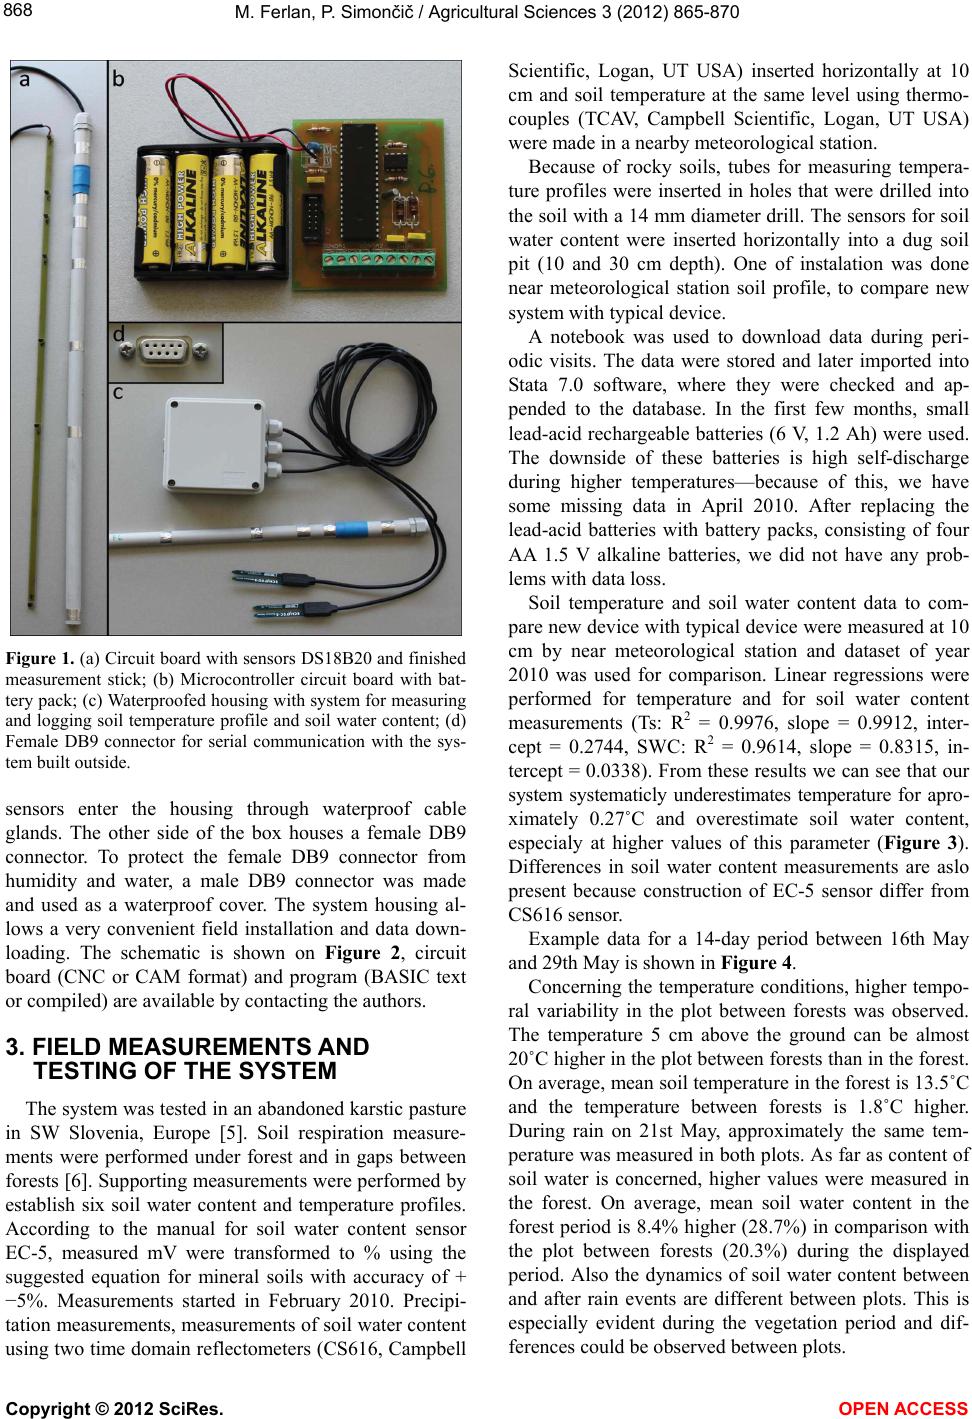 M. Ferlan, P. Simončič / Agricultural Sciences 3 (2012) 865-870 868 Figure 1. (a) Circuit board with sensors DS18B20 and finished measurement stick; (b) Microcontroller circuit board with bat- tery pack; (c) Waterproofed housing with system for measuring and logging soil temperature profile and soil water content; (d) Female DB9 connector for serial communication with the sys- tem built outside. sensors enter the housing through waterproof cable glands. The other side of the box houses a female DB9 connector. To protect the female DB9 connector from humidity and water, a male DB9 connector was made and used as a waterproof cover. The system housing al- lows a very convenient field installation and data down- loading. The schematic is shown on Figure 2, circuit board (CNC or CAM format) and program (BASIC text or compiled) are available by contacting the authors. 3. FIELD MEASUREMENTS AND TESTING OF THE SYSTEM The system was tested in an abandoned karstic pasture in SW Slovenia, Europe [5]. Soil respiration measure- ments were performed under forest and in gaps between forests [6]. Supporting measurements were performed by establish six soil water content and temperature profiles. According to the manual for soil water content sensor EC-5, measured mV were transformed to % using the suggested equation for mineral soils with accuracy of + −5%. Measurements started in February 2010. Precipi- tation measurements, measurements of soil water content using two time domain reflectometers (CS616, Campbell Scientific, Logan, UT USA) inserted horizontally at 10 cm and soil temperature at the same level using thermo- couples (TCAV, Campbell Scientific, Logan, UT USA) were made in a nearby meteorological station. Because of rocky soils, tubes for measuring tempera- ture profiles were inserted in holes that were drilled into the soil with a 14 mm diameter drill. The sensors for soil water content were inserted horizontally into a dug soil pit (10 and 30 cm depth). One of instalation was done near meteorological station soil profile, to compare new system with typical device. A notebook was used to download data during peri- odic visits. The data were stored and later imported into Stata 7.0 software, where they were checked and ap- pended to the database. In the first few months, small lead-acid rechargeable batteries (6 V, 1.2 Ah) were used. The downside of these batteries is high self-discharge during higher temperatures—because of this, we have some missing data in April 2010. After replacing the lead-acid batteries with battery packs, consisting of four AA 1.5 V alkaline batteries, we did not have any prob- lems with data loss. Soil temperature and soil water content data to com- pare new device with typical device were measured at 10 cm by near meteorological station and dataset of year 2010 was used for comparison. Linear regressions were performed for temperature and for soil water content measurements (Ts: R2 = 0.9976, slope = 0.9912, inter- cept = 0.2744, SWC: R2 = 0.9614, slope = 0.8315, in- tercept = 0.0338). From these results we can see that our system systematicly underestimates temperature for apro- ximately 0.27˚C and overestimate soil water content, especialy at higher values of this parameter (Figure 3). Differences in soil water content measurements are aslo present because construction of EC-5 sensor differ from CS616 sensor. Example data for a 14-day period between 16th May and 29th May is shown in Figure 4. Concerning the temperature conditions, higher tempo- ral variability in the plot between forests was observed. The temperature 5 cm above the ground can be almost 20˚C higher in the plot between forests than in the forest. On average, mean soil temperature in the forest is 13.5˚C and the temperature between forests is 1.8˚C higher. During rain on 21st May, approximately the same tem- perature was measured in both plots. As far as content of soil water is concerned, higher values were measured in the forest. On average, mean soil water content in the forest period is 8.4% higher (28.7%) in comparison with the plot between forests (20.3%) during the displayed period. Also the dynamics of soil water content between and after rain events are different between plots. This is especially evident during the vegetation period and dif- ferences could be observed between plots. Copyright © 2012 SciRes. OPEN ACCESS 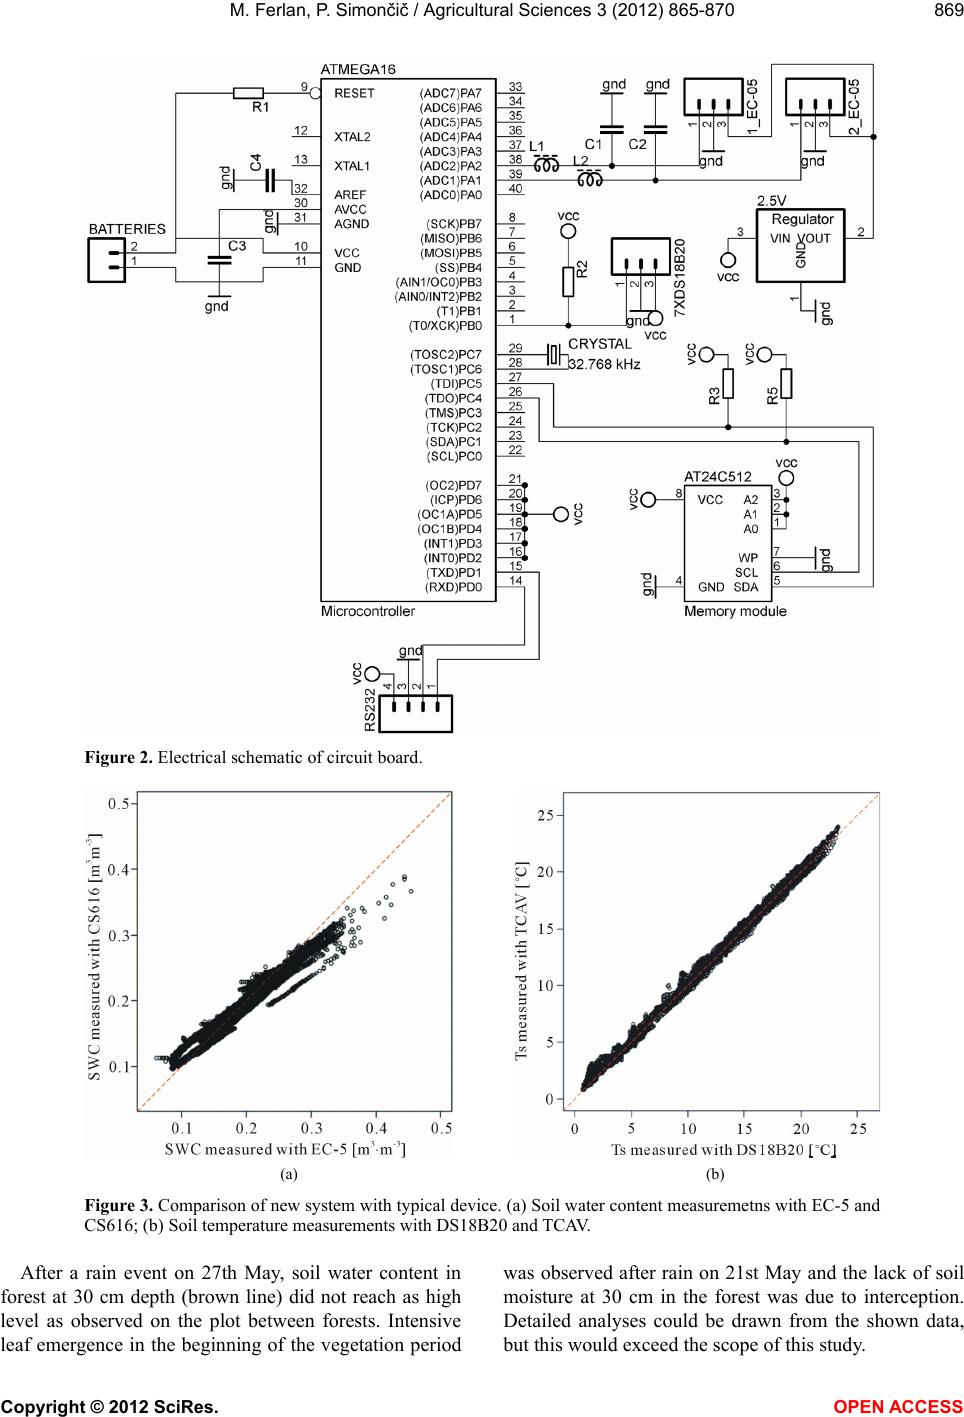 M. Ferlan, P. Simončič / Agricultural Sciences 3 (2012) 865-870 Copyright © 2012 SciRes. 869 Figure 2. Electrical schematic of circuit board. (a) (b) Figure 3. Comparison of new system with typical device. (a) Soil water content measuremetns with EC-5 and CS616; (b) Soil temperature measurements with DS18B20 and TCAV. After a rain event on 27th May, soil water content in forest at 30 cm depth (brown line) did not reach as high level as observed on the plot between forests. Intensive leaf emergence in the beginning of the vegetation period was observed after rain on 21st May and the lack of soil moisture at 30 cm in the forest was due to interception. Detailed analyses could be drawn from the shown data, but this would exceed the scope of this study. OPEN ACCESS  M. Ferlan, P. Simončič / Agricultural Sciences 3 (2012) 865-870 870 Figure 4. Example data of soil water content and soil temperature profile for 14-day period between 16th May and 29th May. (a) Soil temperature profile for plot in forest fragment (air temperature at 5 cm above ground (dark blue line), soil temperature at 2 cm (red line), 5 cm (green line), 10 cm (purple line), 20 cm (blue line), 30 cm (orange line), 50 cm (grey line)); (b) Soil temperature profile for plot between forest fragments (air temperature at 5 cm above ground (dark blue line), soil temperature at 2 cm (red line), 5 cm (green line), 10 cm (purple line), 20 cm (blue line), 30 cm (orange line), 50 cm (grey line)); (c) Soil water content for plot in forest fragment (soil water content at 10 cm (green line), soil water content at 30 cm (brown line)); (d) Soil water content for plot between forest fragments (soil water content at 10 cm (green line), soil water content at 30 cm (brown line)). 4. CONCLUSION The example presents only one aspect of practical use of the measurements, collected with our system. If we would install our system into a systematic grid for exam- ple, we would have a presentation of spatial and tempo- ral variability in the natural ecosystem. This feature can be very useful in inhomogeneous ecosystems such as abandoned extensive pasture. The information collected using the microcontroller-based system for measuring and logging of soil water content and temperature profile has helped with modeling soil respiration between peri- odic measurements on the abandoned extensive pasture. Furthermore, with additional analyses of soil in the labo- ratory, the data from soil temperature profiles will be used to calculate soil heat flux, which is one of the com- ponents of the energy balance of the ecosystem. REFERENCES [1] Raich, J.W. and Schlesinger, W.H. (1992) The global carbon-dioxide flux in soil respiration and its relationship to vegetation and climate. Tellus Series B-Chemical and Physical Meteorology, 44, 81-99. doi:10.1034/j.1600-0889.1992.t01-1-00001.x [2] Hutchinson, G.L. and Livingston, G.P. (2001) Vents and seals in non-steady-state chambers used for measuring gas exchange between soil and the atmosphere. European Journal of Soil Science, 52, 675-682. doi:10.1046/j.1365-2389.2001.00415.x [3] Nagy, Z., Pinter, K., Pavelka, M., Darenova, E. and Ba- logh, J. (2011) Carbon fluxes of surfaces vs ecosystems: Advantages of measuring eddy covariance and soil respi- ration simultaneously in dry grassland ecosystems. Bio- geosciences, 8, 2523-2534. doi:10.5194/bg-8-2523-2011 [4] Lloyd, J. and Taylor, J.A. (1994) On the temperature de- pendence of soil respiration. Functional Ecology, 8, 315- 323. doi:10.2307/2389824 [5] Ferlan, M., Alberti, G., Eler, K., Batič, F., Peressotti, A., Miglietta, F., Zaldei, A., Simončič, P. and Vodnik, D. (2011) Comparing carbon fluxes between different stages of secondary succession of a karst grassland. Agriculture, Ecosystems and Environment, 140, 199-207. doi:10.1016/j.agee.2010.12.003 [6] Plestenjak, G., Eler, K., Vodnik, D., Ferlan, M., Čater, M., Kanduč, T., Simončič, P. and Ogrinc, N. (2012) Sources of soil CO2 in calcareous grassland with woody plant en- croachment. Journal of Soils and Sediments, in Press. doi:10.1007/s11368-012-0564-3 Copyright © 2012 SciRes. OPEN ACCESS |