

Paper Menu >>
Journal Menu >>
 Modern Economy, 2012, 3, 690-694 http://dx.doi.org/10.4236/me.2012.35089 Published Online September 2012 (http://www.SciRP.org/journal/me) Convergence-Divergence of Technological Efficiency and Productivity across World Regions Paper Title Edward Nissan, Farhang Niroomand 1Department of Political Science, International Development and International Affairs, The University of Southern Mississippi Hattiesburg, Hattiesburg, USA 2School of Business Administration, University of Houston—Victoria, Victoria, USA Email: [email protected] Received July 8, 2012; revised August 8, 2012; accepted August 17, 2012 ABSTRACT This article examines inequalities between and within 57 co untries, categorized by income levels, for efficiency in pro- duction and output per worker for 1965 and 1990. Regression analysis was also employed as a basis of convergence from which countries were evaluated for their potential to actual performance in efficiency and output over a span of 25 years. The findings indicate that gaps between the gro ups of countries widened as compared to gaps within the groups. Convergence was found to increase between the groups of countries as their income levels rose. Keywords: Convergence; Divergence; Technological; Efficiency; Productivity 1. Introduction In anticipation of the rapid pace of technological change, Kurzweil (2005) [1] advanced the term “singularity” to describe the irreversible transformation of human life. Human-created technology and its powers are expanding exponentially. The rate of technological innovation is cu r- rently doubling every decade and that pace is accelerat- ing. Kurzweil argues that with in a few decades, informa- tion-based technology will ultimately include problem- solving skills and even emotional and moral intelligence of the human brain. It is envisioned that singularity will allow humans to gain power over their fates in domains such as mortality. After reaching singularity, there will be no distinction between human and machine, or for that matter, between virtual and physical reality. Continuous technological progress and its social repercussions and its complexity will become important f ea tures o f all soc iet i es. Invariably, economical gro wth of a society will hing e on how it adopts and adapts to the accelerated change of t ec h- nology. The views advanced by Kurzweil regarding future pro- gress in economic welfare being tied up to progress in tec hnology find support from Cheshire and Malecki (2004 ) [2]. On reviewing the traditional neoclassic economic re- search on growth theory of the past 50 years, Cheshire and Malecki find these theories are connected with So- low’s (1956) [3] initial growth model in which equilib- rium growth rate is determined by the long-run growth of supply, which, in turn, is determined by the combined growth of capital stock, labor supply and technical progress. Kumar and Russell (2002) [4], trace the development of theories starting with Solow (1956). Solow’s theory emphasizing technological progress, as explained earlier, was followed by the endogenous growth theory advocate d by Romer (1986) [5] and Lucas, Jr. (1988) [6]. Their th e o- ries include physical and human capital as important ele- ments of growth leading to convergence. Then there is the exogenous growth theory, which emphasizes the accumu- lation of capital as the so urce of conditional convergence. A variant theory on growth is that of Bernard and Jones (1996) [7], who consider technology as the source of con - vergence. Other contributors are Petrakos and Saratsis (2000) [8], Rupasingha, Goetz and Freshwater (2002) [9], Ferguson, Jr. and Wascher (2004) [10], Keller (2004) [11], and Narayan and Smyth (2004) [1 2]. Friedman (2005) [13] declared that the world is flat. What Friedman had in mind is that, thanks to advances in technology and because of globalization, the playing fields worldwide are leveled. People everywhere can innovate without the need of leaving their countries for better op- portunities. The argument, supported by many economis ts, goes that the invention of such technologies as the tele- phone, the computer and the Internet has eroded the im- portance of geographic place; in other words, the tendency toward convergence. Cheshire and Malecki (2004) include a section (page 251) with the subtitle, “The Convergence Industry”. They explain that the source of convergence pursued by econo- mists such as Barro and Sala-i-Martin (1991) [14] is the C opyright © 2012 SciRes. ME  E. NISSAN, F. NIROOMAND 691 assumption of constant or diminishing returns to capital, an assumption which made possible the conclusions re ach - ed by neo-classical economists with respect to m arkets and welfare. Cheshire and Malecki argue that although the n eo - classical model still dominates, new theoretical models have emerged. One of these is that technical progress is now considered endogenous. Another is that increasing returns have become explicit within the microeconomic foundations. Cheshire and Malecki conclude that agglom- eration in loca tion is an important de terminant of techn ol- ogy innovation. Innovation is the result of research and development well identified in relation to highly skilled labor, instituti ons, entrepreneurshi p and environment al and other amenities. Florida (2005) [15] seems to support the views of Chesh- ire and Malecki, arguing that the flat world envisioned by Friedman does not provide an accurate description of re al- ity. Instead, the landscape is not flat but “spiky”. Only few regions in the world matter in regard to cutting-edge innovation. Furthermore, these regions grow higher while the rest of the valleys stagnate. Here are some examples. The economy of the state of New York is the size of Rus - sian or Brazilian economies. The economy of Chicago is on par with that of Sweden. The combined economies of New York, Los Angeles, Chicago and Boston are bigger than that of China. In fact, the economies of the largest forty-seven metropolitan areas in the United States are among the top 100 economies in the world. Other statis- tics invoked by Florida are the nu mber of p atents (300, 000 ) in 2002. Almost 67 percent went to the United States and Japan. Because of globalization, economic growth, inno- vation and prosperity occur in places that can attract cr ea- tive talents. Florida estimated that the talented class world- wide is about 150 million. The above review of literature on the roles of innova- tion and techno logy point at the same time to opin ions in support of convergence as well as to opinions of diver- gence. Kumar and Russell supplied some answers by u s in g data on 57 countries at various income levels for 1965 and 1990. For each period they calculated an efficiency index and output per worker in 1985 prices. They explain that the resulting efficiency index, which measures technical catch-up, is interpreted as the ratio of actual to potential output. It is the distance of the actual output from the best practice production frontier. The assumption is that improvements in efficiency are translated into improve- ments in productivity. The purpose of this paper is disaggregating the data for the 57 countries on the efficiency index and labor pro- ductivity into four segments. Each of these is concerned with a particular set of countries categorized by income level as low, low middle, high middle and high. In each case, the analysis pursued takes on two aspects. The first is testing equality of means and variances between and within the four grouping s of the countries and the second is to propose a measure of convergence for the four groups of countries as well as all the countries. The results of th is research can provide a look into the effect of the trans- mission of technology between and within countries. A further goal is to determine whether the efficiency and technology gaps as proxied by productivity are narrowing overall or there exist multiple stead y states (convergence) for the different groupings of countries. 2. Methodology The methodology followed in this research is based on an a- lysis of variance to test equality of means for efficiency and productivity based on income level into low, low mid - dle, high middle, and high (see Appendix for classifica- tion of countries), and contribution to dispersion between and within these groups of countries. A lso, regression met - hodology is used to test for convergence. The time peri- ods are 1965 and 1990. The choice of this period is in- tentional, as it provides a period of normal adjustments in acquiring technology. Additionally, this period was not affected by the dot.com bubble of the 2000s and the con- sequent market disruptions that followed. One-way an aly- sis of variance is a tool to test equality of means of the four groups. A useful characteristic of analysis of vari- ance, according to Rohatgi (1984) [16], is the partition- ing of total sum of squared deviations into a portion due to between group s and a por tion due to wi thin g roups given by the identity SST = SSB + SSW, (1) where SST is total variation, SSB is variation between the groups and SSW is the variation within the groups. Such a partitioning indicates the relative importance of variation across groups of countries as compared with variation within the various groups. This approach will be utilized for the efficiency index as well as for output per worker for the two periods 1965 and 1990. To deal with the question of convergence, the scheme adopted is regression of each country’s data for 1990 on 1965. The resulting equation is YYbXX Y , (2) where is the expected or predicted value obtained from the regression line for a country’s efficiency index or output per worker, Y is the mean of 1990, X is the observed value in 1965, and X Y is the mean for 1965. When b > 1.00, divergence takes place because countries with effi ciency index values or worker output va lues a b ov e or below the mean in 1965 diverge further from the mean in 1990 when multiplied by a number greater than 1.00. A further use of this model is to observe the difference between 1990 designated by Y and 1965 designated by X by adding and subtracting as follows Copyright © 2012 SciRes. ME 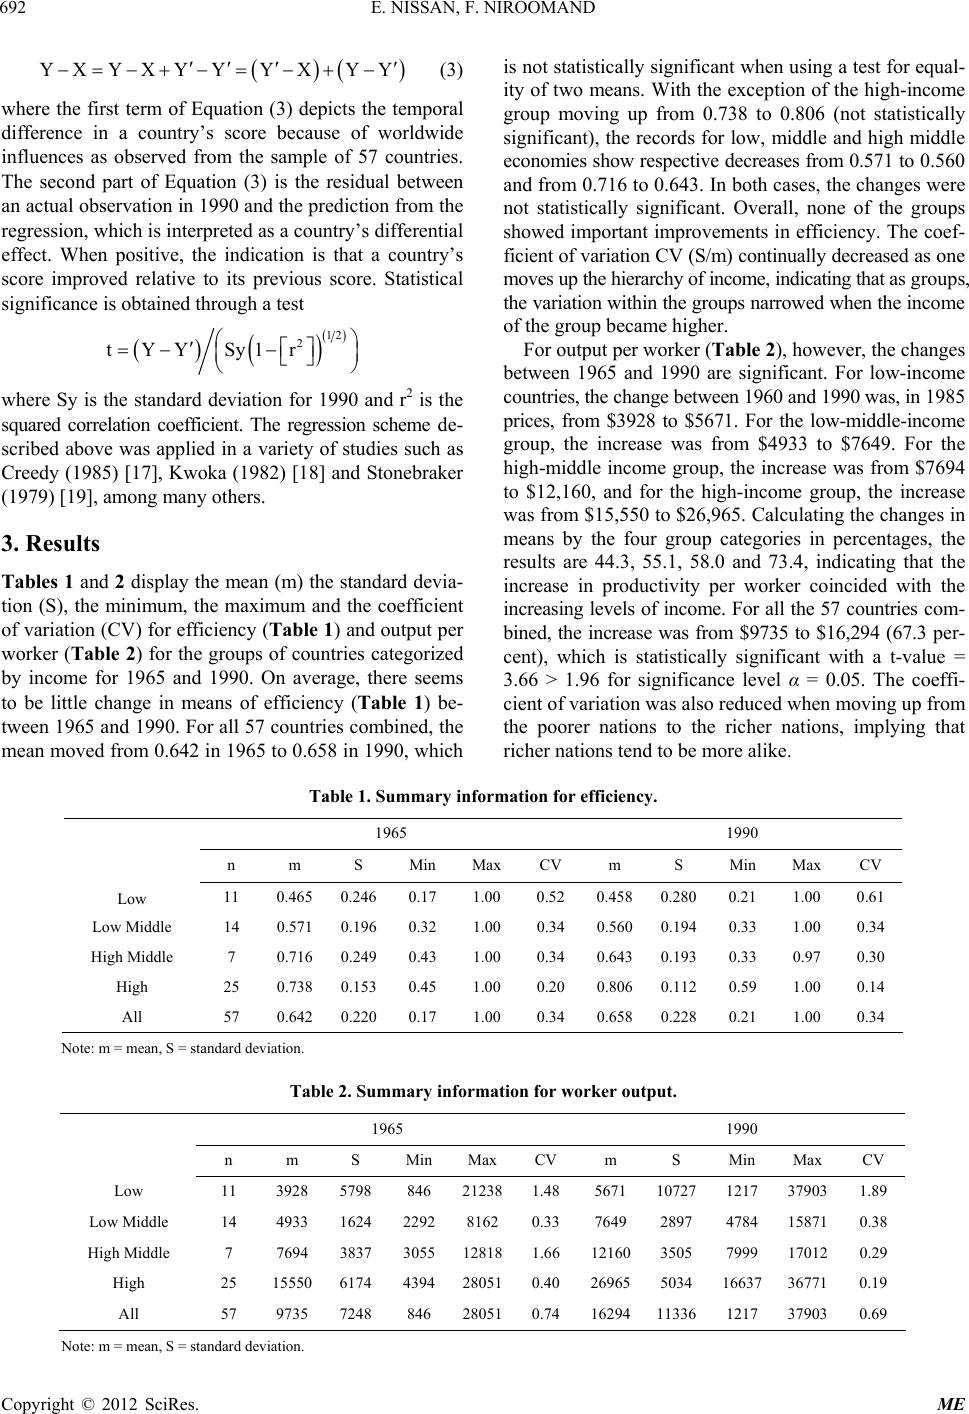 E. NISSAN, F. NIROOMAND Copyright © 2012 SciRes. ME 692 X YY YXYXY YY (3) is not statistically significant when using a test for equal- ity of two means. With the exception of the high-income group moving up from 0.738 to 0.806 (not statistically significant), the records for low, middle and high middle economies show respective decreases from 0.571 to 0.5 60 and from 0.716 to 0.643. In both cases, the changes were not statistically significant. Overall, none of the groups showed important improvements in efficiency. The coef- ficient of variation CV (S/m) continually decreased as o ne moves up the hiera rch y of in come, ind i cating that as groups, the variation within the groups narrowed when the inco me of the group became higher. where the first term of Equation (3) depicts the temporal difference in a country’s score because of worldwide influences as observed from the sample of 57 countries. The second part of Equation (3) is the residual between an actual observation in 1990 and the prediction from the regression, which is interpreted as a country’s differential effect. When positive, the indication is that a country’s score improved relative to its previous score. Statistical significance is obtained through a test 12 2 y1r tYY S For output per worker (Table 2), however, the changes between 1965 and 1990 are significant. For low-income countries, the change between 1960 and 1990 was, in 1985 prices, from $3928 to $5671. For the low-middle-income group, the increase was from $4933 to $7649. For the high-middle income group, the increase was from $7694 to $12,160, and for the high-income group, the increase was from $15,550 to $26,965. Calculating the changes in means by the four group categories in percentages, the results are 44.3, 55.1, 58.0 and 73.4, indicating that the increase in productivity per worker coincided with the increasing levels of income. For all the 57 countries com- bined, the increase was from $9735 to $16,294 (67.3 per- cent), which is statistically significant with a t-value = 3.66 > 1.96 for significance level α = 0.05. The coeffi- cient of variation was also reduced when moving up from the poorer nations to the richer nations, implying that richer nations tend to be more alike. where Sy is the standard deviation for 1990 and r2 is the squared correlation coefficient. The regression scheme de- scribed above was applied in a variety of studies such as Creedy (1985) [17], Kwoka (1982) [18] an d Stonebraker (1979) [19], among many others. 3. Results Tables 1 and 2 display the mean (m) the standard devia- tion (S), the minimum, the maximum and the coefficient of variation (CV) for efficiency (Table 1) and output per worker (Table 2) for the groups of countries categorized by income for 1965 and 1990. On average, there seems to be little change in means of efficiency (Table 1) be- tween 1965 and 1990. For all 57 countries combined, the mean moved from 0.642 in 1965 to 0.658 in 1990, which Table 1. Summary information for efficiency. 1965 1990 n m S Min Max CV m S Min Max CV Low 11 0.465 0.246 0.17 1.00 0.52 0.4580.2800.21 1.00 0.61 Low Middle 14 0.571 0.196 0.32 1.00 0.34 0.5600.1940.33 1.00 0.34 High Middle 7 0.716 0.249 0.43 1.00 0.34 0.6430.1930.33 0.97 0.30 High 25 0.738 0.153 0.45 1.00 0.20 0.8060.1120.59 1.00 0.14 All 57 0.642 0.220 0.17 1.00 0.34 0.6580.2280.21 1.00 0.34 Note: m = mea n, S = standard deviati on. Table 2. Summary information for worker output. 1965 1990 n m S Min Max CV m S Min Max CV Low 11 3928 5798 846 212381.48 5671 107271217 37903 1.89 Low Middle 14 4933 1624 229281620.33 7649 2897 4784 15871 0.38 High Middle 7 7694 3837 3055128181.66 121603505 7999 17012 0.29 High 25 15550 6174 4394280510.40 269655034 16637 36771 0.19 All 57 9735 7248 846 280510.74 16294113361217 37903 0.69 Note: m = mea n, S = standard deviati on.  E. NISSAN, F. NIROOMAND 693 The results of testing equality of means of the four groups of countries in Tables 1 and 2 for the efficiency index and worker productivity for 1965 and 1990 using analysis of variance, as expected, rejected the null hypo t h e- sis with P-values = 0.000. The percent contribution of “between” and “within” variation to total variation ex- pressed in Equation (1) provides evidence of the widen- ing of gaps between the groups for 1965-1990. For the efficiency index, the “Between” portion of the sum of squares between 1965 and 1990 increased from 25.16 per- cent to 38.57 percent. Worker productivity increased f rom 53.31 percent to 73.01 percent. In both cases, the inter- pretation is that these groups of countries aligned by their levels of income, moved apart. Variations “within” the groups, however, showed reductions from 74.84 percent to 61.43 percent for efficiency, and from 46.69 percent to 26.99 percent for productivity, indicating closeness among the four groups of countries. Equation (2), dealing with convergence for the effi- ciency index and output per worker, was done for each of the four groups of economies as well as all the countries. For the efficiency index, the low-income countries with b = 1.026 > 1.00 show divergence. The low-middle- and high-middle-income countries, with values of 0.799 and 0.522, indicate convergence. However, their confidence intervals include “1” which does not rule out the possibility of divergence. For the high-income countries as well as all the countries, the evidence points to convergence, especially when “1” is not included in the interval. For output per worker, certainty of convergence is ap- parent only for the high-income countries because “1” is not included in the confidence interval. This result is si mi - lar in nature to studies on convergence of per-capita in- come. Pritchett (1997) [20] contends that the long-run growth rates in income—reflected in this paper in terms of growth of output per worker—of developed countries tend to converge toward the richest among them. The de- veloping or less developed countries, Pritchett finds, tend to have slower growth rates than do the richer countries, producing divergence in relative income. Testing for statistical significance of the residual (Y) of Equation (3) by the t-test of Equation (4) produced those countries delineating their accomplish- ment for the efficiency index above expectation for one-sided test with significance level α= 0.05 with t = +1.645. The countries are: Finland, Hong Kong, Israel, Italy, and Luxembourg. The countries with accomplish- ment for the efficiency index below expectation with t = –1.645 are: Argentina, Chile, Dominican Republic, Ivory Coast, Madagascar, Peru, and Zambia. For output per worker, the countries performing above expectation are: Ireland, Italy, Japan, South Korea, Spain, and Taiwan. Countries performing below expectation for output per worker are: Argentina, New Zealand, and Peru. 4. Conclusions Shibusawa (2000) [21] explains that in urban economies, physical space and, because of new technologies, cyber- space, new theoretical models incorporating the activities of the two modes of production are needed. Shibusawa cha racterizes physical spac e by physical d istan ce and space. In cyberspace, there is no real distance or space. By us- ing virtual reality technology, residents in urban spaces can experience physical space virtually in cyberspace. An example is the consumption of physical goods that can be bought at virtual malls in cyberspace using virtual reality technology. Shibusawa integrates the two in a new format of a production. Their type of effort is a sort of applied work to cope with the concept of singularity ad- vanced by Kurzweil. The two modes of production, physical space and cy- berspace, entail the creation of two types of skills that can lead to income inequality. Wessell (2006) [22] states that a feature of the US economy in th e past quarter cen- tury is a sharp rise in income inequality. The question is what caused this inequality. Is it computer technology? Is it education? Here are some statistics. About 11 percent of total income (not including capital gains) in 2003 was garnered by half of one percent of workers. The same group twenty-five years earlier received 5.25 percent of total income. In spite of robust econo mic growth and p ro- ductivity in the past few years, wages of typical workers did not rise. The big money is going to those at the top, those who leveraged computers to be more productive a nd , ironically, to many low-wage workers who work for the top earners in such capacities as janitors, waiters, garden- ers and massage therapists. The middle, whose jobs are threatened by computers and overseas workers, lost ground. The above comments direct attention to the role of tech - nology in shaping economic wellbeing in a modern soci- ety. Therefore, Kumar and Russell’s studies relating to production efficiency and productivity between 1965 and 1990 for some 57 countries are important to find out whe- ther the leveling of the playing fields (the world is flat) envisioned by Friedman or the opposing view of Florida (the world is spiky) is more prevalent. Y This paper utilized the data of Kumar and Russell on efficiency and output per worker to find some answers. The conclusions of this paper concerning inequality be- tween and within countries grouped according to their lev- els of income is that inter-country components of disper- sion for efficiency and worker productivity have increa sed in recent years. In other wor ds , the gaps be tween the groups of countries increased between 1965 and 1990. This re- sult gives credence to Florida’s view in that the privi- leged groups of countries in 1965 became more privi- leged in 1990. This result is also enforced when looking Copyright © 2012 SciRes. ME 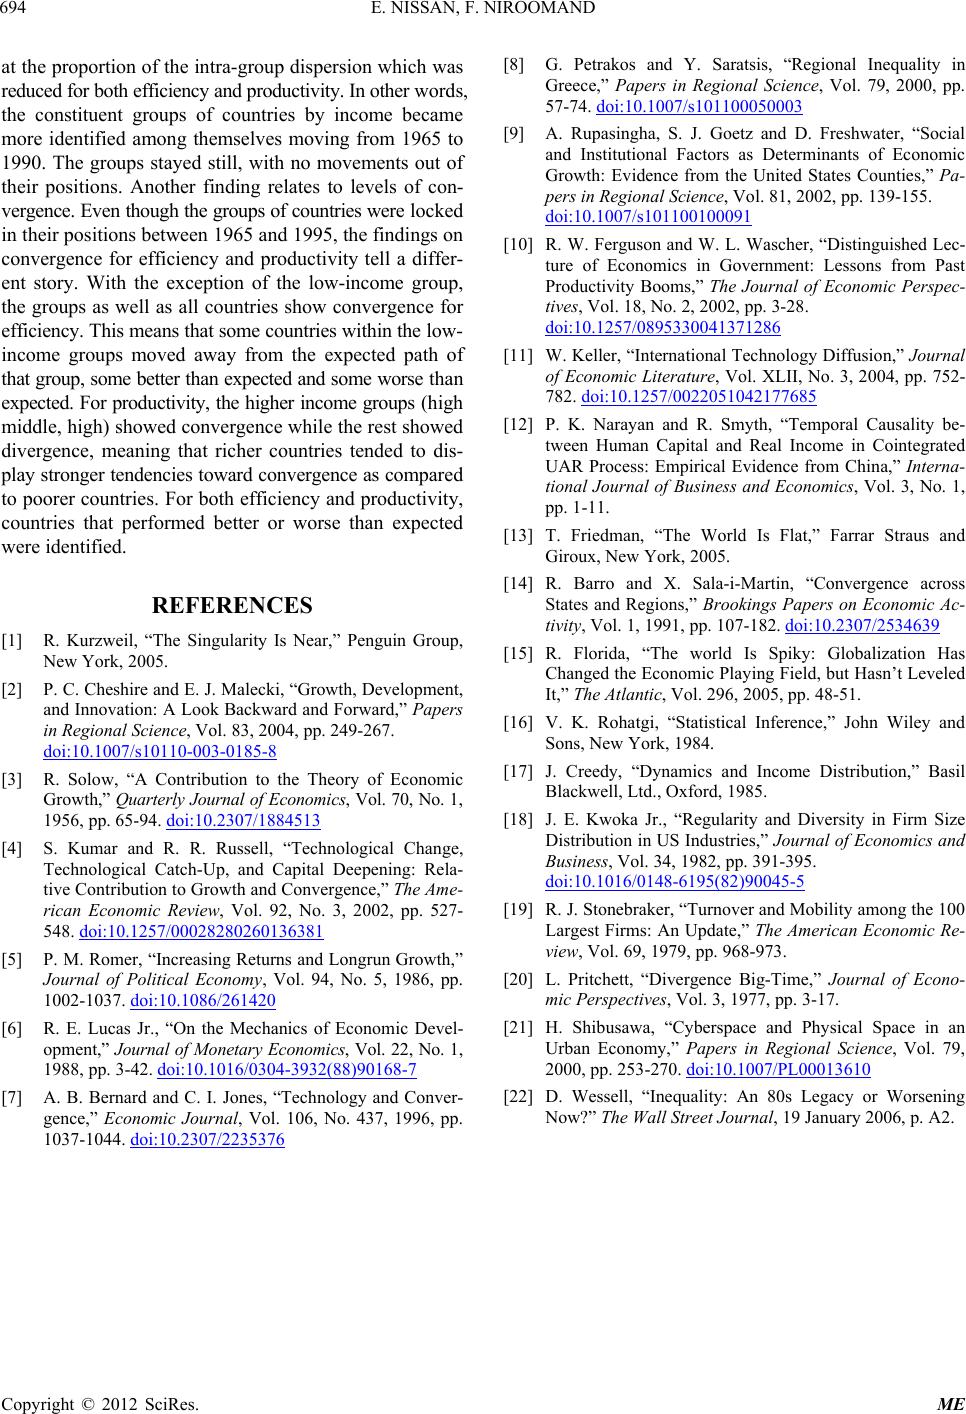 E. NISSAN, F. NIROOMAND 694 at the proportion of the intra-group dispersion which was reduced for both efficiency and productivity. In other words, the constituent groups of countries by income became more identified among themselves moving from 1965 to 1990. The groups stayed still, with no movements out of their positions. Another finding relates to levels of con- vergence. Even though the group s of coun tries were lo c k e d in their positions between 1965 and 1995, the findings on convergence for efficiency and productivity tell a differ- ent story. With the exception of the low-income group, the groups as well as all countries show convergence for efficiency. This means that some countries within the lo w- income groups moved away from the expected path of that group, some better than expected and some worse t ha n expected. For productivity, th e higher income groups (hi gh middle, high) showed convergence while the rest showed divergence, meaning that richer countries tended to dis- play stronger tendencies toward convergence as compar ed to poorer countries. For both efficiency and productivity, countries that performed better or worse than expected were identified. REFERENCES [1] R. Kurzweil, “The Singularity Is Near,” Penguin Group, New York, 2005. [2] P. C. Cheshire and E. J. Malecki, “Growth, Development, and Innovation: A Look Backward and Forward,” Papers in Regional Science, Vol. 83, 2004, pp. 249-267. doi:10.1007/s10110-003-0185-8 [3] R. Solow, “A Contribution to the Theory of Economic Growth,” Quarterly Journal of Economics, Vol. 70, No. 1, 1956, pp. 65-94. doi:10.2307/1884513 [4] S. Kumar and R. R. Russell, “Technological Change, Technological Catch-Up, and Capital Deepening: Rela- tive Contribution to Growth and Convergence,” The Ame- rican Economic Review, Vol. 92, No. 3, 2002, pp. 527- 548. doi:10.1257/00028280260136381 [5] P. M. Romer, “Increasing Returns and Longrun Growth,” Journal of Political Economy, Vol. 94, No. 5, 1986, pp. 1002-1037. doi:10.1086/261420 [6] R. E. Lucas Jr., “On the Mechanics of Economic Devel- opment,” Journal of Monetary Economics, Vol. 22, No. 1, 1988, pp. 3-42. doi:10.1016/0304-3932(88)90168-7 [7] A. B. Bernard and C. I. Jones, “Technology and Conver- gence,” Economic Journal, Vol. 106, No. 437, 1996, pp. 1037-1044. doi:10.2307/2235376 [8] G. Petrakos and Y. Saratsis, “Regional Inequality in Greece,” Papers in Regional Science, Vol. 79, 2000, pp. 57-74. doi:10.1007/s101100050003 [9] A. Rupasingha, S. J. Goetz and D. Freshwater, “Social and Institutional Factors as Determinants of Economic Growth: Evidence from the United States Counties,” Pa- pers in Regional Science, Vol. 81, 2002, pp. 139-155. doi:10.1007/s101100100091 [10] R. W. Ferguson and W. L. Wascher, “Distinguished Lec- ture of Economics in Government: Lessons from Past Productivity Booms,” The Journal of Economic Perspec- tives, Vol. 18, No. 2, 2002, pp. 3-28. doi:10.1257/0895330041371286 [11] W. Keller, “International Technology Diffusion,” Journal of Economic Literature, Vol. XLII, No. 3, 2004, pp. 752- 782. doi:10.1257/0022051042177685 [12] P. K. Narayan and R. Smyth, “Temporal Causality be- tween Human Capital and Real Income in Cointegrated UAR Process: Empirical Evidence from China,” Interna- tional Journal of Business and Economics, Vol. 3, No. 1, pp. 1-11. [13] T. Friedman, “The World Is Flat,” Farrar Straus and Giroux, New York, 2005. [14] R. Barro and X. Sala-i-Martin, “Convergence across States and Regions,” Brookings Papers on Economic Ac- tivity, Vol. 1, 1991, pp. 107-182. doi:10.2307/2534639 [15] R. Florida, “The world Is Spiky: Globalization Has Changed the Economic Playing Field, but Hasn’t Leveled It,” The Atlantic, Vol. 296, 2005, pp. 48-51. [16] V. K. Rohatgi, “Statistical Inference,” John Wiley and Sons, New York, 1984. [17] J. Creedy, “Dynamics and Income Distribution,” Basil Blackwell, Ltd., Oxford, 1985. [18] J. E. Kwoka Jr., “Regularity and Diversity in Firm Size Distribution in US Industries,” Journal of Economics and Business, Vol. 34, 1982, pp. 391-395. doi:10.1016/0148-6195(82)90045-5 [19] R. J. Stonebraker, “Turnover and Mobility among the 100 Largest Firms: An Update,” The American Economic Re- view, Vol. 69, 1979, pp. 968-973. [20] L. Pritchett, “Divergence Big-Time,” Journal of Econo- mic Perspectives, Vol. 3, 1977, pp. 3-17. [21] H. Shibusawa, “Cyberspace and Physical Space in an Urban Economy,” Papers in Regional Science, Vol. 79, 2000, pp. 253-270. doi:10.1007/PL00013610 [22] D. Wessell, “Inequality: An 80s Legacy or Worsening Now?” The Wall Street Journal, 19 January 2006, p. A2. Copyright © 2012 SciRes. ME |