

Paper Menu >>
Journal Menu >>
 Modern Economy, 2012, 3, 617-625 http://dx.doi.org/10.4236/me.2012.35081 Published Online September 2012 (http://www.SciRP.org/journal/me) Kuznets Curves Stratified by Mean per Capita Income, 1969-2007: Implications Regarding Global Economic Development and Income Inequality* Jack E. Riggs1, Jeffrey C. Hobbs2, Gerald R. Hobbs3, Todd H. Riggs4 1Department of Neurology, West Virginia University, Morgantown, USA 2Department of Finance, Banking and Insurance, Appalachian State University, Boone, USA 3Department of Statistics, West Virginia University, Morgantown, USA 4159th Aviation Brigade, United States Army, Fort Campbell, USA Email: [email protected], hobbsjc@appstate.edu, [email protected]du, [email protected] Received June 6, 2012; revised July 5, 2012; accepted July 14, 2012 ABSTRACT A Kuznets curve, based upon GDP and population estimates for the years 1969 through 2007 from 36 nations and re- gions comprising the entire global economy and population, has been previously demonstrated. This global Kuznets curve of income in equality was a mathematical co nsequen ce of the definition of income inequality used (th e coefficient of variation, which is the standard deviation divided by the mean) and two observations; the standard deviation of population-weighted national/regional mean per capita income increased linearly, and the mean global per capita in- come increased exponentially over the period investigated. In this analysis, these same 36 nations/regions were strati- fied into three groups based upon their 1969 mean per capita income to determine if those observations were also ap- plicable to this subgroup analysis. This study demonstrated that between 1969 and 2007, population-weighed income inequality actually increased in the two rich est grou ps and decreased in the po orest group. Th is observation was primar- ily produced by the finding that the exponential rate of growth of the population-weighted mean per capita income in the poorest group was nearly twice that of the two richest groups. This finding suggests that Kuznets hypothesis that increasing income inequality was an early feature of economic dev elopment and that decreasing income inequality was a late feature of economic development is not applicable to a global economy stratified on the basis of mean per capita income. Keywords: Economic Development; Global Economy; Income Inequality; Ku znets Curve 1. Introduction Kuznets [1] hypothesized that national economic devel- opment was associated initially with increasing income inequality followed by decreasing income inequality, w hich describes the distinctive inverted U shape Kuznets curve. Kuznets [1] postulated that this relationship between eco- nomic development an d income inequality was produced by the combined effects of urbanization and industriali- zation and was associated with the movement of labor fr om lower paying rural agricultural jobs to higher paying ur- ban industrial jobs. Kuznets curves have only been varia- bly found within nations and regions [2-6]. However, the vast majority of the world’s income inequality is between - nation and not within-nation [7,8]. Using population and GDP data from 1969 through 2007 from 36 nations and regions that comprised the entire global economy, a gl o bal Kuznets curve was previously demonstrated [9]. Further- more, it was suggested that this global Kuznets curve of income inequa lity was actually a m athem atical consequence of the definitio n of income in equality used (t he coeffici en t of variation) and two observations; the standard deviation of population-weighted national/regional mean p er capita income was increasing linearly, and the mean global per capita income was increasing exponentially [9]. In this study, we sought to determine whether those observations regarding the production of the global Kuznets curve would also exist if th e global economy were stratified on the b as i s of mean per capita income. 2. Data and Methods National and regional population and gross domestic pro d- uct (GDP) estimates (in dollars adjusted to the year 2000) from 1969 through 2007 were obtained from the Econ o mi c Research Service of the United Sta tes Department of Ag ri - culture (www.ers.usda.g ov). This da ta set repr esented th e *The opinions and assertions herein are those of the authors and do not necessarily reflect those of the United States Army. C opyright © 2012 SciRes. ME 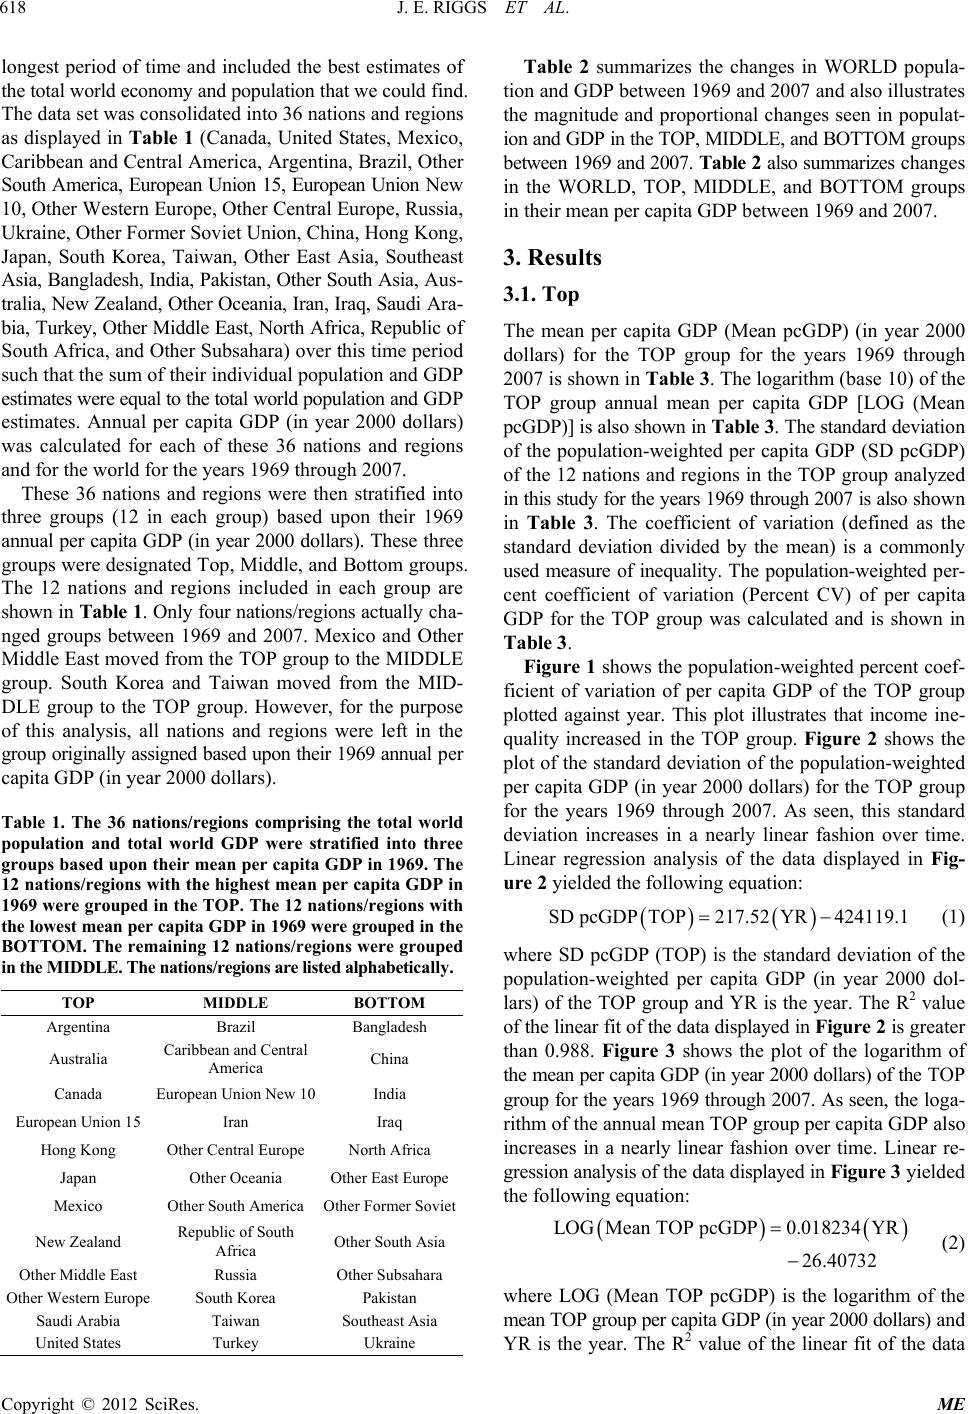 J. E. RIGGS ET AL. 618 longest period of time and included the best estimates of the total world economy and population that we could fi n d . The data set was consolidated into 36 nations and regions as displayed in Table 1 (Canada, United States, Mexico, Caribbean and Central America, Argentina, Brazil, Other South America, European Union 15, European Union New 10, Other Western Europe, Other Central Europe, Russia, Ukraine, Other Former Soviet Union, China, Hong Kong, Japan, South Korea, Taiwan, Other East Asia, Southeast Asia, Bangladesh, India, Pakistan, Other South Asia, Aus - tralia, New Zealand, Other Oceania, Iran, Iraq, Saudi Ar a- bia, Turkey, Other Middle East, North Africa, Republic of South Africa, and Other Subsahara) over this time per iod such that the sum of their individual population and GDP estimates were equal to the total world population and G DP estimates. Annual per capita GDP (in year 2000 dollars) was calculated for each of these 36 nations and regions and for the world for the years 1969 through 2007. These 36 nations and regions were then stratified into three groups (12 in each group) based upon their 1969 annual per capita GDP (in year 2000 dollars). These thr ee groups were designated Top, Middle, and Bottom groups. The 12 nations and regions included in each group are shown in Table 1. Only four nations/regions actually ch a- nged groups between 1969 and 2007. Mexico and Other Middle East moved from the TOP group to the MIDDLE group. South Korea and Taiwan moved from the MID- DLE group to the TOP group. However, for the purpose of this analysis, all nations and regions were left in the group originally assigned based upon their 1969 annual pe r capita GDP (in year 2000 dollars). Table 1. The 36 nations/regions comprising the total world population and total world GDP were stratified into three groups based upon their mean per capita GDP in 1969. The 12 nations/regions with the highest mean per capita GDP in 1969 were grouped in the TOP. The 12 nations/regions with the lowest mean per capita GDP in 1969 w ere grouped in t he BOTTOM. The remaining 12 nations/regions were grouped in the MI DDLE. Th e n ations /re gions ar e lis ted alp habet ically. TOP MIDDLE BOTTOM Argentina Brazil Bangladesh Australia Caribbean and Central America China Canada European Union New 10 India European Union 15 Iran Iraq Hong Kong Other Central Europe North Africa Japan Other Oceania Other East Europe Mexico Other South America Other Former Soviet New Zealand Republic of South Africa Other South Asia Other Middle East Russia Other Subsahara Other Western Europe South Korea Pakistan Saudi Arabia Taiwan Southeast Asia United States Turkey Ukraine Table 2 summarizes the changes in WORLD popula- tion and GDP between 1969 and 2007 and also illu strates the magnitude and proportional changes seen in populat- ion and GDP in the TOP, MIDDLE, and BOTTOM g r o u p s between 1969 and 2007. Ta ble 2 also summarizes ch an ge s in the WORLD, TOP, MIDDLE, and BOTTOM groups in their mean per capita GDP between 1969 and 2007. 3. Results 3.1. Top The mean per capita GDP (Mean pcGDP) (in year 2000 dollars) for the TOP group for the years 1969 through 2007 is shown in Ta ble 3. The logarithm (base 10) of the TOP group annual mean per capita GDP [LOG (Mean pcGDP)] is also shown in Table 3. The standard deviation of the population-weighted per capita GDP (SD pcGDP) of the 12 nations and regions in the TOP group analyzed in this study for the years 1969 through 2007 is also s ho wn in Table 3. The coefficient of variation (defined as the standard deviation divided by the mean) is a commonly used measure of inequality. The population-weighted per- cent coefficient of variation (Percent CV) of per capita GDP for the TOP group was calculated and is shown in Table 3. Figure 1 shows the population-weighted percent coef- ficient of variation of per capita GDP of the TOP group plotted against year. This plot illustrates that income ine- quality increased in the TOP group. Figure 2 shows the plot of the standard deviation of the population-weighted per capita GDP (in year 2000 dollars) for the TO P group for the years 1969 through 2007. As seen, this standard deviation increases in a nearly linear fashion over time. Linear regression analysis of the data displayed in Fig- ure 2 yielded the following equation: SD pcGDPTOP217.52YR424119.1 (1) where SD pcGDP (TOP) is the standard deviation of the population-weighted per capita GDP (in year 2000 dol- lars) of the TOP group and YR is the year. The R2 value of the linear fit of the data displayed in Figure 2 is greater than 0.988. Figure 3 shows the plot of the logarithm of the mean per cap ita GDP (in year 2000 do llars) of the T O P group for the years 1969 through 2007. As seen, the log a- rithm of the annual mean TOP group per capita GDP also increases in a nearly linear fashion over time. Linear re- gression analysis of the data displayed in Figure 3 yielded the following equ ation: LOGMeanTOP pcGDP0.018234YR 26.40732 (2) where LOG (Mean TOP pcGDP) is the logarithm of the mean TOP group per capita GDP (in year 2000 dollars) a nd YR is the year. The R2 value of the linear fit of the data Copyright © 2012 SciRes. ME 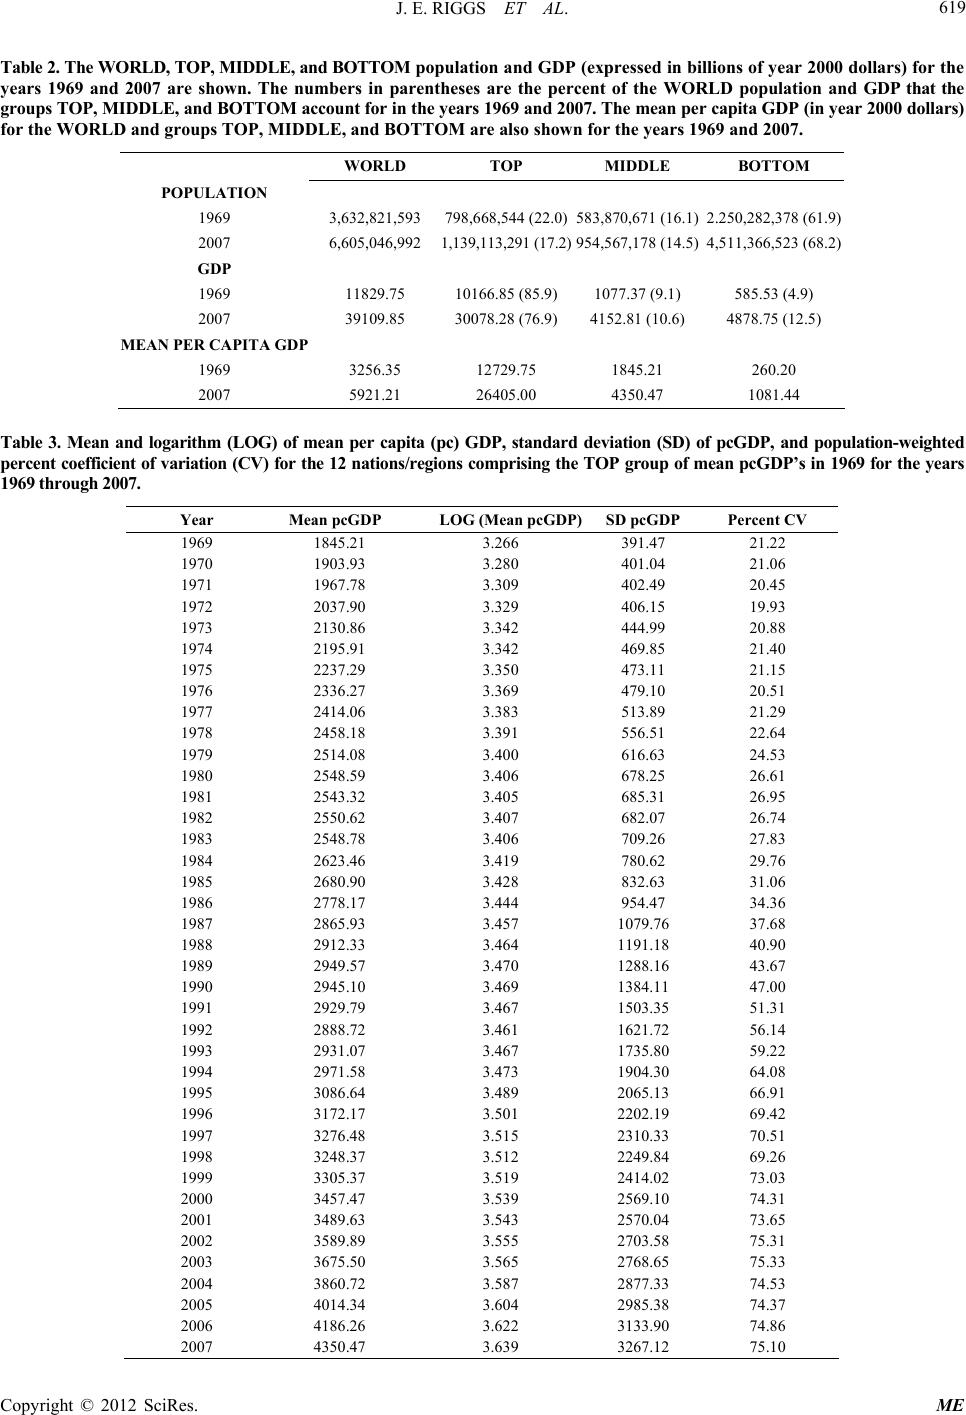 J. E. RIGGS ET AL. Copyright © 2012 SciRes. ME 619 Table 2. The WORLD, TOP, MIDDLE, and BOTTOM p op ul at ion and GDP (expressed in billions of year 2000 dollars) for the years 1969 and 2007 are shown. The numbers in parentheses are the percent of the WORLD population and GDP that the groups TOP, MIDDLE, and BOTTOM account f or i n the years 19 69 and 200 7. The mea n pe r capit a GDP (i n ye ar 2000 doll ars) for the WORLD and groups TOP, MIDDLE, and BOTTOM are also shown for the years 1969 and 2007. WORLD TOP MIDDLE BOTTOM POPULATION 1969 3,632,821,593 798,668,544 (22.0)583,870,671 (16.1)2.250,282,378 (61.9) 2007 6,605,046,992 1,139,113,291 (17.2)954,567,178 (14.5)4,511,366,523 (68.2) GDP 1969 11829.75 10166.85 (85.9)1077.37 (9.1) 585.53 (4.9) 2007 39109.85 30078.28 (76.9)4152.81 (10.6) 4878.75 (12.5) MEAN PER CAPITA GDP 1969 3256.35 12729.75 1845.21 260.20 2007 5921.21 26405.00 4350.47 1081.44 Table 3. Mean and logarithm (LOG) of mean per capita (pc) GDP, standard deviation (SD) of pcGDP, and population-weighted percent coefficient of vari ation (CV) for the 12 nations/regions comprising the TOP group of mean pcGDP’s in 1969 for the years 1969 through 2007. Year Mean pcGDP LOG (Mean pcGDP)SD pcGDP Percent CV 1969 1845.21 3.266 391.47 21.22 1970 1903.93 3.280 401.04 21.06 1971 1967.78 3.309 402.49 20.45 1972 2037.90 3.329 406.15 19.93 1973 2130.86 3.342 444.99 20.88 1974 2195.91 3.342 469.85 21.40 1975 2237.29 3.350 473.11 21.15 1976 2336.27 3.369 479.10 20.51 1977 2414.06 3.383 513.89 21.29 1978 2458.18 3.391 556.51 22.64 1979 2514.08 3.400 616.63 24.53 1980 2548.59 3.406 678.25 26.61 1981 2543.32 3.405 685.31 26.95 1982 2550.62 3.407 682.07 26.74 1983 2548.78 3.406 709.26 27.83 1984 2623.46 3.419 780.62 29.76 1985 2680.90 3.428 832.63 31.06 1986 2778.17 3.444 954.47 34.36 1987 2865.93 3.457 1079.76 37.68 1988 2912.33 3.464 1191.18 40.90 1989 2949.57 3.470 1288.16 43.67 1990 2945.10 3.469 1384.11 47.00 1991 2929.79 3.467 1503.35 51.31 1992 2888.72 3.461 1621.72 56.14 1993 2931.07 3.467 1735.80 59.22 1994 2971.58 3.473 1904.30 64.08 1995 3086.64 3.489 2065.13 66.91 1996 3172.17 3.501 2202.19 69.42 1997 3276.48 3.515 2310.33 70.51 1998 3248.37 3.512 2249.84 69.26 1999 3305.37 3.519 2414.02 73.03 2000 3457.47 3.539 2569.10 74.31 2001 3489.63 3.543 2570.04 73.65 2002 3589.89 3.555 2703.58 75.31 2003 3675.50 3.565 2768.65 75.33 2004 3860.72 3.587 2877.33 74.53 2005 4014.34 3.604 2985.38 74.37 2006 4186.26 3.622 3133.90 74.86 2007 4350.47 3.639 3267.12 75.10 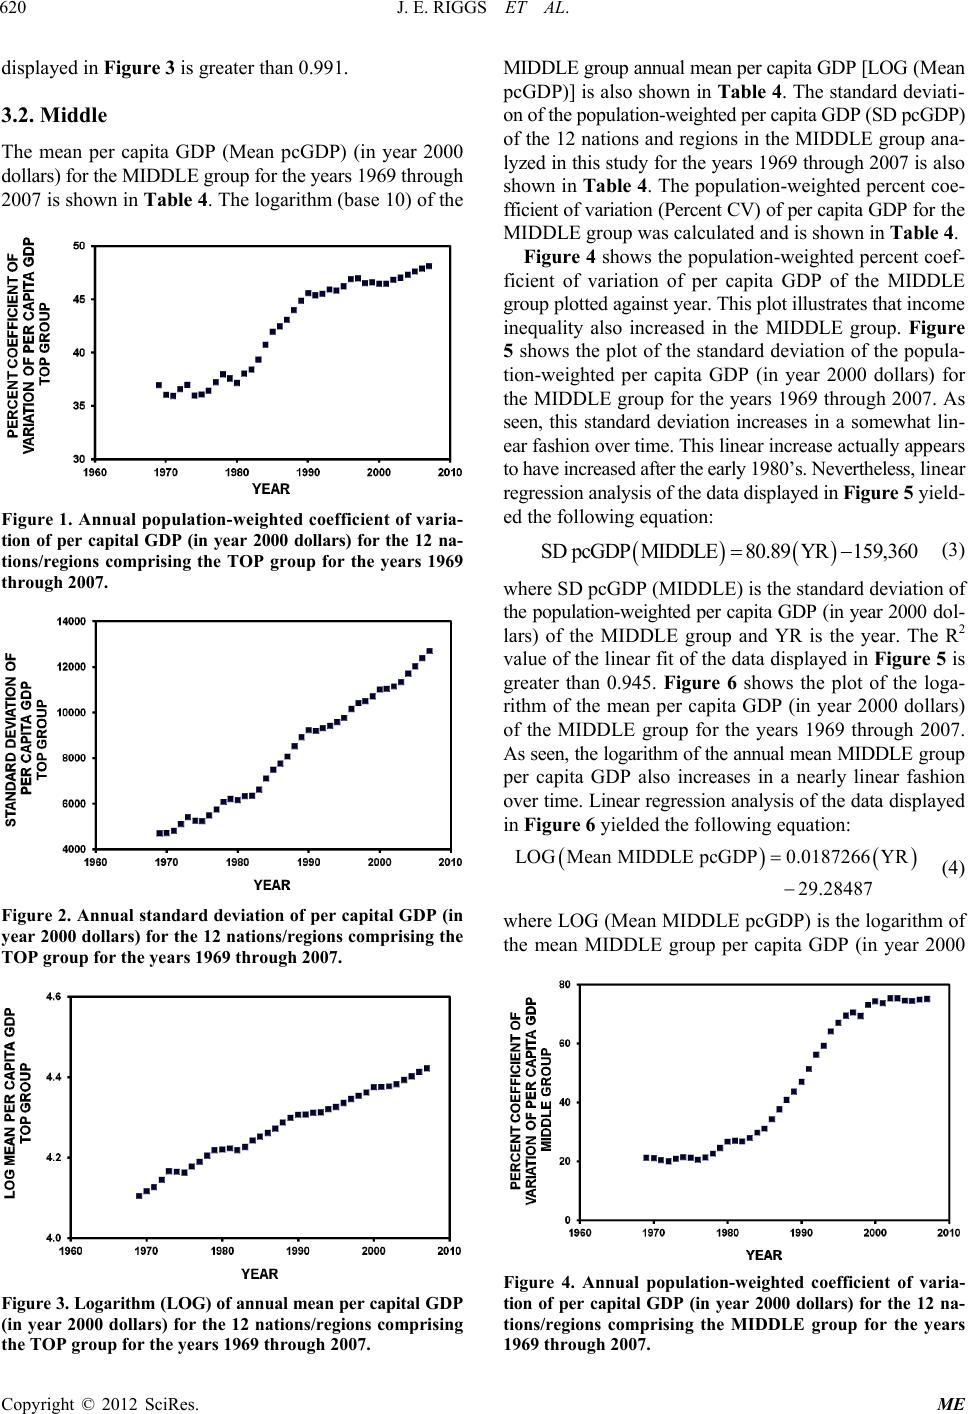 J. E. RIGGS ET AL. 620 displayed in Figure 3 is greater than 0.991. 3.2. Middle The mean per capita GDP (Mean pcGDP) (in year 2000 dollars) for the MIDDLE group for the y ears 1969 through 2007 is shown in Ta ble 4. The logarithm (base 10) of the Figure 1. Annual population-weighted coefficie nt of varia- tion of per capital GDP (in year 2000 dollars) for the 12 na- tions/regions comprising the TOP group for the years 1969 through 2007. Figure 2. Annual standard de viation of per capital GDP (in year 2000 dollars) for the 12 nations/regions comprising the TOP group for the years 1969 through 2007. Figure 3. Logarithm (LOG) of annual mea n per capital G DP (in year 2000 dollars) for the 12 nations/regions comprising the TOP group for the years 1969 through 2007. MIDDLE group annual mean p er cap ita GD P [LOG (M ea n pcGDP)] is also shown in Table 4. The standard deviati- on of the population-weighted per capita GDP (SD pcGDP) of the 12 nations and regions in the MIDDLE group ana- lyzed in this st udy for the years 1969 thro ugh 2007 is a lso shown in Table 4. The population-weighted percent coe- fficient of variation (Percent CV) of per capita GDP for t h e MIDDLE group was calculated and is shown in Table 4. Figure 4 shows the population-weighted percent coef- ficient of variation of per capita GDP of the MIDDLE group plotted against year. This plot illustrates that income inequality also increased in the MIDDLE group. Figure 5 shows the plot of the standard deviation of the popula- tion-weighted per capita GDP (in year 2000 dollars) for the MIDDLE group for the years 1969 throu gh 2007. As seen, this standard deviation increases in a somewhat lin- ear fashion over time. This lin ear increas e ac tually appea rs to have increased after the early 1980’s. Nevertheless, linear regression analysis of the data display ed i n Figure 5 yield- ed the following eq uation: SD pcGDPMIDDLE80.89YR159,360 (3) where SD pcGDP (MIDDLE) is the standard deviation of the population-weighted per capita GDP (in year 2000 do l- lars) of the MIDDLE group and YR is the year. The R2 value of the linear fit of the data displayed in Figure 5 is greater than 0.945. Figure 6 shows the plot of the loga- rithm of the mean per capita GDP (in year 2000 dollars) of the MIDDLE group for the years 1969 through 2007. As seen, the logarithm of the annual mean MIDDLE g ro up per capita GDP also increases in a nearly linear fashion over time. Linear regression analysis of the data displa yed in Figure 6 yielded the following equation: LOGMean MIDDLE pcGDP0.0187266YR 29.28487 (4) where LOG (Mean MIDDLE pcGDP) is the logarithm of the mean MIDDLE group per capita GDP (in year 2000 Figure 4. Annual population-weighted coefficient of varia- tion of per capital GDP (in year 2000 dollars) for the 12 na- tions/regions comprising the MIDDLE group for the years 1969 through 2007. Copyright © 2012 SciRes. ME 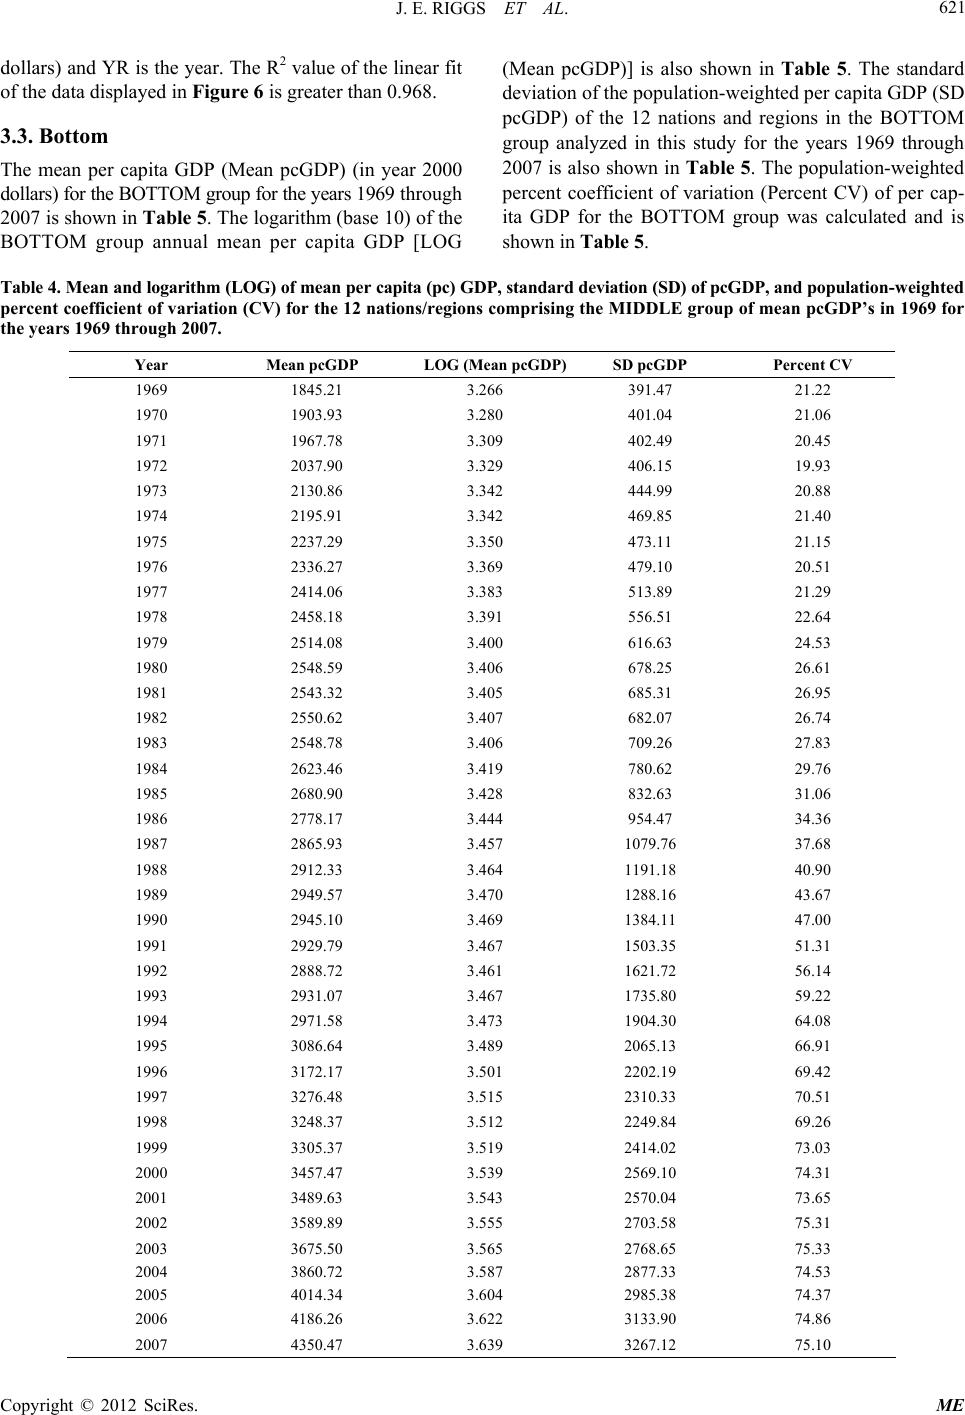 J. E. RIGGS ET AL. 621 dollars) and YR is the year. The R2 value of the linear fit of the data display e d in Figure 6 is greater than 0.968. 3.3. Bottom The mean per capita GDP (Mean pcGDP) (in year 2000 dollars) for the BOTTOM group for the years 1969 t hro ugh 2007 is shown in Ta ble 5. The logarithm (base 10) of the BOTTOM group annual mean per capita GDP [LOG (Mean pcGDP)] is also shown in Table 5. The standard deviation of the population-weighted per capita GDP (SD pcGDP) of the 12 nations and regions in the BOTTOM group analyzed in this study for the years 1969 through 2007 is also shown in Table 5. Th e population-weighted percent coefficient of variation (Percent CV) of per cap- ita GDP for the BOTTOM group was calculated and is shown in Table 5. Table 4. Mean and logarithm (LOG) of mean pe r capita (pc) GDP, sta ndar d de viatio n ( SD) of pcGDP, and population- weigh ted percent coefficient of variation (CV) for the 12 nations/regions comprising the MIDDLE group of mean pcGDP’s in 1969 for the years 1969 through 2007. Year Mean pcGDP LOG (Mean pcGDP)SD pcGDP Percent CV 1969 1845.21 3.266 391.47 21.22 1970 1903.93 3.280 401.04 21.06 1971 1967.78 3.309 402.49 20.45 1972 2037.90 3.329 406.15 19.93 1973 2130.86 3.342 444.99 20.88 1974 2195.91 3.342 469.85 21.40 1975 2237.29 3.350 473.11 21.15 1976 2336.27 3.369 479.10 20.51 1977 2414.06 3.383 513.89 21.29 1978 2458.18 3.391 556.51 22.64 1979 2514.08 3.400 616.63 24.53 1980 2548.59 3.406 678.25 26.61 1981 2543.32 3.405 685.31 26.95 1982 2550.62 3.407 682.07 26.74 1983 2548.78 3.406 709.26 27.83 1984 2623.46 3.419 780.62 29.76 1985 2680.90 3.428 832.63 31.06 1986 2778.17 3.444 954.47 34.36 1987 2865.93 3.457 1079.76 37.68 1988 2912.33 3.464 1191.18 40.90 1989 2949.57 3.470 1288.16 43.67 1990 2945.10 3.469 1384.11 47.00 1991 2929.79 3.467 1503.35 51.31 1992 2888.72 3.461 1621.72 56.14 1993 2931.07 3.467 1735.80 59.22 1994 2971.58 3.473 1904.30 64.08 1995 3086.64 3.489 2065.13 66.91 1996 3172.17 3.501 2202.19 69.42 1997 3276.48 3.515 2310.33 70.51 1998 3248.37 3.512 2249.84 69.26 1999 3305.37 3.519 2414.02 73.03 2000 3457.47 3.539 2569.10 74.31 2001 3489.63 3.543 2570.04 73.65 2002 3589.89 3.555 2703.58 75.31 2003 3675.50 3.565 2768.65 75.33 2004 3860.72 3.587 2877.33 74.53 2005 4014.34 3.604 2985.38 74.37 2006 4186.26 3.622 3133.90 74.86 2007 4350.47 3.639 3267.12 75.10 Copyright © 2012 SciRes. ME 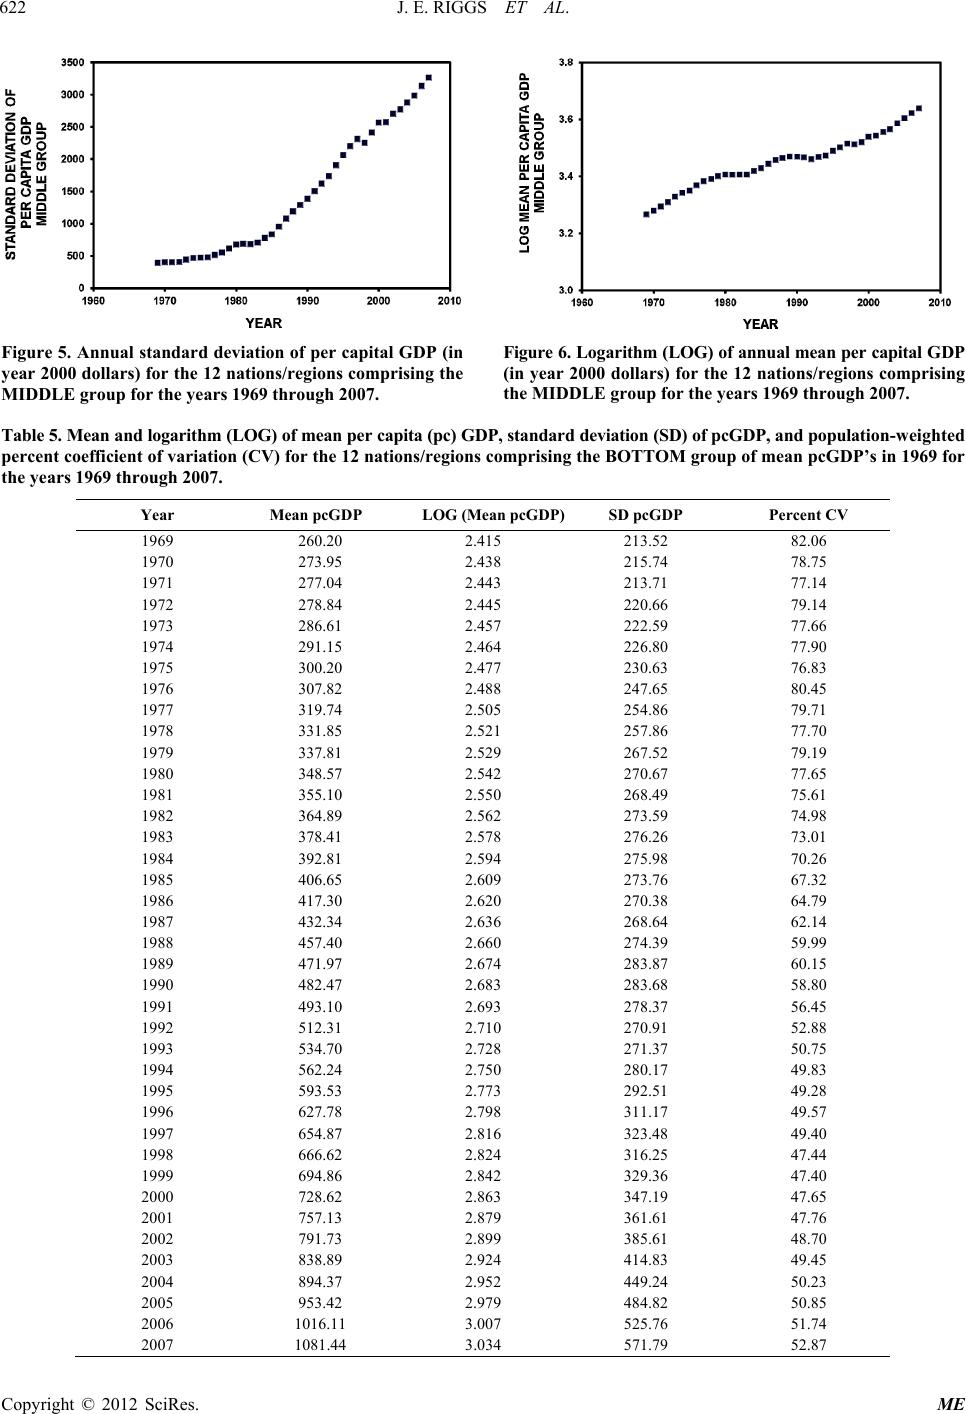 J. E. RIGGS ET AL. 622 Figure 5. Annual standard de viation of per capital GDP (in year 2000 dollars) for the 12 nations/regions comprising the MIDDLE group for the years 1969 through 2007. Figure 6. Logarithm (LOG) of annual mea n per capital G DP (in year 2000 dollars) for the 12 nations/regions comprising the MIDDLE group for the years 1969 through 2007. Table 5. Mean and logarithm (LOG) of mean pe r capita (pc) GDP, sta ndar d de viatio n ( SD) of pcGDP, and population- weigh ted percent coefficient of variation (CV) for the 12 nations/regions comprising the BOTTOM group of mean pcGDP’s in 1969 for the years 1969 through 2007. Year Mean pcGDP LOG (Mean pcGDP)SD pcGDP Percent CV 1969 260.20 2.415 213.52 82.06 1970 273.95 2.438 215.74 78.75 1971 277.04 2.443 213.71 77.14 1972 278.84 2.445 220.66 79.14 1973 286.61 2.457 222.59 77.66 1974 291.15 2.464 226.80 77.90 1975 300.20 2.477 230.63 76.83 1976 307.82 2.488 247.65 80.45 1977 319.74 2.505 254.86 79.71 1978 331.85 2.521 257.86 77.70 1979 337.81 2.529 267.52 79.19 1980 348.57 2.542 270.67 77.65 1981 355.10 2.550 268.49 75.61 1982 364.89 2.562 273.59 74.98 1983 378.41 2.578 276.26 73.01 1984 392.81 2.594 275.98 70.26 1985 406.65 2.609 273.76 67.32 1986 417.30 2.620 270.38 64.79 1987 432.34 2.636 268.64 62.14 1988 457.40 2.660 274.39 59.99 1989 471.97 2.674 283.87 60.15 1990 482.47 2.683 283.68 58.80 1991 493.10 2.693 278.37 56.45 1992 512.31 2.710 270.91 52.88 1993 534.70 2.728 271.37 50.75 1994 562.24 2.750 280.17 49.83 1995 593.53 2.773 292.51 49.28 1996 627.78 2.798 311.17 49.57 1997 654.87 2.816 323.48 49.40 1998 666.62 2.824 316.25 47.44 1999 694.86 2.842 329.36 47.40 2000 728.62 2.863 347.19 47.65 2001 757.13 2.879 361.61 47.76 2002 791.73 2.899 385.61 48.70 2003 838.89 2.924 414.83 49.45 2004 894.37 2.952 449.24 50.23 2005 953.42 2.979 484.82 50.85 2006 1016.11 3.007 525.76 51.74 2007 1081.44 3.034 571.79 52.87 Copyright © 2012 SciRes. ME 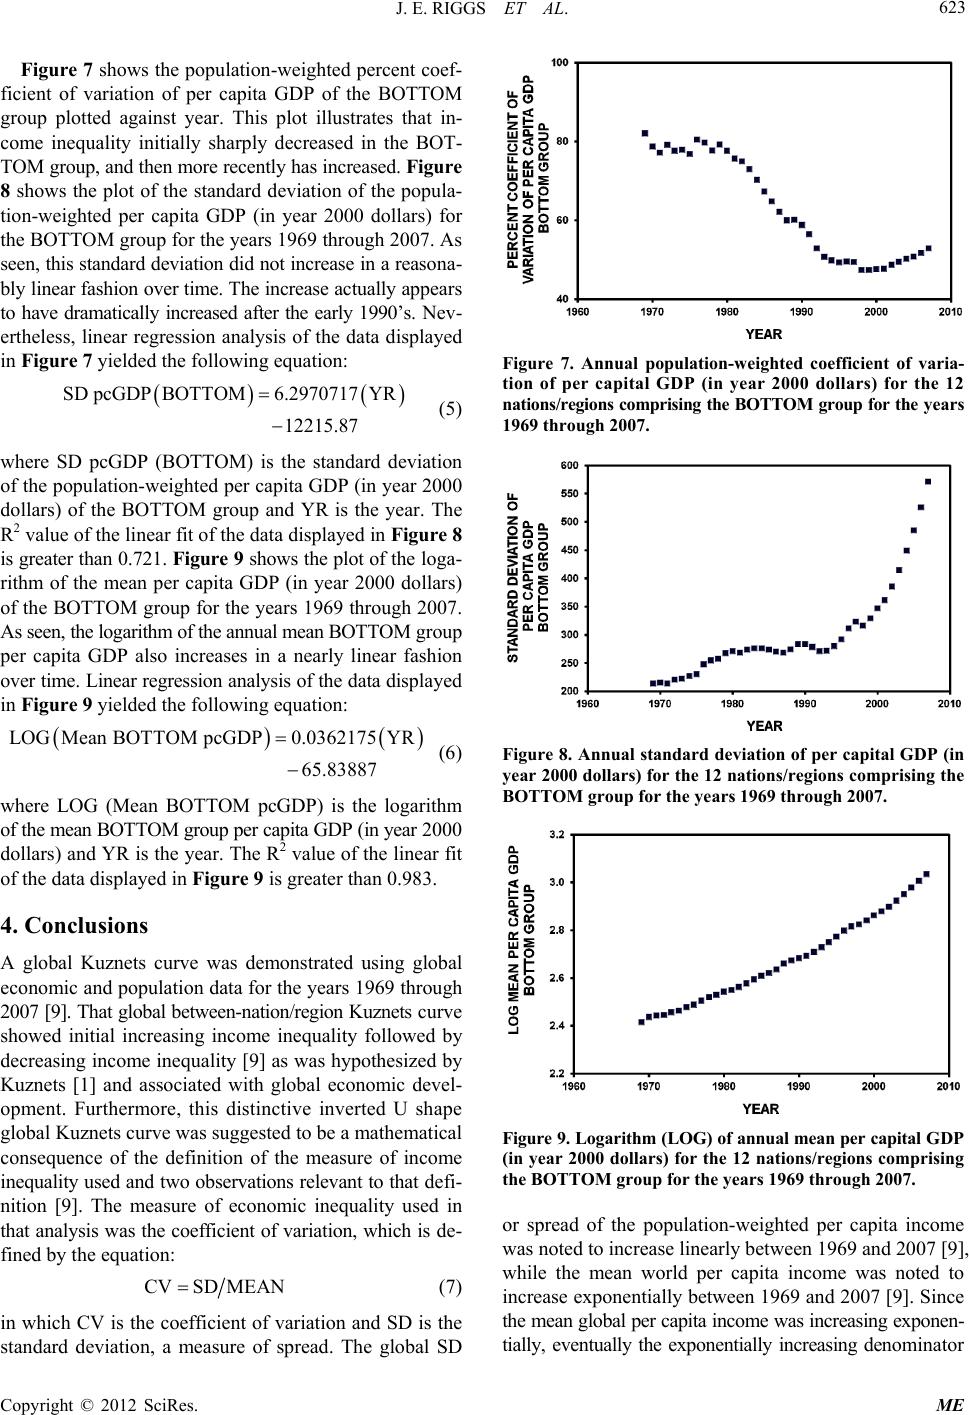 J. E. RIGGS ET AL. 623 Figure 7 shows the population-weighted percent coef- ficient of variation of per capita GDP of the BOTTOM group plotted against year. This plot illustrates that in- come inequality initially sharply decreased in the BOT- TOM group, and then more recently has increased. Figure 8 shows the plot of the standard deviation of the popula- tion-weighted per capita GDP (in year 2000 dollars) for the BOTTOM group for the years 1969 through 2007. As seen, this standard deviation did not increase in a reaso na - bly linear fashion over time. The increase actually app ea rs to have dramatically increased after the early 1990’s. N ev- ertheless, linear regression analysis of the data displayed in Figure 7 yielded the following equation: SD pcGDPBOTTOM6.2 1 970717 YR 2215.87 (5) where SD pcGDP (BOTTOM) is the standard deviation of the population- weighted per capita GDP (in year 2000 dollars) of the BOTTOM group and YR is the year. The R2 value of the linear fit of the d ata d isp layed in Figure 8 is greater than 0.721. Figure 9 shows the plot of the lo ga- rithm of the mean per capita GDP (in year 2000 dollars) of the BOTTOM group for the year s 1969 through 2007. As see n, the logarit hm of t he annu al mean BO TT OM group per capita GDP also increases in a nearly linear fashion over time. Linear regression analysis of the data displa yed in Figure 9 yielded the following equation: LOGMean BOTTOM pcGDP 0.0362175 YR 65.83887 (6) where LOG (Mean BOTTOM pcGDP) is the logarithm of the mean BOTTOM group per capita GDP (in year 2000 dollars) and YR is the year. The R2 value of the linear fit of the data displayed in Figure 9 is greater than 0.983. 4. Conclusions A global Kuznets curve was demonstrated using global economic and population data for the years 1969 through 2007 [9]. That glob al between-nation/region Kuznets cu r ve showed initial increasing income inequality followed by decreasing income inequality [9] as was hypothesized by Kuznets [1] and associated with global economic devel- opment. Furthermore, this distinctive inverted U shape global Kuznets curve was suggested to be a mathematical consequence of the definition of the measure of income inequality used and two observations relevant to that def i- nition [9]. The measure of economic inequality used in that analysis was the coefficient of variation, which is de- fined by the equation: CVSD MEAN (7) in which CV is the coefficient of variation and SD is the standard deviation, a measure of spread. The global SD Figure 7. Annual population-weighted coefficient of varia- tion of per capital GDP (in year 2000 dollars) for the 12 nations/regions comprising the BOTTOM group for the y ea rs 1969 through 2007. Figure 8. Annual standard de viation of per capital GDP (in year 2000 dollars) for the 12 nations/regions comprising the BOTTOM group for the years 1969 through 2007. Figure 9. Logarithm (LOG) of annual mea n per capital G DP (in year 2000 dollars) for the 12 nations/regions comprising the BOTTOM group for the years 1969 through 2007. or spread of the population-weighted per capita income was noted to increase linearly between 1969 and 2007 [9] , while the mean world per capita income was noted to increase exponentially between 1969 and 2007 [9]. Since the mean global per capita income was increasing exponen- tially, eventually the exponentially increasing denominator Copyright © 2012 SciRes. ME 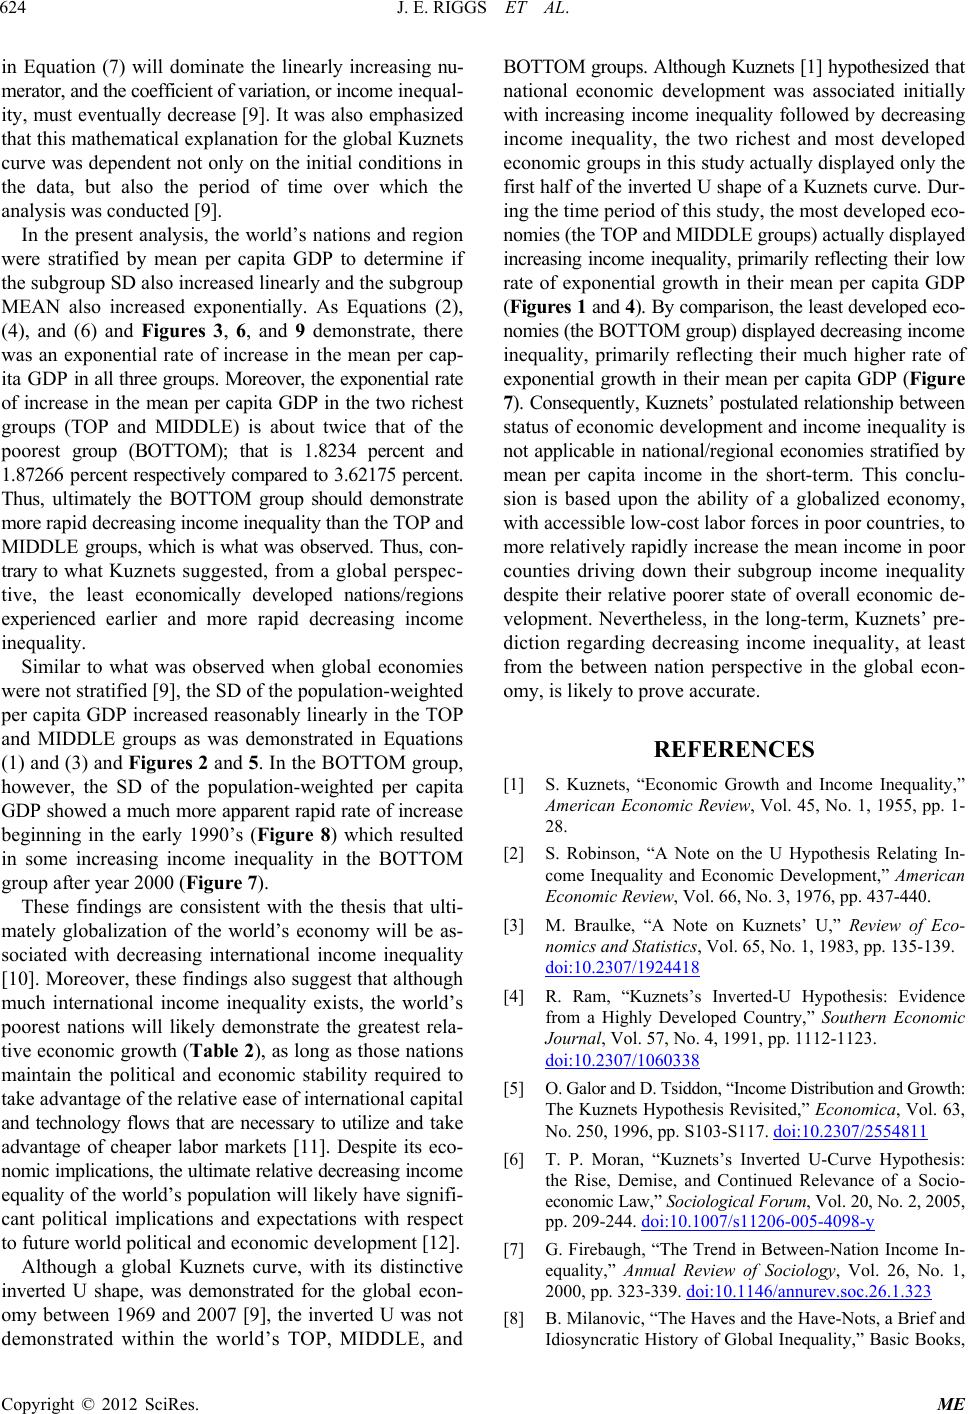 J. E. RIGGS ET AL. 624 in Equation (7) will dominate the linearly increasing nu- merator, and the coefficient of variation, or income inequal- ity, must eventually decrease [9]. It was also emphasized that this mathematical explanation for the global Kuznets curve was dependent not only on the initial conditions in the data, but also the period of time over which the analysis was conducted [9]. In the present analysis, the world’s nations and region were stratified by mean per capita GDP to determine if the subgroup SD also in cr eased lin ear ly and th e subgr oup MEAN also increased exponentially. As Equations (2), (4), and (6) and Figures 3, 6, and 9 demonstrate, there was an exponential rate of increase in the mean per cap- it a GD P in all three groups. Moreover, the exponential rate of incr ease in the mean per capita GDP in the two richest groups (TOP and MIDDLE) is about twice that of the poorest group (BOTTOM); that is 1.8234 percent and 1.87266 pe rcent respectively compared to 3.62175 percent. Thus, ultimately the BOTTOM group should demonstrate more rapid decreasing income inequality than the TOP and MIDDL E groups, which is what was observed. Thus, con- trary to what Kuznets suggested, from a global perspec- tive, the least economically developed nations/regions experienced earlier and more rapid decreasing income inequality. Similar to what was observed when global economies were not stratified [9], the SD of the population-weighted per capita GDP increased reasonably linearly in the TOP and MIDDLE groups as was demonstrated in Equations (1) and (3) and Figures 2 and 5. In the BOTTOM group, however, the SD of the population-weighted per capita GDP showed a much more apparent rapid rate of increa se beginning in the early 1990’s (Figure 8) which resulted in some increasing income inequality in the BOTTOM group after year 2000 (Figure 7). These findings are consistent with the thesis that ulti- mately globalization of the world’s economy will be as- sociated with decreasing international income inequality [10]. Moreover, th ese findings also suggest that although much international income inequality exists, the world’s poorest nations will likely demonstrate the greatest rela- tive economic growth (Table 2), as long as those nations maintain the political and economic stability required to take advantage of the relative ease of international capital and technology flows that are necessary to utilize and take advantage of cheaper labor markets [11]. Despite its eco- nomic implications, the ultimate relative decreasing inco me equality of the world’s population will likely have signif i- cant political implications and expectations with respect to future world political and economic development [12]. Although a global Kuznets curve, with its distinctive inverted U shape, was demonstrated for the global econ- omy between 1969 and 2007 [9], the inverted U was not demonstrated within the world’s TOP, MIDDLE, and BOTTOM groups. Although Kuznets [1] hypo thesized t h at national economic development was associated initially with increasing income inequality followed by decreasing income inequality, the two richest and most developed economic groups in this study actually displayed only the first half of the inverted U shape of a Kuznets curve. Dur - ing the time period of this study, the most developed eco- nomies (the TOP and MIDDLE groups) actually displayed increasing income inequality, primarily reflecting their low rate of exponential growth in their mean per capita GDP (Figures 1 and 4). By comparison, the least developed eco- nomies (the BOTTOM group) displayed decreasing in co me inequality, primarily reflecting their much higher rate of exponential growth in their mean per capita GDP (Figure 7). Consequently, Kuznets’ postulated relationship betw ee n status of economic development and income inequality is not applicable in national/regional economies stratified by mean per capita income in the short-term. This conclu- sion is based upon the ability of a globalized economy, with accessible low-cost labor forces in poor countries, to more relatively rapidly increase the mean income in poor counties driving down their subgroup income inequality despite their relative poorer state of overall economic de- velopment. Nevertheless, in the long-term, Kuznets’ pre- diction regarding decreasing income inequality, at least from the between nation perspective in the global econ- omy, is likely to prove accurate. REFERENCES [1] S. Kuznets, “Economic Growth and Income Inequality,” American Economic Review, Vol. 45, No. 1, 1955, pp. 1- 28. [2] S. Robinson, “A Note on the U Hypothesis Relating In- come Inequality and Economic Development,” American Economic Review, Vol. 66, No. 3, 1976, pp. 437-440. [3] M. Braulke, “A Note on Kuznets’ U,” Review of Eco- nomics and Statistics, Vol. 65, No. 1, 1983, pp. 135-139. doi:10.2307/1924418 [4] R. Ram, “Kuznets’s Inverted-U Hypothesis: Evidence from a Highly Developed Country,” Southern Economic Journal, Vol. 57, No. 4, 1991, pp. 1112-1123. doi:10.2307/1060338 [5] O. Galor and D. Tsiddon, “Income Distribution and Growth: The Kuznets Hypothesis Revisited,” Economica, Vol. 63, No. 250, 1996, pp. S103-S117. doi:10.2307/2554811 [6] T. P. Moran, “Kuznets’s Inverted U-Curve Hypothesis: the Rise, Demise, and Continued Relevance of a Socio- economic Law,” Sociological Forum, Vol. 20, No. 2, 2005, pp. 209-244. doi:10.1007/s11206-005-4098-y [7] G. Firebaugh, “The Trend in Between-Nation Income In- equality,” Annual Review of Sociology, Vol. 26, No. 1, 2000, pp. 323-339. doi:10.1146/annurev.soc.26.1.323 [8] B. Milanovic, “The Haves and the Have-Nots, a Brief and Idiosyncratic History of Global Inequality,” Basic Books, Copyright © 2012 SciRes. ME  J. E. RIGGS ET AL. Copyright © 2012 SciRes. ME 625 New York, 2011. [9] J. E. Riggs, J. C. Hobbs, G. R. Hobbs and T. H. Riggs, “The Global Kuznets Curve, 1969-2007,” Modern Econ- omy, Vol. 3, No. 2, 2012, pp. 160-163. doi:10.4236/me.2012.32022 [10] G. Firebaugh, “The New Geography of Global Income Inequality,” Harvard University Press, Cambridge, 2003. [11] D. Acemolu and J. A. Robinson, “Why Nations Fail, the Origins of Power, Prosperity, and Poverty,” Crown Busi- ness, New York, 2012. [12] D. Acemoglu and J. A. Robinson, “The Political Econ- omy of the Kuznets Curve,” Review of Development Eco- nomics, Vol. 6, No. 2, 2002, pp. 183-203. doi:10.1111/1467-9361.00149 |