

Paper Menu >>
Journal Menu >>
 Modern Economy, 2012, 3, 563-566 http://dx.doi.org/10.4236/me.2012.35074 Published Online September 2012 (http://www.SciRP.org/journal/me) A Study of the Causal Relationship between Real Exchange Rate of Renminbi and Hong Kong Stock Market Index Wai-Choi Lee1,2 1Department of Economics and Finance, Hang Seng Management College, Hong Kong, China 2School of Finance, Shanghai University of Finance and Economics, Shanghai, China Email: [email protected] Received May 23, 2012; revised June 20, 2012; accepted June 28, 2012 ABSTRACT This paper attempts to study whether the real exchange rate of Renminbi and stock market index in Hong Kong are re- lated to each other or not. The study uses cointegration and Granger causality tests on the monthly data of the real ex- change rate of Renmnibi (RMB) in terms of Hong Kong dollars (REX) and Hang Seng Index (HSI) since the foreign exchange reform of China in July 2005. The major findings of the study are a) the cointegration test shows that there exists a long-run equilibrium relationship between REX and HSI; b) the error correction mechanism further evidences that there is an error correction between REX and HSI in the short run; c) the Granger causality test indicates that there is causal direction from RMB to HSI but not vice versa. Keywords: Cointegration Test; Error Correction Mechanism; Granger Causality Test; Renminbi; Hang Seng Index 1. Introduction In July 2005, the People’s Bank of China (PBoC) aban- doned the 11-year-old peg of the Renminbi (RMB) against the American dollar (USD) and replaced it with a man- aged floating exchange rate based on market supply and demand with reference to a basket of foreign currencies. Not surprisingly, currencies in the basket included the currencies of three trading partners—i.e., the USD, the euro, and the Japanese yen. Under the new system, ad- justments in the rate of exchange fluctuation will not only govern the relationship between RMB and USD, but also the relationship between RMB and other main currencies such as the euro and the Japanese yen. At the same time, the RMB was revalued by 2.1%— from 8.28 RMB per USD to 8.11 per USD. In September 2005, the PBoC decided to adopt a narrow band of 0.3% on either side of the central rate within which RMB can fluctuate against USD. Since then, the RMB has gradu- ally been revalued against USD. As of 22 May, 2012, the exchange rate of RMB is raised to 6.33 per USD. Since 1983, the monetary authority of Hong Kong has maintained currency stability, defined as a stable external exchange value of the currency of Hong Kong, in terms of its exchange rate in the foreign exchange market against the USD, at around HK$7.80 to US$1. As a result, the exchange rates of Hong Kong dollar (HKD) in terms of foreign currencies, such as RMB, follow the exchange rates of USD in the same direction. As the USD depreciates against RMB, the HKD depreciates against it accordingly. The Hong Kong Stock Exchange is Asia’s third largest stock exchange by market capitalization, behind the To- kyo Stock Exchange and Shanghai Stock Exchange. Hang Seng Index (HSI), the most widely quoted gauge of the Hong Kong stock market, includes the largest and most liquid stocks listed on Main Board of the Stock Exchange of Hong Kong. It is a market capitalization weighted index and comprises 48 constituent stocks of Hong Kong and Mainland China enterprises. The aggregate market capi- talization of these stocks accounts for over 65 percentage of the total market capitalization in the Hong Kong Stock Exchange. Classical economic theory suggests a relationship be- tween the stock market performance and the exchange rate behaviour. Dornbusch and Fisher [1] and Aggarwal [2] affirm that currency movements affect international competitiveness and the balance of trade position, and consequently the real output of the economy, which in turn affects current and future cash flows of companies and their stock prices. Granger, Huang and Yang [3] find that currency de- preciation could either raise or lower the value of Asian companies during the Asian Crisis of 1997, depending on whether the company mainly imports or mainly exports. When the stock market index is considered, the net effect cannot be predicted. Yue, Cheng, Lee and Man [4] perform a panel data analysis across four small export-oriented economies, C opyright © 2012 SciRes. ME 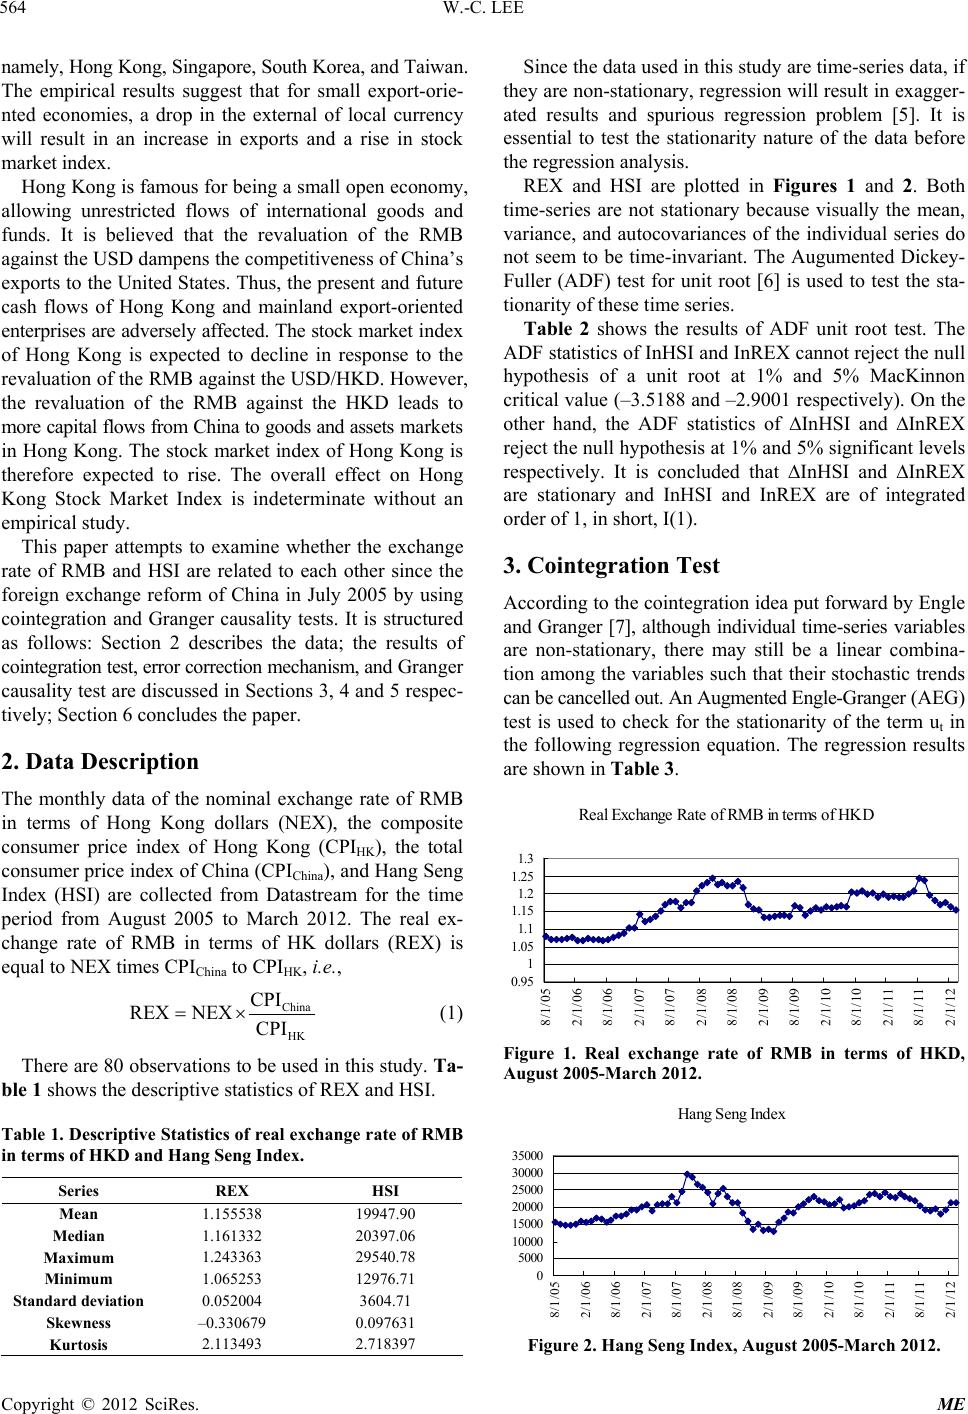 W.-C. LEE 564 namely, Hong Kong, Singapore, South Korea, and Taiwan. The empirical results suggest that for small export-orie- nted economies, a drop in the external of local currency will result in an increase in exports and a rise in stock market index. Hong Kong is famous for being a small open economy, allowing unrestricted flows of international goods and funds. It is believed that the revaluation of the RMB against the USD dampens the competitiveness of China’s exports to the United States. Thus, the present and future cash flows of Hong Kong and mainland export-oriented enterprises are adversely affected. The stock market index of Hong Kong is expected to decline in response to the revaluation of the RMB against the USD/HKD. However, the revaluation of the RMB against the HKD leads to more capital flows from China to goods and assets markets in Hong Kong. The stock market index of Hong Kong is therefore expected to rise. The overall effect on Hong Kong Stock Market Index is indeterminate without an empirical study. This paper attempts to examine whether the exchange rate of RMB and HSI are related to each other since the foreign exchange reform of China in July 2005 by using cointegration and Granger causality tests. It is structured as follows: Section 2 describes the data; the results of cointegration test, error correction mechanism, and Granger causality test are discussed in Sections 3, 4 and 5 respec- tively; Section 6 concludes the paper. 2. Data Description The monthly data of the nominal exchange rate of RMB in terms of Hong Kong dollars (NEX), the composite consumer price index of Hong Kong (CPIHK), the total consumer price index of China (CPIChina), and Hang Seng Index (HSI) are collected from Datastream for the time period from August 2005 to March 2012. The real ex- change rate of RMB in terms of HK dollars (REX) is equal to NEX times CPIChina to CPIHK, i.e., China HK CPI XCPI REX NE (1) There are 80 observations to be used in this study. Ta- ble 1 shows the descriptive statistics of REX and HSI. Table 1. Descriptive Statistics of real exchange rate of RMB in terms of HKD and Hang Seng Index. Series REX HSI Mean 1.155538 19947.90 Median 1.161332 20397.06 Maximum 1.243363 29540.78 Minimum 1.065253 12976.71 Standard deviation 0.052004 3604.71 Skewness –0.330679 0.097631 Kurtosis 2.113493 2.718397 Since the data used in this study are time-series data, if they are non-stationary, regression will result in exagger- ated results and spurious regression problem [5]. It is essential to test the stationarity nature of the data before the regression analysis. REX and HSI are plotted in Figures 1 and 2. Both time-series are not stationary because visually the mean, variance, and autocovariances of the individual series do not seem to be time-invariant. The Augumented Dickey- Fuller (ADF) test for unit root [6] is used to test the sta- tionarity of these time series. Table 2 shows the results of ADF unit root test. The ADF statistics of InHSI and InREX cannot reject the null hypothesis of a unit root at 1% and 5% MacKinnon critical value (–3.5188 and –2.9001 respectively). On the other hand, the ADF statistics of InHSI and InREX reject the null hypothesis at 1% and 5% significant levels respectively. It is concluded that InHSI and InREX are stationary and InHSI and InREX are of integrated order of 1, in short, I(1). 3. Cointegration Test According to the cointegration idea put forward by Engle and Granger [7], although individual time-series variables are non-stationary, there may still be a linear combina- tion among the variables such that their stochastic trends can be cancelled out. An Augmented Engle-Granger (AEG) test is used to check for the stationarity of the term ut in the following regression equation. The regression results are shown in Table 3. Real Exchange Rate of RMB in terms of HKD 0.95 1 1.05 1.1 1.15 1.2 1.25 1.3 8/1/05 2/1/06 8/1/06 2/1/07 8/1/07 2/1/08 8/1/08 2/1/09 8/1/09 2/1/10 8/1/10 2/1/11 8/1/11 2/1/12 Figure 1. Real exchange rate of RMB in terms of HKD, August 2005-March 2012. Hang Seng Index 0 5000 10000 15000 20000 25000 30000 35000 8/1/05 2/1/06 8/1/06 2/1/07 8/1/07 2/1/08 8/1/08 2/1/09 8/1/09 2/1/10 8/1/10 2/1/11 8/1/11 2/1/12 Figure 2. Hang Seng Index, August 2005-March 2012. Copyright © 2012 SciRes. ME 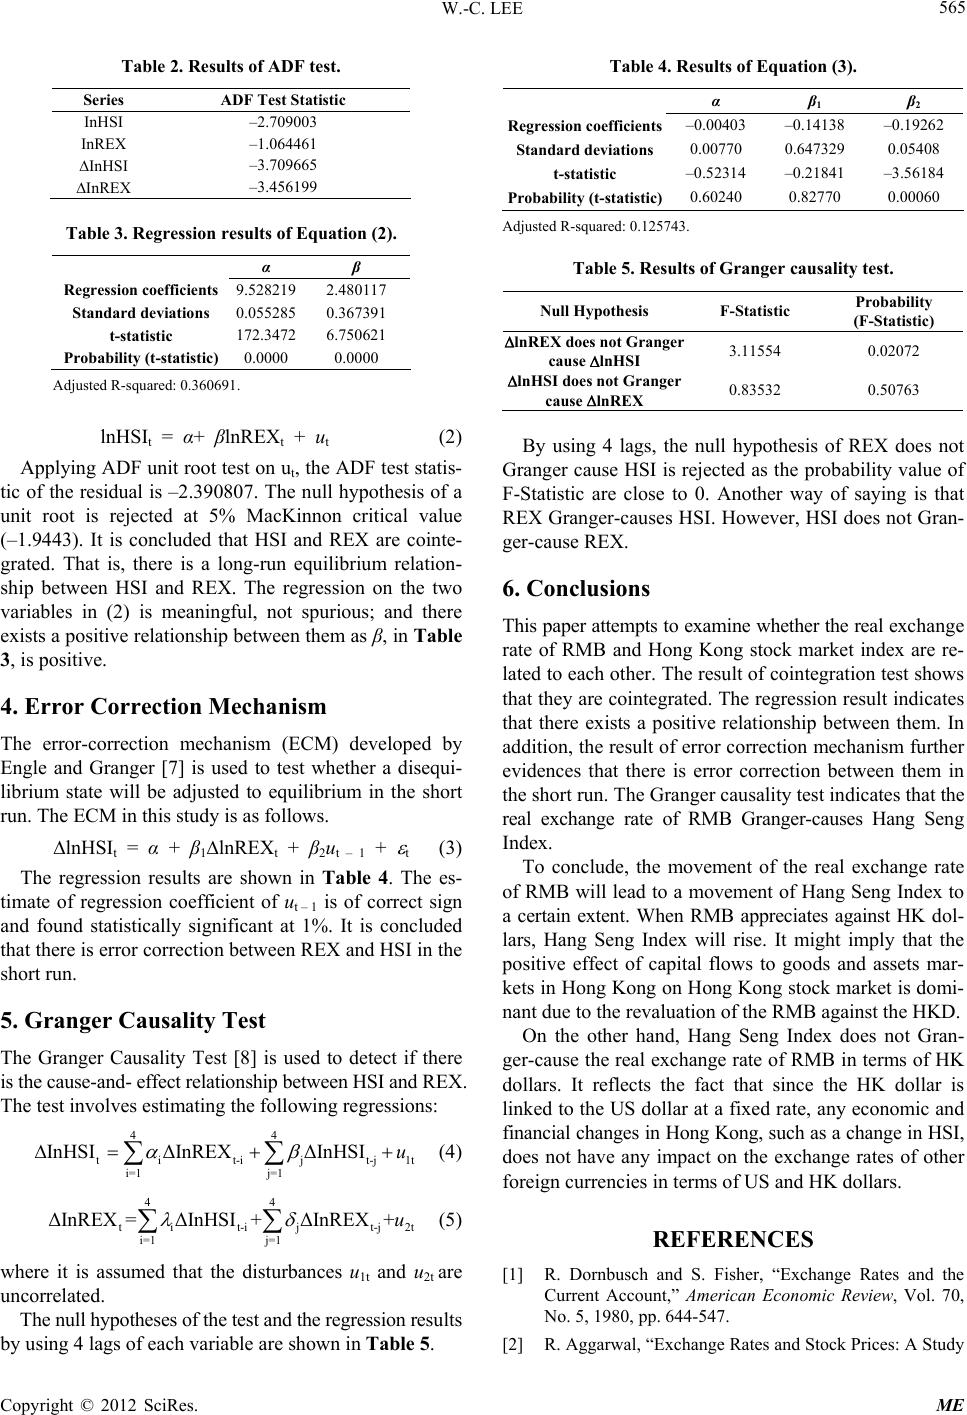 W.-C. LEE 565 Table 2. Results of ADF test. Series ADF Test Statistic InHSI –2.709003 InREX –1.064461 InHSI –3.709665 InREX –3.456199 Table 3. Regression results of Equation (2). α β Regression coefficients 9.528219 2.480117 Standard deviations 0.055285 0.367391 t-statistic 172.3472 6.750621 Probability (t-statistic) 0.0000 0.0000 Adjusted R-squared: 0.360691. lnHSIt = α+ βlnREXt + ut (2) Applying ADF unit root test on ut, the ADF test statis- tic of the residual is –2.390807. The null hypothesis of a unit root is rejected at 5% MacKinnon critical value (–1.9443). It is concluded that HSI and REX are cointe- grated. That is, there is a long-run equilibrium relation- ship between HSI and REX. The regression on the two variables in (2) is meaningful, not spurious; and there exists a positive relationship between them as β, in Table 3, is positive. 4. Error Correction Mechanism The error-correction mechanism (ECM) developed by Engle and Granger [7] is used to test whether a disequi- librium state will be adjusted to equilibrium in the short run. The ECM in this study is as follows. lnHSIt = α + β1lnREXt + β2ut – 1 + t (3) The regression results are shown in Table 4. The es- timate of regression coefficient of ut – 1 is of correct sign and found statistically significant at 1%. It is concluded that there is error correction between REX and HSI in the short run. 5. Granger Causality Test The Granger Causality Test [8] is used to detect if there is the cause-and- effect relationship between HSI and REX. The test involves estimating the following regressions: 44 tit-i j i=1 j=1 InHSI ΔInREX Δ t-j 1t InHSI u j t-j2t InREX +u (4) 44 ti t-i i=1 j=1 ΔInREX =ΔInHSI +Δ (5) where it is assumed that the disturbances u1t and u2t are uncorrelated. The null hypotheses of the test and the regression results by using 4 lags of each variable are shown in Table 5. Table 4. Results of Equation (3). α β1 β2 Regression coefficients–0.00403 –0.14138 –0.19262 Standard deviations0.00770 0.647329 0.05408 t-statistic –0.52314 –0.21841 –3.56184 Probability (t-statistic)0.60240 0.82770 0.00060 Adjusted R-squared: 0.125743. Table 5. Results of Granger causality test. Null Hypothesis F-Statistic Probability (F-Statistic) lnREXdoes not Granger cause lnHSI 3.11554 0.02072 lnHSI does not Granger cause lnREX 0.83532 0.50763 By using 4 lags, the null hypothesis of REX does not Granger cause HSI is rejected as the probability value of F-Statistic are close to 0. Another way of saying is that REX Granger-causes HSI. However, HSI does not Gran- ger-cause REX. 6. Conclusions This paper attempts to examine whether the real exchange rate of RMB and Hong Kong stock market index are re- lated to each other. The result of cointegration test shows that they are cointegrated. The regression result indicates that there exists a positive relationship between them. In addition, the result of error correction mechanism further evidences that there is error correction between them in the short run. The Granger causality test indicates that the real exchange rate of RMB Granger-causes Hang Seng Index. To conclude, the movement of the real exchange rate of RMB will lead to a movement of Hang Seng Index to a certain extent. When RMB appreciates against HK dol- lars, Hang Seng Index will rise. It might imply that the positive effect of capital flows to goods and assets mar- kets in Hong Kong on Hong Kong stock market is domi- nant due to the revaluation of the RMB against the HKD. On the other hand, Hang Seng Index does not Gran- ger-cause the real exchange rate of RMB in terms of HK dollars. It reflects the fact that since the HK dollar is linked to the US dollar at a fixed rate, any economic and financial changes in Hong Kong, such as a change in HSI, does not have any impact on the exchange rates of other foreign currencies in terms of US and HK dollars. REFERENCES [1] R. Dornbusch and S. Fisher, “Exchange Rates and the Current Account,” American Economic Review, Vol. 70, No. 5, 1980, pp. 644-547. [2] R. Aggarwal, “Exchange Rates and Stock Prices: A Study Copyright © 2012 SciRes. ME  W.-C. LEE Copyright © 2012 SciRes. ME 566 of US Capital Markets under Floating Exchange Rates,” Akron Business and Economic Review, Vol. 12, 1981, pp. 7-12. [3] C. W. J. Granger, B. Huang and C. W. Yang, “A Bivari- ate Causality between Stock Prices and Exchange Rates: Evidence from Recent Asian Flu,” Quarterly Review of Economics and Finance, Vol. 40, No. 3, 2000, pp. 337- 354. doi:10.1016/S1062-9769(00)00042-9 [4] H. Y. Yue, W. W. Cheng, W. C. Lee and K. K. Man, “Interaction between Foreign Exchange Rate and Stock Market Price Index in East Asian Economies: A Panel Data Analysis,” 2012 Shanghai International Conference on Social Science, Shanghai, 14-17 August 2012. [5] C. W. J. Granger and P. Newbold, “Spurious Regression in Econometrics,” Journal of Econometrics, Vol. 2, No. 2, 1974, pp. 111-120. doi:10.1016/0304-4076(74)90034-7 [6] D. A. Dickey and W. A. Fuller, “Distribution of the Esti- mators for Autoregressive Time Series with a Unit Root,” Journal of the American Statistical Association, Vol. 74, No. 366, 1979, pp. 427-431. [7] R. Engle and C. W. J. Granger, “Cointegration and Error Correction: Representation, Estimate, and Testing,” Eco- nometrica, Vol. 55, No. 2, 1987, pp. 251-276. doi:10.2307/1913236 [8] C. W. J. Granger, “Investigating Causal Relations by Econometric Models and Cross-Spectral Methods,” Eco- nometrica, Vol. 37, No. 3, 1969, pp. 424-438. doi:10.2307/1912791 |