

Paper Menu >>
Journal Menu >>
 Open Journal of Applied Sciences, 2012, 2, 128-134 doi:10.4236/ojapps.2012.23018 Published Online September 2012 (http :/ /www.SciRP.org/journal/ojapps) Biomagnetic Validation to Skin Level for Blood Pressure Curves and Venous T. Cordova-Fraga1*, Francisco Gómez-Aguilar1, T. Bravo-Arellano1, M. A. Hernández-Gonzalez2, S. Solorio-Meza2, H. A. Perez-Olivas1, M. Sosa-Aquino1, J. J. Bernal-Alvarado1, C. R. Contreras-Gaytan3 1Departamento de Ingeniería Física—DCI, Universidad de Guanajuato Campus León Loma del Bosque, León, México 2Unidad de Investigaciones Médicas, Los Paraísos, León, México 3Facultad de Ingeniería en Computación y Electrónica, Universidad De La Salle Bajío Campus Campestre, Lomas del Campestre, León, México Email: *[email protected], theoco rdo [email protected] Received May 31, 2012; revised June 28, 2012; accepted July 12, 2012 ABSTRACT An analysis of the reproducibility from signal record bioelectric heart activity is presented. The measurements were carried out with a recently patented medical device, which one is able to record the curves of pressure arterial and ve- nous as those obtain ed using th e gold standard tech nique in these evalu ation s, the card iac catheterization techn ique. The measurements were carried out 15 health subjects and patients; each one was measured 5 times in order to have auto-correlations and correlations of these records. Analysis indicates correlations from 0.9 to 1 as long as p values were below 0.05. It is indicated an excellent reproducibility of ev aluated patients. Keywords: Bioelectric Heart Activity; Curves of Pressure Arterial and Venous; Correlation Coefficient; Statistical Analysis 1. Introduction The arterial and venous pressures are values attributed to blood flow through human body [1,2]. As far as it is known, the first record about blood circulation existence was performed in China by Nei Ching, 2600 years a. C. [3] Although Miguel Servet made the first description of pulmonary circulatory system [4]. Later, William Harvey raised the pri nciple of hem ody nam ics to veri fy that the heart muscle had phases of movement and rest [5]. Poiseuille used a pr essure gauge in an imals to eva luate the pre ssure in units of mmHg [6], Faivre used the Poiseuille he- modinamometer on a human being to measure intra- arterial pressure [7]. Some non-invasive studies have shown that hemo- dynamic forces have a relationship with the pulse pres- sure [8]. It has also been noted that with age, it is increased cardiovascular risk, and it is directly related to aortic pressure increase [8-12]. Currently there are two methods of clinical routine use for measurement of blood pressure and only one to record venous pressure: cardiac catheterization and sphygmomanometer to arteries. The second one is widely used, however provides a register subjective due to its nature. As long as, the technique of cardiac catheterization is able to record venous pressure in their inside, it is considered the gold standard in these assessments, despite it is widely invasive and it demands high trained personnel and special patients areas for implementation [9 ]. Nevertheless, it pr esen ts an obj ectiv e record. In this paper, it is presented the validation of records on blood pressure in healthy subjects and patients. It has been used a device recently patented, the pulse pressure cardiac gauge (PPC). This diagnostic and monitoring device is able to have a distinction of recording of the curves shape of pressure of arterial and venous as those recorded by catheterization, it offer an express evaluation with the advantage of carrying out the valuation on skin level; the ionizing radiation is avoided and does not require a sterile room for evaluation. 2. Methodology Each one of the patients enrolled in this study gave a written consent previous to carrying out measurements, which were performed according to the treaty of Helsinki for studies in humans. These assessments did not present any risk or exposed the patient to any ionizing radiation. To each volunteer was asked to be placed in semi-fowler position with the head turned to the right, then the artery *Corresponding a uthor. Copyright © 2012 SciRes. OJAppS 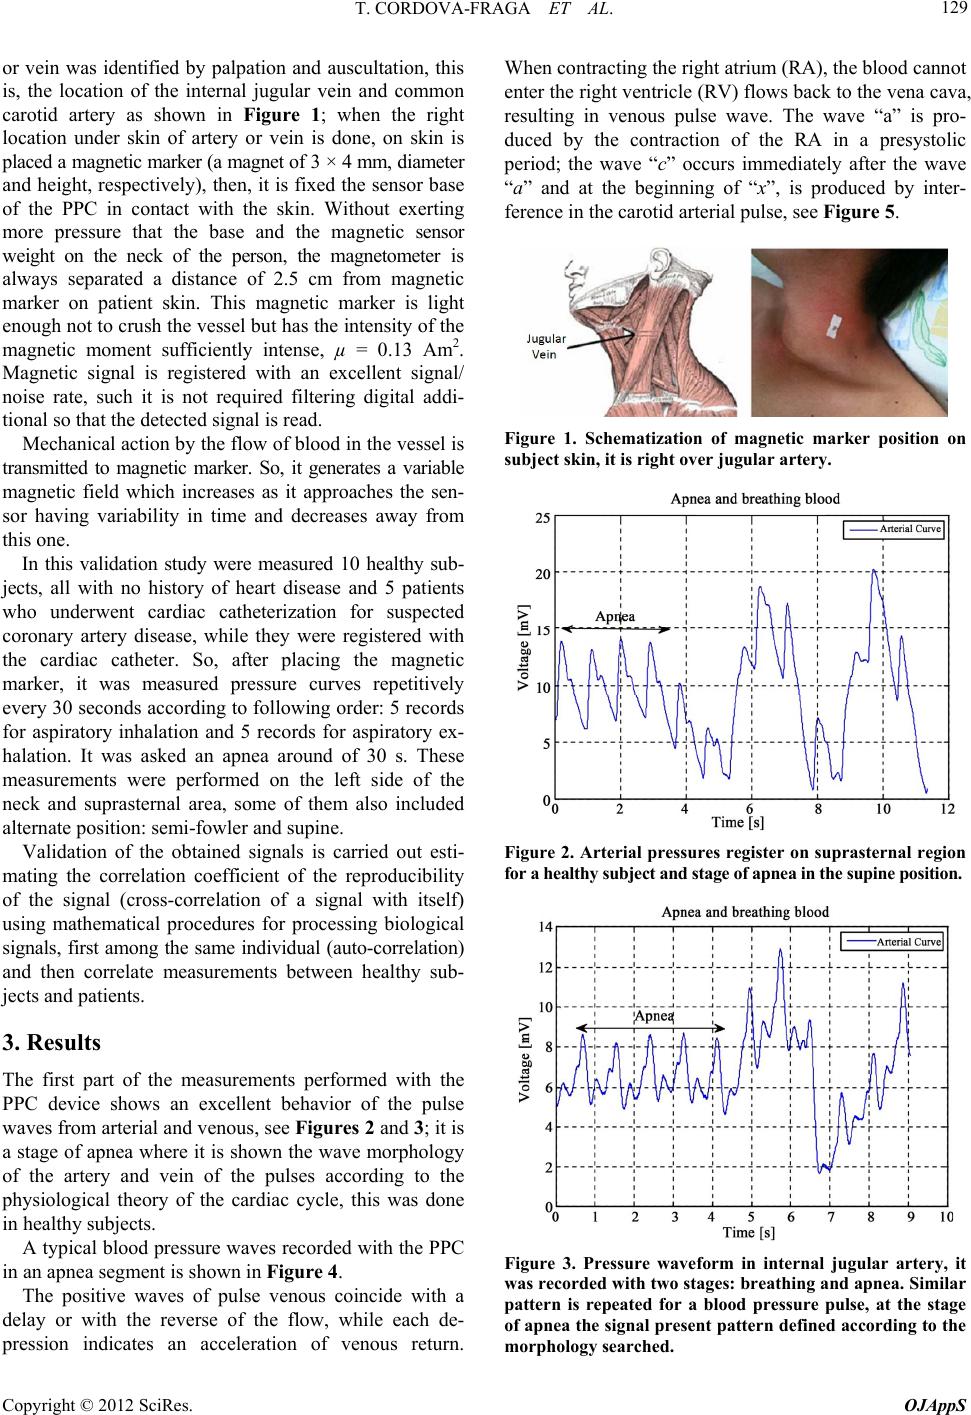 T. CORDOVA-FRAGA ET AL. 129 or vein was identified by palpation and auscultation, this is, the location of the internal jugular vein and common carotid artery as shown in Figure 1; when the right location under skin of artery or vein is done, on skin is placed a magnetic marker (a magnet of 3 × 4 mm, diameter and height, respectively), then, it is fixed the sensor base of the PPC in contact with the skin. Without exerting more pressure that the base and the magnetic sensor weight on the neck of the person, the magnetometer is always separated a distance of 2.5 cm from magnetic marker on patient skin. This magnetic marker is light enough not to crush the vessel but has the intensity of the magnetic moment sufficiently intense, µ = 0.13 Am2. Magnetic signal is registered with an excellent signal/ noise rate, such it is not required filtering digital addi- tional so that the detected signal is read. Mechanical action by the flow of blood in the v essel is transmitted to magnetic marker. So, it generates a variable magnetic field which increases as it approaches the sen- sor having variability in time and decreases away from this one. In this validation study were measured 10 healthy sub- jects, all with no history of heart disease and 5 patients who underwent cardiac catheterization for suspected coronary artery disease, while they were registered with the cardiac catheter. So, after placing the magnetic marker, it was measured pressure curves repetitively every 30 seconds according to following order: 5 records for aspiratory inhalation and 5 records for aspiratory ex- halation. It was asked an apnea around of 30 s. These measurements were performed on the left side of the neck and suprasternal area, some of them also included alternate position: semi-fowler and supine. Validation of the obtained signals is carried out esti- mating the correlation coefficient of the reproducibility of the signal (cross-correlation of a signal with itself) using mathematical procedures for processing biological signals, first among the same individual (auto-correlation) and then correlate measurements between healthy sub- jects and patients. 3. Results The first part of the measurements performed with the PPC device shows an excellent behavior of the pulse waves from arterial and venous, see Figures 2 and 3; it is a stage of apnea where it is shown the wave morphology of the artery and vein of the pulses according to the physiological theory of the cardiac cycle, this was done in healthy subjects. A typical blood pressure waves recorded with the PPC in an apnea segment is shown in Figure 4. The positive waves of pulse venous coincide with a delay or with the reverse of the flow, while each de- pression indicates an acceleration of venous return. When contracting the right atrium (RA), the blood cannot enter the right ventricle (RV) flows back to the vena cava, resulting in venous pulse wave. The wave “a” is pro- duced by the contraction of the RA in a presystolic period; the wave “c” occurs immediately after the wave “a” and at the beginning of “x”, is produced by inter- ference in the carotid arterial pulse, see Figure 5. Figure 1. Schematization of magnetic marker position on subject skin, it is right over jugular artery. Figure 2. Arterial pressures register on suprasternal region for a healthy subject and stage of apnea in the supine position. Figure 3. Pressure waveform in internal jugular artery, it was recorded with two stages: breathing and apnea. Similar pattern is repeated for a blood pressure pulse, at the stage of apnea the signal present pattern de fined according to the morphology searched. Copyright © 2012 SciRes. OJAppS 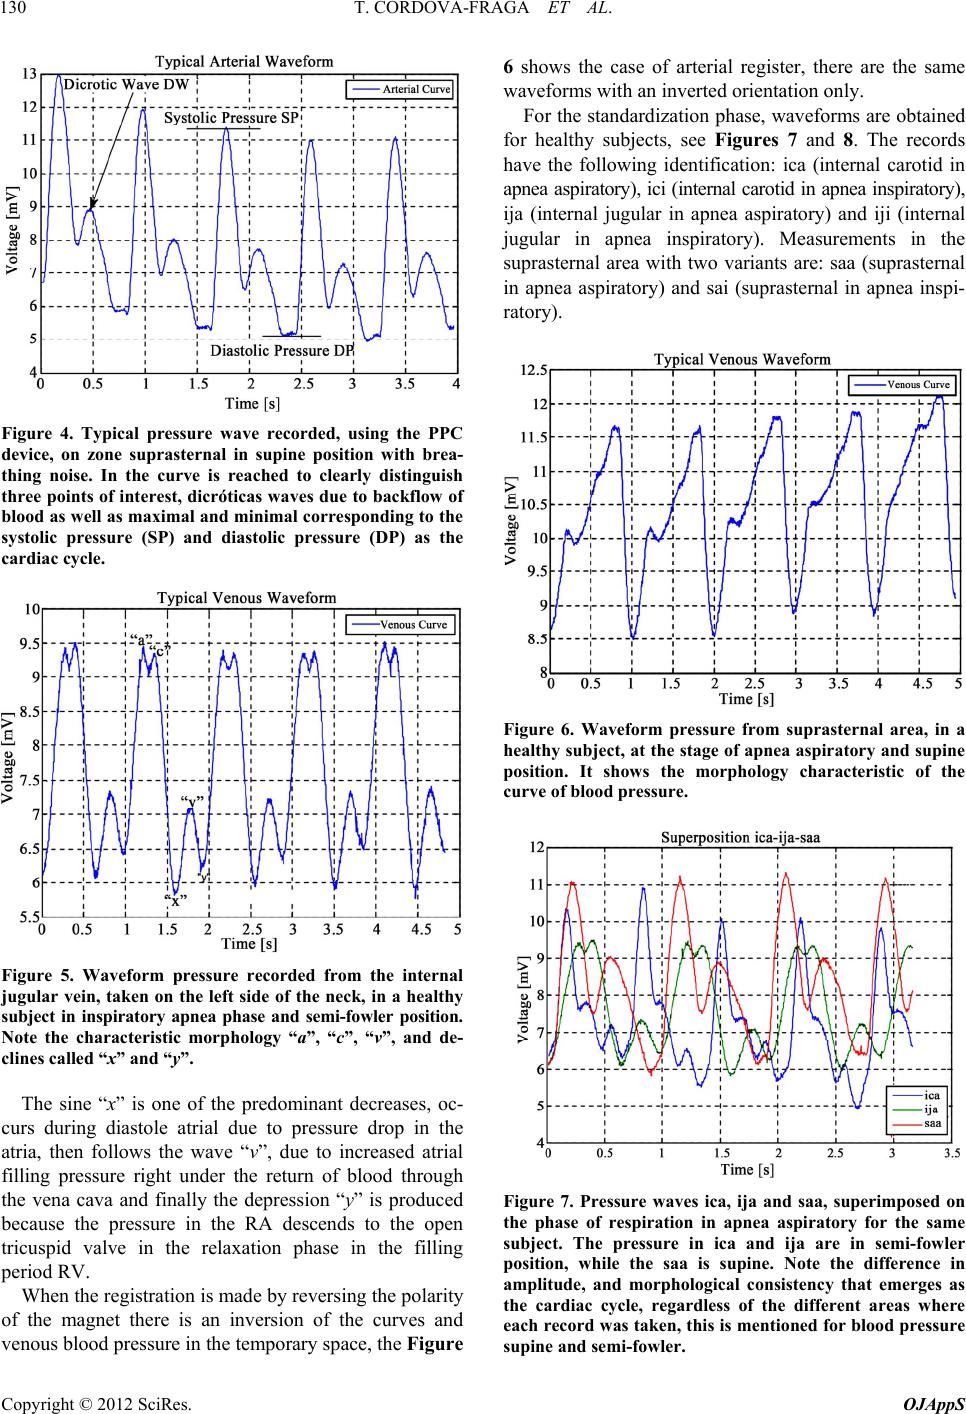 T. CORDOVA-FRAGA ET AL. 130 Figure 4. Typical pressure wave recorded, using the PPC device, on zone suprasternal in supine position with brea- thing noise. In the curve is reached to clearly distinguish three points of interest, dicróticas waves due to backflow of blood as well as maximal and minimal corresponding to the systolic pressure (SP) and diastolic pressure (DP) as the cardiac cycle. Figure 5. Waveform pressure recorded from the internal jugular vein, taken on the left side of the neck, in a healthy subject in inspiratory apnea phase and semi-fowler position. Note the characteristic morphology “a”, “c”, “v”, and de- clines calle d “x” and “y”. The sine “x” is one of the predominant decreases, oc- curs during diastole atrial due to pressure drop in the atria, then follows the wave “v”, due to increased atrial filling pressure right under the return of blood through the vena cava and finally the depression “y” is produced because the pressure in the RA descends to the open tricuspid valve in the relaxation phase in the filling period RV. When the registration is made by reversing the polarity of the magnet there is an inversion of the curves and venous blood pressure in the temporary space, the Figure 6 shows the case of arterial register, there are the same waveforms with an inverted orientation only. For the standardization ph ase, waveforms are obtained for healthy subjects, see Figures 7 and 8. The records have the following identification: ica (internal carotid in apnea aspiratory), ici (internal carotid in apnea inspiratory), ija (internal jugular in apnea aspiratory) and iji (internal jugular in apnea inspiratory). Measurements in the suprasternal area with two variants are: saa (suprasternal in apnea aspiratory) and sai (suprasternal in apnea inspi- ratory). Figure 6. Waveform pressure from suprasternal area, in a healthy subject, at the stage of apnea aspiratory and supine position. It shows the morphology characteristic of the curve of blood pressure. Figure 7. Pressure waves ica, ija and saa, superimposed on the phase of respiration in apnea aspiratory for the same subject. The pressure in ica and ija are in semi-fowler position, while the saa is supine. Note the difference in amplitude, and morphological consistency that emerges as the cardiac cycle, regardless of the different areas where each record was taken, this is mentioned for blood pressure supine and semi-fowler. Copyright © 2012 SciRes. OJAppS 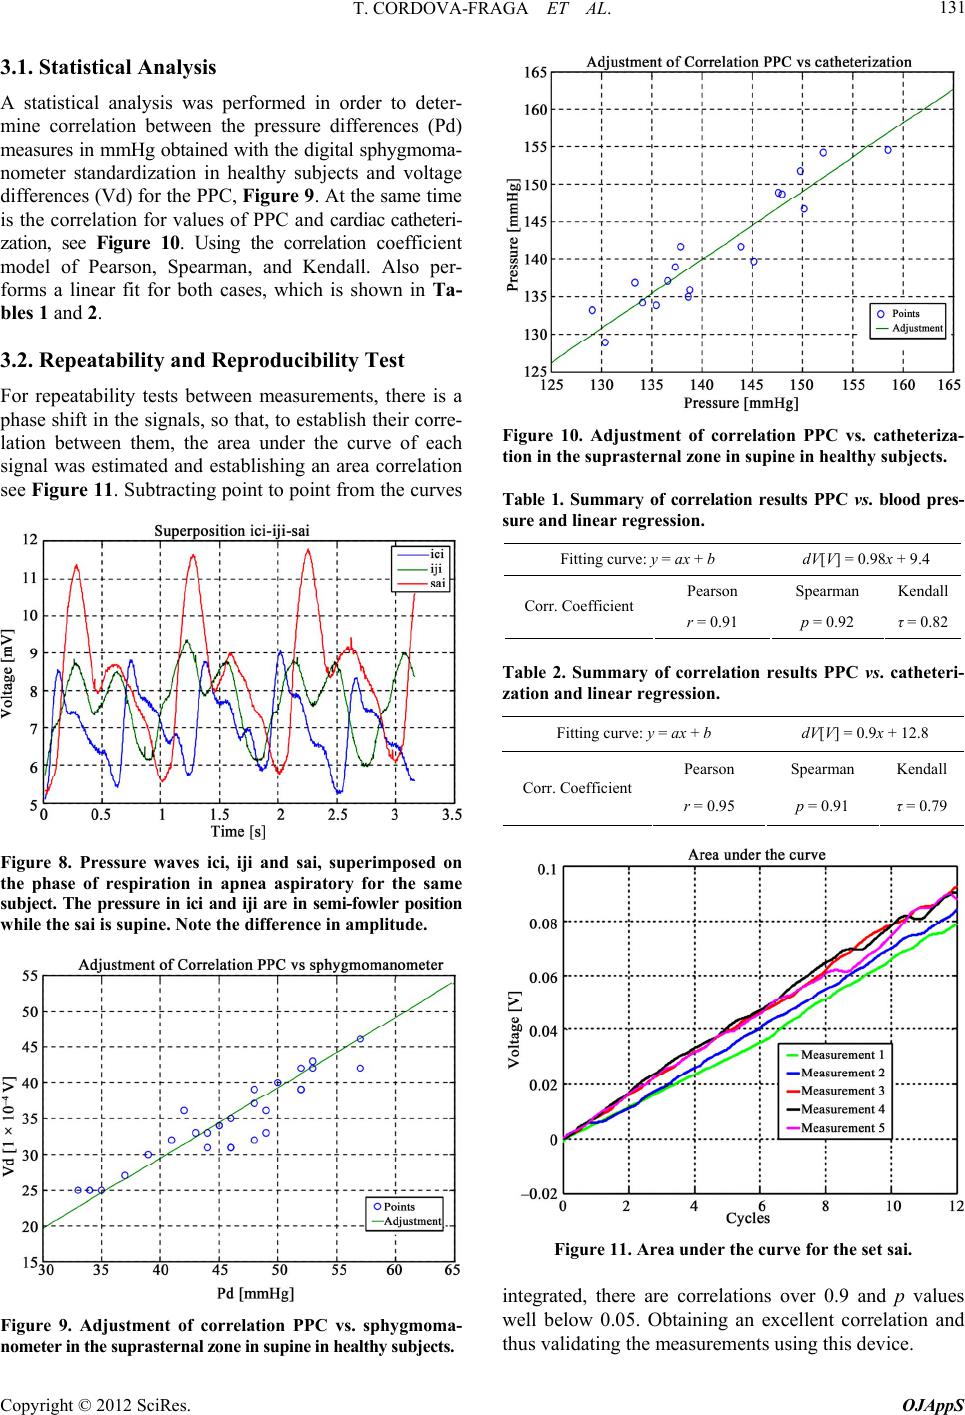 T. CORDOVA-FRAGA ET AL. 131 3.1. Statistical Analysis A statistical analysis was performed in order to deter- mine correlation between the pressure differences (Pd) measures in mmHg obtained with the digital sphygmoma- nometer standardization in healthy subjects and voltage differences (Vd) for the PPC, Figure 9. At the same time is the correlation for values of PPC and cardiac catheteri- zation, see Figure 10. Using the correlation coefficient model of Pearson, Spearman, and Kendall. Also per- forms a linear fit for both cases, which is shown in Ta- bles 1 and 2. 3.2. Repeatability and Reproducibility Test For repeatability tests between measurements, there is a phase shift in the signals, so that, to establish their corre- lation between them, the area under the curve of each signal was estimated and establishing an area correlation see Figure 11. Subtracting point to point from the curves Figure 8. Pressure waves ici, iji and sai, superimposed on the phase of respiration in apnea aspiratory for the same subject. The pressure in ici and iji are in semi-fowler position while the sai is supine. Note the difference in amplitude. Figure 9. Adjustment of correlation PPC vs. sphygmoma- nometer in the suprasternal zone in supin e in h ealthy sub jects. Figure 10. Adjustment of correlation PPC vs. catheteriza- tion in the suprasternal zone in supine in healthy subjec t s. Table 1. Summary of correlation results PPC vs. blood pres- sure and linear regression. Fitting curve: y = ax + b dV[V] = 0.98x + 9.4 Pearson Spearman Kendall Corr. Coefficient r = 0.91 p = 0.92 τ = 0.82 Table 2. Summary of correlation results PPC vs. catheteri- zation and linear regression. Fitting curve: y = ax + b dV[V] = 0.9x + 12.8 Pearson Spearman Kendall Corr. Coefficient r = 0.95 p = 0.91 τ = 0.79 Figure 11. Area under the curve for the set sai. integrated, there are correlations over 0.9 and p values well below 0.05. Obtaining an excellent correlation and thus validating the measurements using this device. Copyright © 2012 SciRes. OJAppS  T. CORDOVA-FRAGA ET AL. 132 3.3. Hemodynamic Study and Calibration In the cardiac catheterize lab of highly specialized medi- cal unit (HSMU) No.1 at the Mexican Social Security Institute (IMSS), printed data were obtained from the pressure curves recorded by catheterization in 7 patients. The Figure 12 shows one of the curves obtained simul- taneously with the PPC and the polygraph in a cardiac catheter intervention, consi dering the gold st andard. 4. Discussion PPC is a device which measures variations in the in- tensity of a magnetic field generated by a magnetic marker at a fixed distance from a transducer that converts mechanical movement to analog signals and a source to amplify the signals recorded, filter, and stored in a com- puter as digital signal, becoming text file for further study and manipulation. Each of the elements constituting the complete device are easy to transport and install in any area where it is required to measure, only consists of a horseshoe that supports the sensor connected to a flexible tube attached to a microphone stand for easy positioning at the time of measurement and a computer with the software needed to acquire the data. Because of the magnetic field measurements provide a good approximation to see the angular dependence exists around a coaxial cable or a cylindrical permanent magnet, it is the possibility to register the oscillations of a source for a determined distance. This measurement modalities relates the blood pressure carried by the conduits different called vessels and they are divided according to their morphology and function in arteries, veins and capillaries, wh ich not being rigid conduits tend to contract and expand due to the strength that is against the walls to resist the flow of blood pumped by the heart, and this motion due to it is soft waves can be recorded by the PPC successfully locating the vessel to be measured. Figure 12. Superposition of signals obtained with the PPC and polygraph and made the switch from units of volts to The PPC device provides informatio millimeters of mercury in the PPC signal. n (voltage-time) ab s of pr robic/ nd to th forms o btained w ith the PPC are very sensitiv e to e protocol to PPC shows that fo ents to the same test subject was ob out the compliance of the arteries or veins. The maxi- mum value of each wave equals the pressure systolic and the minimums is equal to pressure diastolic, while the decrease or dicrotic wave is related to the backflow of blood, thus has a new way of measuring the patient’s health status, graduating flexibility and arterial diameter with the pressure non-invasively and continuously. The PPC has a good correlation “0.9r” value essure vs. sphygmomanometer (anaedigital), but unlike the sphygmomanometer no have operation on the whole sample. Excluded are subjects mainly in the suprasternal space not have a reflection of the rebound of the arteries confined and also in subjects in which their side zones to the neck is not palpable the location of the carotid arteries and the internal jugular vein, this group includes those individuals who have a body mass index (BMI) greater than 25 kg/m2 and elderly patients. The waveforms obtained with the PPC correspo e cardiac cycle and are similar to the curves obtained by cardiac catheterization. The PPC can help determine one of the many parameters of the catheterization, since it is easy to use and does not require specialized personnel for its use. The wav e any movement of the test subject among which are: respiration, the fluid passes through the esophagus or involuntary displacement. When is standardized th r venous pressure and arterial pressure the waveforms were very similar in terms of amplitude, frequency and period, being that biologically come to have a value deferred of at least 60 mmHG between blood pressure and venous, since the venous for transport higher amounts of blood is not pulsatile compared with the pressure in arteries reaching values of 120 mmHg, while the vein is 5 mm Hg, this is an important consideration when calibrating the PPC in the modalities of arterial and venous pressure. During the measurem served that had a change in amplitude in curves when the variants were apnea in inspiration or aspiration, as, when there deep breath, the chest cavity and the lungs expand, the chest wall expands and diaphragm low. This causes the pressure intrapulmonary becomes more nega- tive, which causes the lungs, heart and the and the thoracic vein cava is expand decreasing the pressure inside them. As the right atrial pressure decreases during inspiration, the pressure gradient between the inferior vein cava and right atrium increases, which impulse blood into the r ight atrium (there is an effect of “suction”), thereby increasing the volume of right ventricular ejection, to the pulmonary circulation. On the other hand, although the atrium and left ventricle also increases volume during inspiration, Copyright © 2012 SciRes. OJAppS  T. CORDOVA-FRAGA ET AL. 133 the lungs in expanding work as a reservoir (increase the volume of pulmonary blood), so that, left ventricular filling does not increase during inspiration. During aspiration, however, is produced the opposite effect: the thoracic cavity volume decreases, because the chest wall is re- tracts and the diaphragm up. This produces a pressure increase intrapulmonary, causing a decrease in lung volume, the heart and the thoracic vena cava. Therefore, the accumulated blood in the pulmonary reservoir during the inspiration is forced to pass into the atrium and left ventricle, which increases left ventricular filling and stroke volume of ejection into the aorta artery, in other words, when inhaled, there is an increase in venous pressure and when exhaling, there is a decrease in this, these small variations are also detected by the PPC. Gravity, temperature and metal objects also affect the m se that suggest the possibility that ha ca 5. Conclusions s shown an excellent signal, w cu th BMI indicating a de sc ore measurements com- pa 6. Acknowledgements artial support to the DAIP REFERENCES [1] S. I. Fox, “Fisaw-Hill, New York, otti, M. Lanti, M. Angeletti, G. Botta, M. Cirilio a1.html html 5 . E. . Paez, C. Galarza and G. Waisman, 0229 easurements. Gravity has a significant effect on blood reservoirs and changes the values of pressure for a person in a supine position, semi-fowler or perfectly straight. The temperature changes the levels distensible of the vessel and metal objects are detected by the PPC due to their magnetic nature. There are no databa s been measured the pressure central with a noninvasive method. The PPC has an advantage at this point, because when positioned a magnet properly according to the anatomy over a vein, can be record the movement of this in a voltage-time signal, considering the magnet as an extension of that place where it is placed, for healthy subjects the vein is best seen in semi-fowler position. For graduation of the units between PPC and the 2003. [2] A. Men rdiac catheterization in the arteries, can be associate a “size” of the curve of blood recorded according to the protocol specified by the pressure units. The size of the curve for both methods is qualitatively and quantitatively similar. It is noteworthy that what is related and it makes sense is talk about the “size” of the curve in the PPC, since it is very sensitive to movement between measurements and also the curve is shifted with respect to a reference level and for another subject does not match the voltage obtained with other measurements of the same subject, however the magnitude or the “size” of the curves can be related to high accuracy. The PPC device hahich “Hemodynamic Significance of High Brachial Pulse Pres- sure in Young Men,” Clinical Hypertension, Vol. 26, No. 3, 2004, pp. 199-207. describes qualitatively and unequivo cally form elevations and depressions corresponding to waves of arterial and venous pressure by noninvasive methods, however is af- fected by characteristics of the medium and particularly by respiration, although it has proven highly correlated with pressur e points o f a sphygmomano meter digital [13] while the gold standard in measuring blood pressure [14]. It has more meaning find the magnitude under the rve, see Figure 11, to relate maximum and minimum to a coordinate of voltage as the device shows a wide variability in their measurements if used at different times with a variation period of 24 h, These results in a descriptive curve outdated even for the same subject, with the same values of pressure. It cannot be used in individuals wi gree of obesity, because both the suprasternal area as the lateral neck show no oscillatory motion of venous and arteries by the large amount of fatty material which causes i t to lo se t he sp rea d of t he m ovem ent of vas odilat io n. If it want to be used for pressure measurement, two ales are needed depending on the type of vessel to measure, because biologically both vessel s sho w pr essure values and curved very characteristic, for th e PPC measur - ing in (voltage-time) and which is already associated with a curve (mmHg-time). It is proposed to carry out m ring the signal acquired by the PPC vs. cardiac cathe- terization, Doppler echocardiography and oscillometric methods. For the venous study a larger sample is needed. The authors acknowledg e the p No. 017/2010 and Universidad De La Salle Bajío P/2011. iología Humana,” McGr and M. Laurenzi, “Twenty-Year Cardiovascular and All- Cause Mortality Trends and Changes in Intravascular Risk Factors,” Vol. 27, 2009, pp. 266-274. [3] www.udec.cl/~ofem/revista/revista02/revist [4] www.juntadeandalucia.es/averroes/2970/salud/servet. [5] www.es.wikipedia.org/wiki/William_Harvey [6] www.annualreviews.org/doi/pdf/10.1146/annurev [7] www.udec.cl/~ofem/revista/revista02/revista1.html [8] J. C. R. Pascual, M. R. Romero, R. C. Cerda and J Morales, “Test de Reac tividad Vascular Pulmonary Blan- hir,” Neumología y Cirugía de Tórax, Vol. 65, No. S4, 2006, pp. S43-S50. [9] J. Alfie, C. Majul, O doi:10.1081/CEH-12003 Scandurra, G. J. Meschino . Devera and F. C. Y R. [10] F.M. Clara, A. Casarini, A. G. and A. R. Introzzi, “Evaluación De Hipertensos en Base a Registros de Variación de diÁmetro Arterial Radial,” Medicina, Vol. 66, No. 6, 2006. [11] D. Bia, I. Aguirre, Y. Zocalo, L Armentano, “Diferencias Regionales en Viscosidad, Ela- Copyright © 2012 SciRes. OJAppS  T. CORDOVA-FRAGA ET AL. Copyright © 2012 SciRes. OJAppS 134 Disipación Energética so Pre- Biomagnética de las Curvas sticidad y Amortiguamiento Parietal de Arterias Sisté- Micas: Análisis Isopulsátil de la Relación Presi Ón- Diámetro Arterial,” Revista Española De Cardiologia, Vol. 58, No. 2, 2005, pp. 844-847. [12] D. R. Armentano and Y. Zócalo, “ sióm y Protección Vascular Durante La Hipertensión Arterial Sistemica: Rol Del Músculo Liso,” Revista Uruguaya de Cardiología, Vol. 20, No. 3, 2005, pp. 125-135. [13] L. A. Romero, “Validación del Dispositivo Pul etro Magnético para la Medición de la Presión Ar- terial Sistémica,” Universidad de Guanajuato División de Ciencias de la Salud, 2011. [14] M. Maldonado, “Medición de Presión Arterial y Venosa,” Universidad de Gua- najuato, 2009. |