

Paper Menu >>
Journal Menu >>
 World Journal of Nano Science and Engineering, 2012, 2, 142-147 http://dx.doi.org/10.4236/wjnse.2012.23018 Published Online September 2012 (http://www.SciRP.org/journal/wjnse) Low Temperature Formation of Silver and Silver-Copper Alloy Nano-Particles Using Plasma Enhanced Hydrogenation and Their Optical Properties Zeinab Kiani, Yaser Abdi, Ezatollah Arzi* Nanophysics Laboratory, Department of Physics, University of Tehran, Tehran, Iran Email: *[email protected] Received November 22, 2011; revised January 12, 2012; accepted May 23, 2012 ABSTRACT In this paper, a novel method of producing nanoparticles at low temperatures using hydrogen bombardment of thin films, deposited on glass substrates, is introduced. Silver nanoparticles were obtained by this method in our Plasma En- hanced Chemical Vapor Deposition system. Optical and morphological characteristics of these nanoparticles were ex- tensively studied for various conditions of plasma treatment, such as plasma power density, temperature, duration of hydrogen bombardment, thickness of the initial thin metallic film etc. In addition, Ag-Cu alloy nanoparticles on glass substrates were also achieved. The process of nanoparticle formation in this method shows that several kinds of metals and semiconductors nanoparticles can be obtained using this approach. Scanning Electron Microscopy, Atomic Force Microscopy and Transmission Electron Microscopy were used to analyze the nanostructures. Keywords: Nanoparticles; Plasma; Hydrogen; PECVD; Silver; Alloy 1. Introduction Because of their linear and nonlinear optical properties, metal nanoparticles have been widely studied in recent years. They are suitable candidates for various devices because of their unique optical [1], electronic [2], cataly- sis [3], chemical [4] properties. Many different methods were applied for producing nanoparticles such as chemi- cal synthesis [5], exploding wire [6], and laser ablation [7]. We have used a novel different method that produces nanoparticles at a temperature much lower than the melting point of their respective bulk using hydrogen plasma in Enhanced Chemical Vapor Deposition system. In this work, silver nanoparticles and bimetallic alloy of silver-copper nanoparticles were produced by this plasma treatment method. This method can also be used for the formation of other metallic or semiconductors nanoparti- cles by PVD method on glass or silicon or other sub- strates, out of which two examples of nickel and silicon nanoparticles are presented. Optical properties of metal nanoparticles are related to the excitation of surface plasmon. The parameters such as size and shape [8,9], surrounding medium [10], metal- lic species [11] of nanoparticles change the excitation energy of surface plasmons. We have investigated the effects of size on the absorption spectra of the nanoparti- cles. 2. Experimental The work started by cleaning the glass substrate in the standard RCA1 solution, which contained NH3/ H2O2/DI-H2O with relative volume proportions of 1:1:5, and followed by the deposition of a thin layer of silver with the thickness of about 10 nm in a thermal evapora- tion system at the base pressure of 5 × 10⁻⁶ torr [Forma- tion of bimetallic alloy nanoparticles needs to evaporate two metallic sources simultaneously in the physical va- por deposition (PVD) system]. The silver-coated glass was then put in the direct current plasma enhanced chemical vapor deposition (DC-PECVD) apparatus, as shown schematically in Figure 1. This DC-PECVD setup has two flat electrodes, made of iron, which hy- drogen plasma forms between them by the application of a voltage between the electrodes. The sample was placed on the cathode (lower electrode) and during the plasma treatment was bombarded by hydrogen radicals. We made an electrical connection between the metallic layer and the cathode to prevent the build up of positive charges on glass substrate that might repel the plasma. The substrate temperature was varied between 200˚C and 400˚C and the hydrogen pressure was maintained at 0.4 - 2 torr during the Plasma treatment in the DC-PECVD *Corresponding author. C opyright © 2012 SciRes. WJNSE 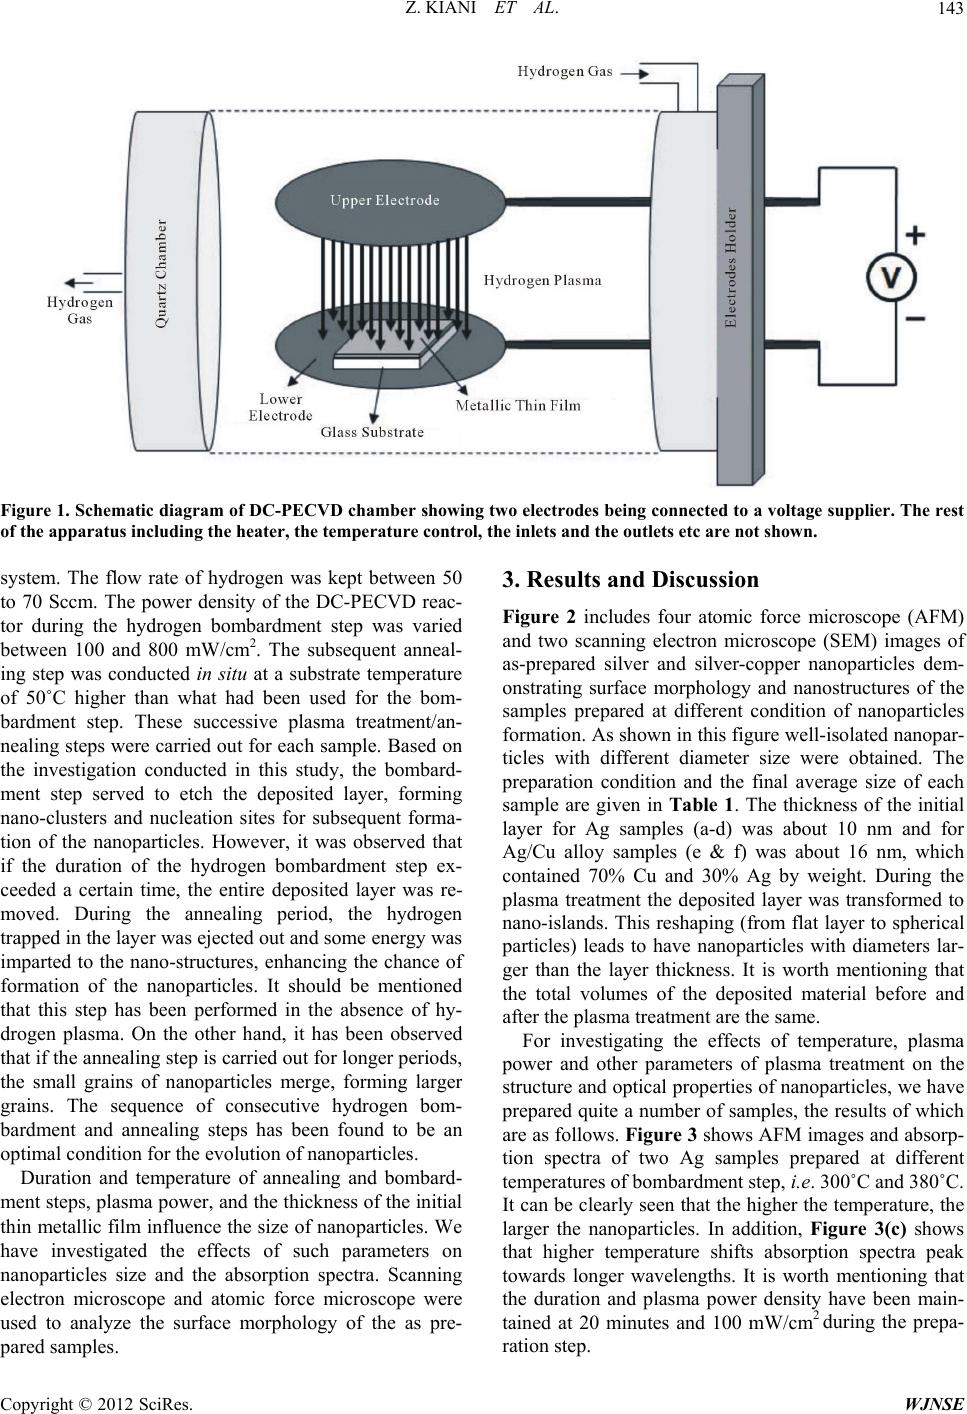 Z. KIANI ET AL. 143 Figure 1. Schematic diagram of DC-PECVD chamber showing tw o electrodes being conne cted to a voltage supplier. The rest of the apparatus including the heater, the temperature control, the inlets and the outlets etc are not shown. system. The flow rate of hydrogen was kept between 50 to 70 Sccm. The power density of the DC-PECVD reac- tor during the hydrogen bombardment step was varied between 100 and 800 mW/cm2. The subsequent anneal- ing step was conducted in situ at a substrate temperature of 50˚C higher than what had been used for the bom- bardment step. These successive plasma treatment/an- nealing steps were carried out for each sample. Based on the investigation conducted in this study, the bombard- ment step served to etch the deposited layer, forming nano-clusters and nucleation sites for subsequent forma- tion of the nanoparticles. However, it was observed that if the duration of the hydrogen bombardment step ex- ceeded a certain time, the entire deposited layer was re- moved. During the annealing period, the hydrogen trapped in the layer was ejected out and some energy was imparted to the nano-structures, enhancing the chance of formation of the nanoparticles. It should be mentioned that this step has been performed in the absence of hy- drogen plasma. On the other hand, it has been observed that if the annealing step is carried out for longer periods, the small grains of nanoparticles merge, forming larger grains. The sequence of consecutive hydrogen bom- bardment and annealing steps has been found to be an optimal condition for the evolution of nanoparticles. Duration and temperature of annealing and bombard- ment steps, plasma power, and the thickness of the initial thin metallic film influence the size of nanoparticles. We have investigated the effects of such parameters on nanoparticles size and the absorption spectra. Scanning electron microscope and atomic force microscope were used to analyze the surface morphology of the as pre- pared samples. 3. Results and Discussion Figure 2 includes four atomic force microscope (AFM) and two scanning electron microscope (SEM) images of as-prepared silver and silver-copper nanoparticles dem- onstrating surface morphology and nanostructures of the samples prepared at different condition of nanoparticles formation. As shown in this figure well-isolated nanopar- ticles with different diameter size were obtained. The preparation condition and the final average size of each sample are given in Table 1. The thickness of the initial layer for Ag samples (a-d) was about 10 nm and for Ag/Cu alloy samples (e & f) was about 16 nm, which contained 70% Cu and 30% Ag by weight. During the plasma treatment the deposited layer was transformed to nano-islands. This reshaping (from flat layer to spherical particles) leads to have nanoparticles with diameters lar- ger than the layer thickness. It is worth mentioning that the total volumes of the deposited material before and after the plasma treatment are the same. For investigating the effects of temperature, plasma power and other parameters of plasma treatment on the structure and optical properties of nanoparticles, we have prepared quite a number of samples, the results of which are as follows. Figure 3 shows AFM images and absorp- tion spectra of two Ag samples prepared at different temperatures of bombardment step, i.e. 300˚C and 380˚C. It can be clearly seen that the higher the temperature, the larger the nanoparticles. In addition, Figure 3(c) shows that higher temperature shifts absorption spectra peak towards longer wavelengths. It is worth mentioning that the duration and plasma power density have been main- tained at 20 minutes and 100 mW/cm2 during the prepa- ration step. Copyright © 2012 SciRes. WJNSE 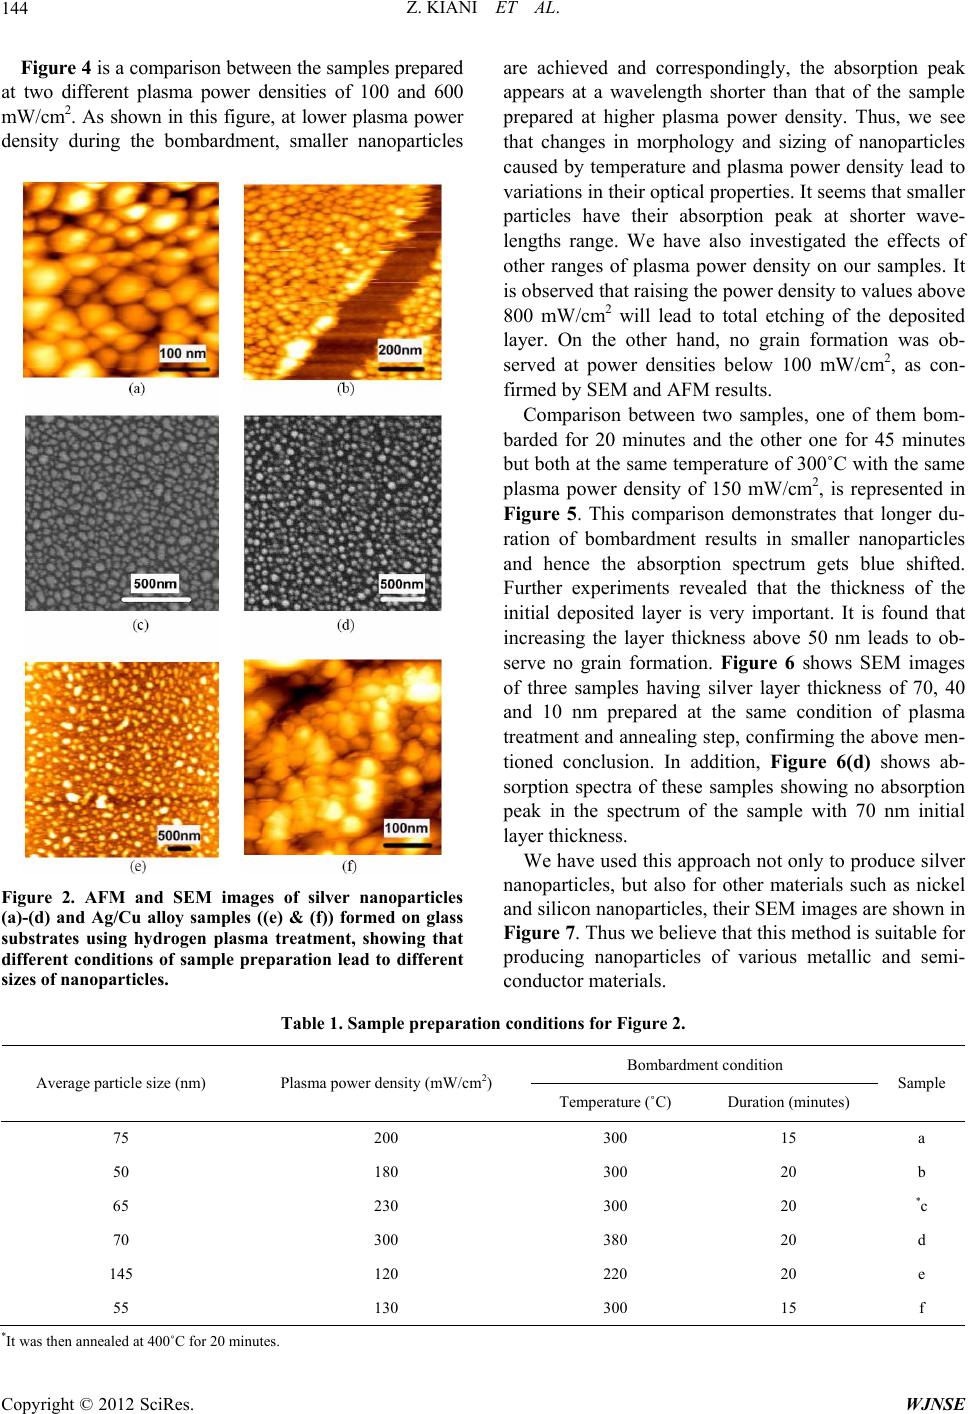 Z. KIANI ET AL. 144 Figure 4 is a comparison between the samples prepared at two different plasma power densities of 100 and 600 mW/cm2. As shown in this figure, at lower plasma power density during the bombardment, smaller nanoparticles Figure 2. AFM and SEM images of silver nanoparticles (a)-(d) and Ag/Cu alloy samples ((e) & (f)) formed on glass substrates using hydrogen plasma treatment, showing that different conditions of sample preparation lead to different sizes of nanoparticles. are achieved and correspondingly, the absorption peak appears at a wavelength shorter than that of the sample prepared at higher plasma power density. Thus, we see that changes in morphology and sizing of nanoparticles caused by temperature and plasma power density lead to variations in their optical properties. It seems that smaller particles have their absorption peak at shorter wave- lengths range. We have also investigated the effects of other ranges of plasma power density on our samples. It is observed that raising the power density to values above 800 mW/cm2 will lead to total etching of the deposited layer. On the other hand, no grain formation was ob- served at power densities below 100 mW/cm2, as con- firmed by SEM and AFM results. Comparison between two samples, one of them bom- barded for 20 minutes and the other one for 45 minutes but both at the same temperature of 300˚C with the same plasma power density of 150 mW/cm2, is represented in Figure 5. This comparison demonstrates that longer du- ration of bombardment results in smaller nanoparticles and hence the absorption spectrum gets blue shifted. Further experiments revealed that the thickness of the initial deposited layer is very important. It is found that increasing the layer thickness above 50 nm leads to ob- serve no grain formation. Figure 6 shows SEM images of three samples having silver layer thickness of 70, 40 and 10 nm prepared at the same condition of plasma treatment and annealing step, confirming the above men- tioned conclusion. In addition, Figure 6(d) shows ab- sorption spectra of these samples showing no absorption peak in the spectrum of the sample with 70 nm initial layer thickness. We have used this approach not only to produce silver nanoparticles, but also for other materials such as nickel and silicon nanoparticles, their SEM images are shown in Figure 7. Thus we believe that this method is suitable for producing nanoparticles of various metallic and semi- conductor materials. Table 1. Sample preparation conditions for Figure 2. Bombardment condition Average particle size (nm) Plasma power density (mW/cm2) Temperature (˚C) Duration (minutes) Sample 75 200 300 15 a 50 180 300 20 b 65 230 300 20 *c 70 300 380 20 d 145 120 220 20 e 55 130 300 15 f * It was then annealed at 400˚C for 20 minutes. Copyright © 2012 SciRes. WJNSE 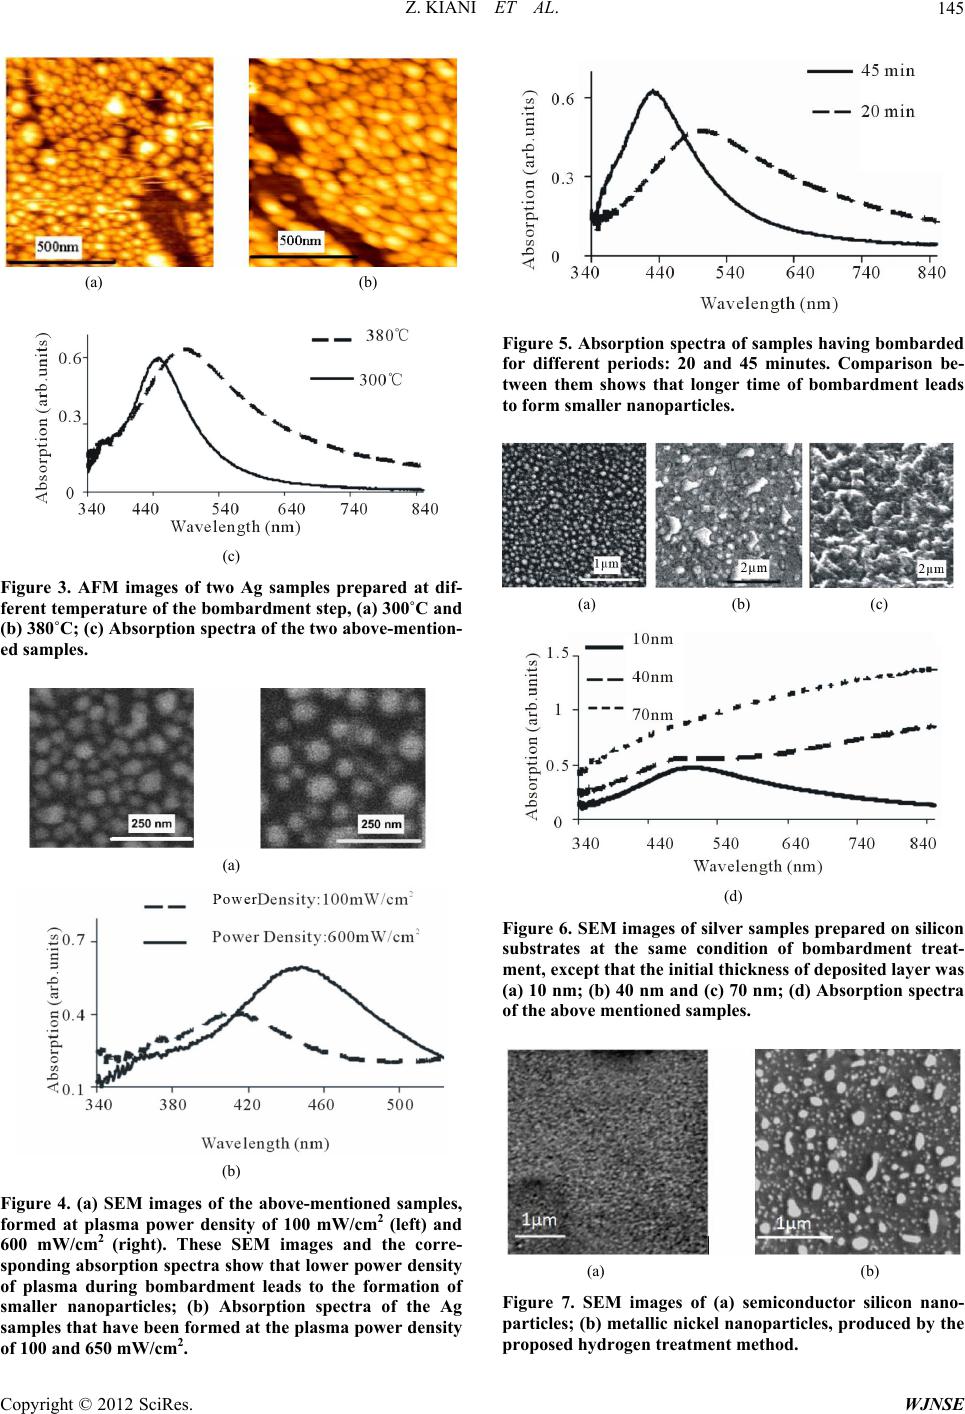 Z. KIANI ET AL. 145 (a) (b) (c) Figure 3. AFM images of two Ag samples prepared at dif- ferent temperature of the bombardment step, (a) 300˚C and (b) 380˚C; (c) Absorption spectra of the two above-mention- ed samples. (a) (b) Figure 4. (a) SEM images of the above-mentioned samples, formed at plasma power density of 100 mW/cm2 (left) and 600 mW/cm2 (right). These SEM images and the corre- sponding absorption spectra show that lower power density of plasma during bombardment leads to the formation of smaller nanoparticles; (b) Absorption spectra of the Ag samples that have been formed at the plasma power density of 100 and 650 mW/cm2. Figure 5. Absorption spectra of samples having bombarded for different periods: 20 and 45 minutes. Comparison be- tween them shows that longer time of bombardment leads to form smaller nanoparticles. (a) (b) (c) (d) Figure 6. SEM images of silver samples prepared on silicon substrates at the same condition of bombardment treat- ment, except that the initial thickness of deposited layer was (a) 10 nm; (b) 40 nm and (c) 70 nm; (d) Absorption spectra of the above mentioned samples. (a) (b) Figure 7. SEM images of (a) semiconductor silicon nano- particles; (b) metallic nickel nanoparticles, produced by the proposed hydrogen tre atment method. Copyright © 2012 SciRes. WJNSE 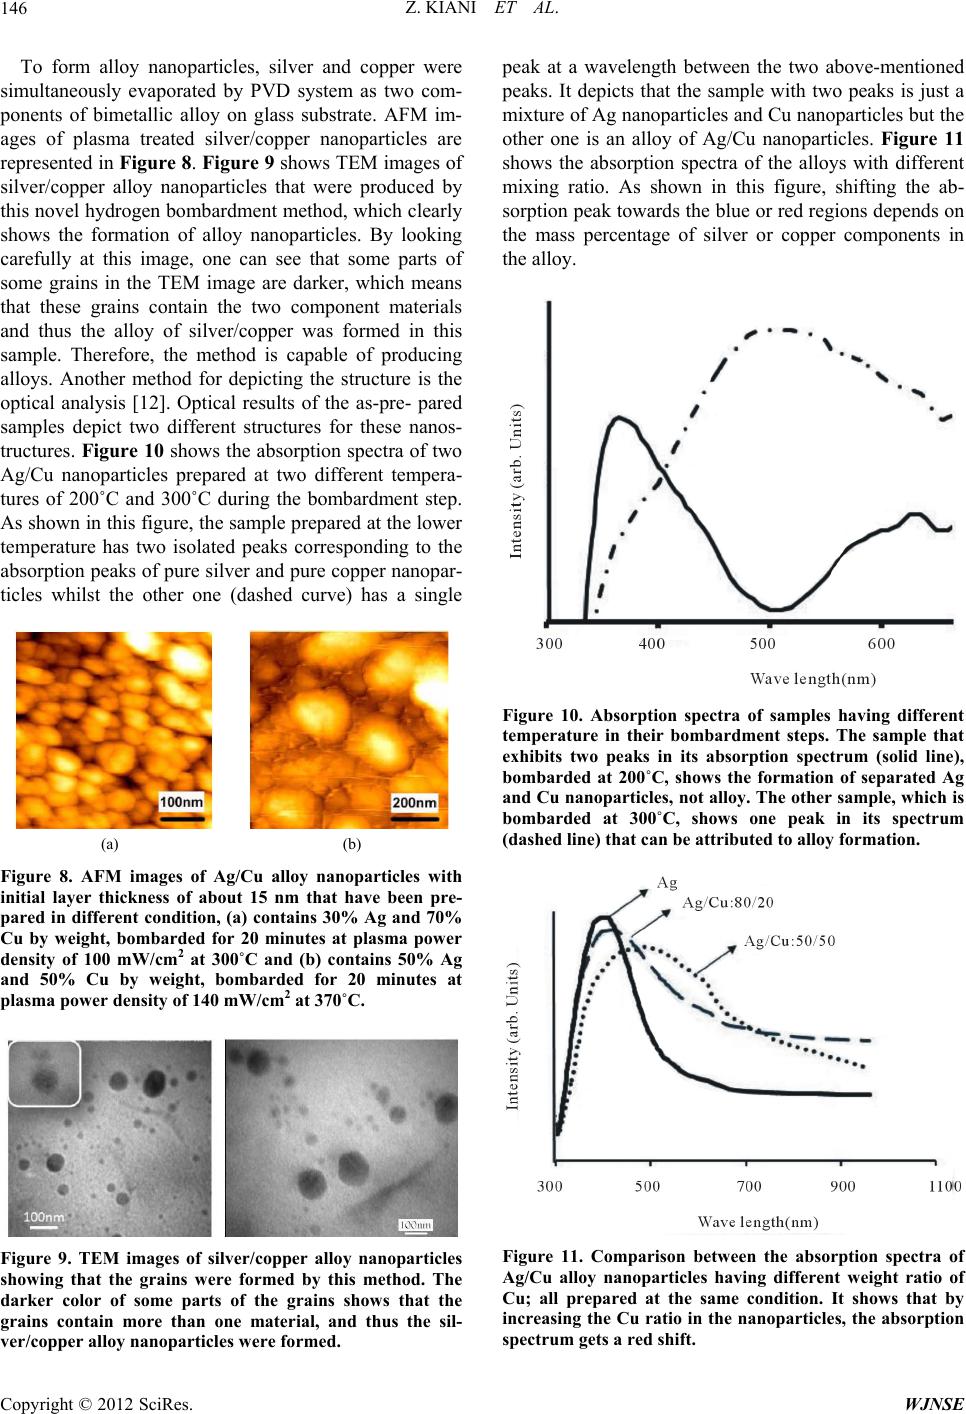 Z. KIANI ET AL. 146 To form alloy nanoparticles, silver and copper were simultaneously evaporated by PVD system as two com- ponents of bimetallic alloy on glass substrate. AFM im- ages of plasma treated silver/copper nanoparticles are represented in Figure 8. Figure 9 shows TEM images of silver/copper alloy nanoparticles that were produced by this novel hydrogen bombardment method, which clearly shows the formation of alloy nanoparticles. By looking carefully at this image, one can see that some parts of some grains in the TEM image are darker, which means that these grains contain the two component materials and thus the alloy of silver/copper was formed in this sample. Therefore, the method is capable of producing alloys. Another method for depicting the structure is the optical analysis [12]. Optical results of the as-pre- pared samples depict two different structures for these nanos- tructures. Figure 10 shows the absorption spectra of two Ag/Cu nanoparticles prepared at two different tempera- tures of 200˚C and 300˚C during the bombardment step. As shown in this figure, the sample prepared at the lower temperature has two isolated peaks corresponding to the absorption peaks of pure silver and pure copper nanopar- ticles whilst the other one (dashed curve) has a single (a) (b) Figure 8. AFM images of Ag/Cu alloy nanoparticles with initial layer thickness of about 15 nm that have been pre- pared in different condition, (a) contains 30% Ag and 70% Cu by weight, bombarded for 20 minutes at plasma power density of 100 mW/cm2 at 300˚C and (b) contains 50% Ag and 50% Cu by weight, bombarded for 20 minutes at plasma power density of 140 mW/cm2 at 370˚C. Figure 9. TEM images of silver/copper alloy nanoparticles showing that the grains were formed by this method. The darker color of some parts of the grains shows that the grains contain more than one material, and thus the sil- ver/copper alloy nanoparticles were formed. peak at a wavelength between the two above-mentioned peaks. It depicts that the sample with two peaks is just a mixture of Ag nanoparticles and Cu nanoparticles but the other one is an alloy of Ag/Cu nanoparticles. Figure 11 shows the absorption spectra of the alloys with different mixing ratio. As shown in this figure, shifting the ab- sorption peak towards the blue or red regions depends on the mass percentage of silver or copper components in the alloy. Figure 10. Absorption spectra of samples having different temperature in their bombardment steps. The sample that exhibits two peaks in its absorption spectrum (solid line), bombarded at 200˚C, shows the formation of separated Ag and Cu nanoparticles, not alloy. The other sample , which is bombarded at 300˚C, shows one peak in its spectrum (dashed line) that can be attributed to alloy for mation. Figure 11. Comparison between the absorption spectra of Ag/Cu alloy nanoparticles having different weight ratio of Cu; all prepared at the same condition. It shows that by increasing the Cu ratio in the nanoparticles, the absorption spectrum gets a red shift. Copyright © 2012 SciRes. WJNSE 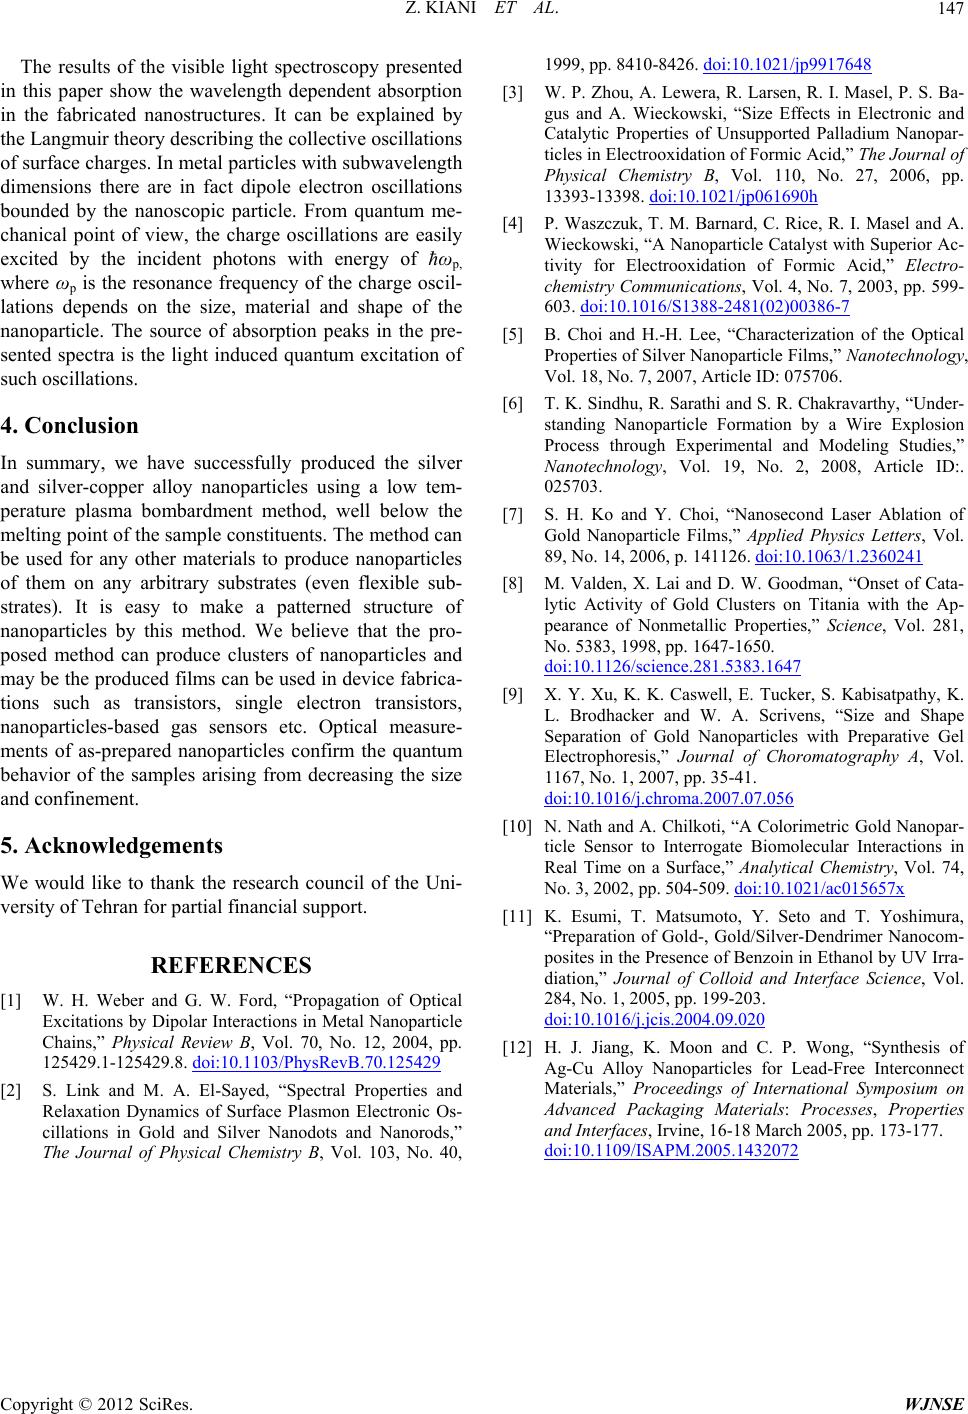 Z. KIANI ET AL. Copyright © 2012 SciRes. WJNSE 147 The results of the visible light spectroscopy presented in this paper show the wavelength dependent absorption in the fabricated nanostructures. It can be explained by the Langmuir theory describing the collective oscillations of surface charges. In metal particles with subwavelength dimensions there are in fact dipole electron oscillations bounded by the nanoscopic particle. From quantum me- chanical point of view, the charge oscillations are easily excited by the incident photons with energy of ћωp, where ωp is the resonance frequency of the charge oscil- lations depends on the size, material and shape of the nanoparticle. The source of absorption peaks in the pre- sented spectra is the light induced quantum excitation of such oscillations. 4. Conclusion In summary, we have successfully produced the silver and silver-copper alloy nanoparticles using a low tem- perature plasma bombardment method, well below the melting point of the sample constituents. The method can be used for any other materials to produce nanoparticles of them on any arbitrary substrates (even flexible sub- strates). It is easy to make a patterned structure of nanoparticles by this method. We believe that the pro- posed method can produce clusters of nanoparticles and may be the produced films can be used in device fabrica- tions such as transistors, single electron transistors, nanoparticles-based gas sensors etc. Optical measure- ments of as-prepared nanoparticles confirm the quantum behavior of the samples arising from decreasing the size and confinement. 5. Acknowledgements We would like to thank the research council of the Uni- versity of Tehran for partial financial support. REFERENCES [1] W. H. Weber and G. W. Ford, “Propagation of Optical Excitations by Dipolar Interactions in Metal Nanoparticle Chains,” Physical Review B, Vol. 70, No. 12, 2004, pp. 125429.1-125429.8. doi:10.1103/PhysRevB.70.125429 [2] S. Link and M. A. El-Sayed, “Spectral Properties and Relaxation Dynamics of Surface Plasmon Electronic Os- cillations in Gold and Silver Nanodots and Nanorods,” The Journal of Physical Chemistry B, Vol. 103, No. 40, 1999, pp. 8410-8426. doi:10.1021/jp9917648 [3] W. P. Zhou, A. Lewera, R. Larsen, R. I. Masel, P. S. Ba- gus and A. Wieckowski, “Size Effects in Electronic and Catalytic Properties of Unsupported Palladium Nanopar- ticles in Electrooxidation of Formic Acid,” The Journal of Physical Chemistry B, Vol. 110, No. 27, 2006, pp. 13393-13398. doi:10.1021/jp061690h [4] P. Waszczuk, T. M. Barnard, C. Rice, R. I. Masel and A. Wieckowski, “A Nanoparticle Catalyst with Superior Ac- tivity for Electrooxidation of Formic Acid,” Electro- chemistry Communications, Vol. 4, No. 7, 2003, pp. 599- 603. doi:10.1016/S1388-2481(02)00386-7 [5] B. Choi and H.-H. Lee, “Characterization of the Optical Properties of Silver Nanoparticle Films,” Nanotechnology, Vol. 18, No. 7, 2007, Article ID: 075706. [6] T. K. Sindhu, R. Sarathi and S. R. Chakravarthy, “Under- standing Nanoparticle Formation by a Wire Explosion Process through Experimental and Modeling Studies,” Nanotechnology, Vol. 19, No. 2, 2008, Article ID:. 025703. [7] S. H. Ko and Y. Choi, “Nanosecond Laser Ablation of Gold Nanoparticle Films,” Applied Physics Letters, Vol. 89, No. 14, 2006, p. 141126. doi:10.1063/1.2360241 [8] M. Valden, X. Lai and D. W. Goodman, “Onset of Cata- lytic Activity of Gold Clusters on Titania with the Ap- pearance of Nonmetallic Properties,” Science, Vol. 281, No. 5383, 1998, pp. 1647-1650. doi:10.1126/science.281.5383.1647 [9] X. Y. Xu, K. K. Caswell, E. Tucker, S. Kabisatpathy, K. L. Brodhacker and W. A. Scrivens, “Size and Shape Separation of Gold Nanoparticles with Preparative Gel Electrophoresis,” Journal of Choromatography A, Vol. 1167, No. 1, 2007, pp. 35-41. doi:10.1016/j.chroma.2007.07.056 [10] N. Nath and A. Chilkoti, “A Colorimetric Gold Nanopar- ticle Sensor to Interrogate Biomolecular Interactions in Real Time on a Surface,” Analytical Chemistry, Vol. 74, No. 3, 2002, pp. 504-509. doi:10.1021/ac015657x [11] K. Esumi, T. Matsumoto, Y. Seto and T. Yoshimura, “Preparation of Gold-, Gold/Silver-Dendrimer Nanocom- posites in the Presence of Benzoin in Ethanol by UV Irra- diation,” Journal of Colloid and Interface Science, Vol. 284, No. 1, 2005, pp. 199-203. doi:10.1016/j.jcis.2004.09.020 [12] H. J. Jiang, K. Moon and C. P. Wong, “Synthesis of Ag-Cu Alloy Nanoparticles for Lead-Free Interconnect Materials,” Proceedings of International Symposium on Advanced Packaging Materials: Processes, Properties and Interfaces, Irvine, 16-18 March 2005, pp. 173-177. doi:10.1109/ISAPM.2005.1432072 |