

Paper Menu >>
Journal Menu >>
 E-Health Telecommunication Systems and Networks, 2012, 1, 27-36 http://dx.doi.org/10.4236/etsn.2012.13005 Published Online September 2012 (http://www.SciRP.org/journal/etsn) Performance Evaluation of Healthcare Monitoring System over Heterogeneous Wireless Networks Sabato Manfredi Faculty of Engineering, University of Naples Federico II, Napoli, Italy Email: [email protected] Received July 1, 2012; revised August 5, 2012; accepted August 12, 2012 ABSTRACT The wide diffusion of healthcare monitoring systems allows continuous patient to be remotely monitored and diagnosed by doctors. The problem of congestion, namely due to the uncontrolled increase of traffic with respect to the network capacity, is one of the most common phenomena affecting the reliability of transmission of information in any network. The aim of the paper is to build a realistic simulation environment for healthcare system including some of the main vital signs model, wireless sensor and mesh network protocols implementation. The simulator environment is an effi- cient mean to analyze and evaluate in a realistic scenario the healthcare system performance in terms of reliability and efficiency. Keywords: Modeling, Simulation and Management of Health-Care Systems; Applications of Information and Communication Technologies to Health-Care Management; E-Health; Remote Health Monitoring; Telemedicine; Chronic Disease Management 1. Introduction The recent increased interest in distributed and flexible wireless pervasive applications has drawn great attention to the QoS (Quality of Service) requirements of WNCS (Wireless Network Control System) architectures based on WSANs (Wireless Sensor Actuator Networks) ([1]). Wireless data communication networks provide reduced costs, better power management, easier maintenance and effortless deployment in remote and hard-to-reach areas. Although WSAN research was originally undertaken for military applications, as the field slowly matured and technology rapidly advanced, it has been extended to many civilian applications such as environment and habitat monitoring, home automation, traffic control, and more recently healthcare applications [2,3,5-8]. In par- ticular, WBAN (Wireless Body Area Network) technol- ogy has recently significantly increased the potential of remote healthcare monitoring systems (e.g. [4,9,10]). WBAN is a particular kind of WSAN consisting of stra- tegically placed wearable or implanted (in the body) wireless sensor nodes that transmit vital signs (e.g. heart rate, blood pressure, temperature, pH, respiration, oxygen saturation) without limiting the activities of the wearer. The data gathered can be forwarded in real time to the hospital, clinic, or central repository through a LAN (Local Area Network), WAN (Wide Area Network) or cellular network. Doctors and carers can at a distance access this information to assess the state of health of the patient. Additionally, the patient can be alerted by using SMS, alarm, or reminder messages. In a more advanced WBAN, a patient’s sensor can even use a neighbor sen- sor to relay its data if the patient is too far away from the central server (e.g. the hospital data storage). This com- munication mode is called “multi-hop” wireless trans- mission. Generally speaking, multi-hop not only extends the communication distance but also saves energy con- sumption since direct sensor-server long distance wire- less communication is avoided through hop-to-hop relay. WBANs will become increasingly pervasive in our daily lives. Recently, WBAN (Wireless Body Area Network) technology has significantly increased the potentiality of the remote healthcare monitoring systems [12,18]. Pa- tient is integrated from multiple sources of measure, PoC (Point of Care) devices, enabling individuals to accu- rately, easily, and efficiently generate and collect health- care data. The microelectronics industry are providing an increasing number of PoC devices that combine analysis, power efficiency and testing functionalities with a simple user interface, addressing constraints like device weara- bility and networking [13-17]. Transmission needs to be performed for communicating the collected physiological signals from the PoC devices to the sink node (i.e. PDA, a smart-phone, or a custom designed microcontroller- based device) and eventually for sending the aggregated measurements to a remote medical station. PoC nodes C opyright © 2012 SciRes. ETSN  S. MANFREDI 28 form a cluster of Wireless Body Area Network (WBAN) and are usually in the basic configuration of a star topol- ogy, transmitting information to the sink node that pro- vides the functionality of collecting data and routing them to the remote station (i.e. Hospital terminal) by a Wireless Mesh Network (WMN). There is a wide variety of available wireless technologies that can serve data transmission between the sink node and a remote station such as WLAN, GSM, GPRS, UMTS, and WiMAX. On the other side, wireless communication standards utilized for short range intra-BAN communication (between PoC node and sink terminal) are IEEE 802.15.1 (Bluetooth [20]) and 802.15.4 (i.e. Zigbee [19]). The Zigbee stan- dard [19] targets low-cost, low data-rate solutions with multimonth-to-multiyear battery life, and very low com- plexity. Bluetooth [20] is a low-power and low-cost RF standard, operating in the unlicensed 2.4 GHz spectrum. Recently, the 802.15.6 IEEE Task Group [21] is planning the development of a communication standard optimized aimed to define BAN that works at a range even shorter than other wireless technologies that are already avail- able in the market. The wide diffusion of healthcare monitoring systems allows continuous patients to be remotely monitored and diagnosed by doctors. The problem of congestion, namely due to the uncontrolled increase of traffic with respect to the network capacity, is one of the most com- mon phenomena affecting the reliability of transmission of information and the loss of packets in any network. In addition, in wireless sensor networks, it increases the dissipated energy at the sensor node. In many health care applications (i. e. fetal electrocardiogram monitoring, tele- cardiology), communication links carry vital information between patient and monitoring devices, that need to be transmitted in short “bursts”, requiring a reliable connec- tion. So it is a focal issue, especially in PoC health care systems, to design an appropriate protocol solution ad- dressing reliability, energy efficiency, scalability, re- duced packet losses, timely delivery without failure. By large the problem of congestion in both wireless and wired communication networks has addressed in recent years a number of research efforts (see i.e. [24-28,31] and references therein). One of the generic approaches for congestion control is to control the rate of flow of traffic to a source node (i.e. [22,23]) by allocating the available resource capacity following some fairness cri- teria (i.e. max min, proportional). In those cases, conges- tion control mechanisms are regarded as a distributed algorithm carried out by sources and links in order to solve a global optimization problem (see [29-32] and references therein). Preliminary routing based appro- aches to congestion control in healthcare system are pre- sented in [33,34]. In this scenario we introduce a realistic simulator for heathcare system evaluation. Specifically, we build a realistic simulation environment including the main vital signs and wireless networks protocols model- ling. The simulator environment is used to analyze and evaluate the effect of congestion phenomena on the healthcare system performance in terms of reliability and efficiency. The simulator can be used for validating novel congestion control scheme to mitigate the conges- tion phenomena and guarantee efficient healthcare ser- vice delivery. The rest of the paper is outlined as follows. In Section 2 the evaluation environment is described in terms of healthcare network topology, communication protocols, performance metrics and vital signals, while in Section 3 a simulation analysis of congestion effect on healthcare system performance is shown. Finally, conclusions and future work are outlined in Section 4. 2. Healthcare System Simulation and Evaluation Environment Most of healthcare system scenario is composed of a cluster of WBANs relaying vital information to the Hos- pital (H) by a WMN. Each WBAN is characterized by the “many-to-one” traffic patterns with a single sink node and multiple source PoC nodes which can be considered to be affixed with the patients. In the paper we will pay our attention to such representative healthcare topology scenario in which all the PoC sensor nodes are stationary and transmit data to the Hospital terminal (H) by the sink terminal data collector. The communication between the sinks and the Hospital terminal is guaranteed by a wire- less mesh network. This results in heterogeneous wire- less communication network as it is composed of devices adopting different protocols such as Zigbee and Wifi. Herein we set up an evaluation environment in Mat- lab/Simulink-based simulator TrueTime [41], which fa- cilitates co-simulation of controller task execution in real-time kernels and wireless network environment. The simulations are performed using the above topology of sensors randomly transmitting their information to the sink. The intra BAN protocol used for PoC-Sink com- munication is the standard Zigbee, while the protocol of WMN supporting sink-remote Hospital terminal com- munication is Wifi 802.11. Specifically, we build the simulation environment including the following models: The intra WBAN standard protocol Zigbee used for PoC sensors-Sink communication; The wireless mesh protocol Wifi 802.11 supporting sinks-remote Hospital terminal communication; The Ad-hoc On-Demand Distance Vector Routing Protocol (AODV) to route packets in the network; The models of the main vital signs such as respiration, electrocardiogram, fetal electrocardiogram, the oxy- gen saturation of the pacemaker control system de- vice. Copyright © 2012 SciRes. ETSN  S. MANFREDI 29 In addition, the simulation model takes the path-loss of the radio signals into account. The radio model includes support for 1) ad-hoc wireless networks; 2) isotropic an- tenna; 3) inability to send and receive messages at the same time; 4) path loss of radio signals modelled as 1d where d is the distance and α is a parameter cho- sen to model the environment ranging in [2,4]; 5) inter- ference from other terminals. In what follows we will describe the details of the above components and we will present the main performance metrics considered in the paper. Moreover, we have enhanced the simulation envi- ronment by introducing realistic modelling of PoC sensor power consumption. 2.1. Wifi Protocol Model Simulation The IEEE 802.11b is modeled taking into account of the channel access method CSMA/CA (Carrier Sense Multi- ple Access with Collision Avoidance). Specifically, in the simulation, a transmission is modelled like this: The node that wants to transmit a packet checks to see if the medium is idle. The transmission may proceed, if the medium is found to be idle, and has stayed so for 50 μs. If, on the other hand, the medium is found to be busy, a random back-off time is chosen and decremented in the same way as when colliding. When a node starts to transmit, its relative position to all other nodes in the same network is calculated, and the signal level in all those nodes are calculated according to the path-loss formula 1d . The signal is assumed to be possible to detect if the signal level in the receiving node is larger than the receiver signal threshold. If this is the case, then the signal-to-noise ratio (SNR) is calculated and used to find the block error rate (BLER). Note that all other transmissions add to the background noise when calcu- lating the SNR. The BLER, together with the size of the message, is used to calculate the number of bit errors in the message and if the percentage of bit errors is lower than the error coding threshold, then it is assumed that the channel coding scheme is able to fully reconstruct the message. If there are (already) ongoing transmissions from other nodes to the receiving node and their respec- tive SNRs are lower than the new one, then all those messages are marked as collided. Also, if there are other ongoing transmissions which the currently sending node reaches with its transmission, then those messages may be marked as collided as well. Note that a sending node does not know if its message is colliding, therefore ACK (Acknowledge) messages are sent on the MAC protocol layer. From the perspective of the sending node, lost messages and message collisions are the same, i.e. no ACK is received. If no ACK is received during ACK timeout, the message is retransmitted after waiting for a random back-off time within a contention window. The contention window size is doubled for every retransmis- sion of a certain message. The back-off timer is stopped if the medium is busy, or if it has not been idle for at least 50 μs. There are only “Retry limit” number of re- transmissions before the sender gives up on the message and it is not retransmitted anymore. 2.2. ZigBee Protocol Model Simulation ZigBee has a rather low bandwidth, but also a really low power consumption. Although it is based on CSMA/CA as 802.11 b/g, it is much simpler and the protocols are not the same. The packet transmission model in ZigBee is similar to WLAN, but the MAC procedure differs and is modeled taking into account of the following vari- ables: NB, number of backoffs; BE, backoff exponent; MacMinBE, the minimum value of the backoff ex- ponent in the CSMA/CA algorithm. The default value is 3; AMaxBE, The maximum value of the backoff exponent in the CSMA/CA algorithm. The default value is 5; MacMaxCSMABackoffs, the maximum number of backoffs the CSMA/CA algorithm will attempt before declaring a channel access failure. The default value is 4; In a Rayleigh fading, the relative speed of two nodes and the number of multiple paths that the signal takes from the sender to the receiver is taken into account. The basic battery uses a simple integrator model, so it can be both charged and recharged. We have enhanced the model by implementing the power consumption model described in [35] including the energy spent by the PoC sensor to transmit and receive packets. The main protocol simulation parameters are summarized in Table 1. 2.3. AODV Routing Protocol The Ad-hoc On-Demand Distance Vector Routing Pro- tocol (AODV) [11] is one common routing algorithm in ad hoc networks and is based on the principle of discov- ering routes as needed. AODV is a reactive algorithm that has a low network utilization, processing and mem- ory overheads. The request is made on-demand rather than in advance, to take into account the dynamic chang- ing of a network structure. In the AODV routing algo- rithm, the source node issues a route request packet to the destination node at the time a path is needed and this allows mobile nodes to pass messages through their neighbors to nodes with which they cannot directly communicate. AODV does this by discovering the routes (the discovery phase) along which messages can be passed. AODV makes sure these routes do not contain loops and tries to find the shortest route possible. AODV Copyright © 2012 SciRes. ETSN 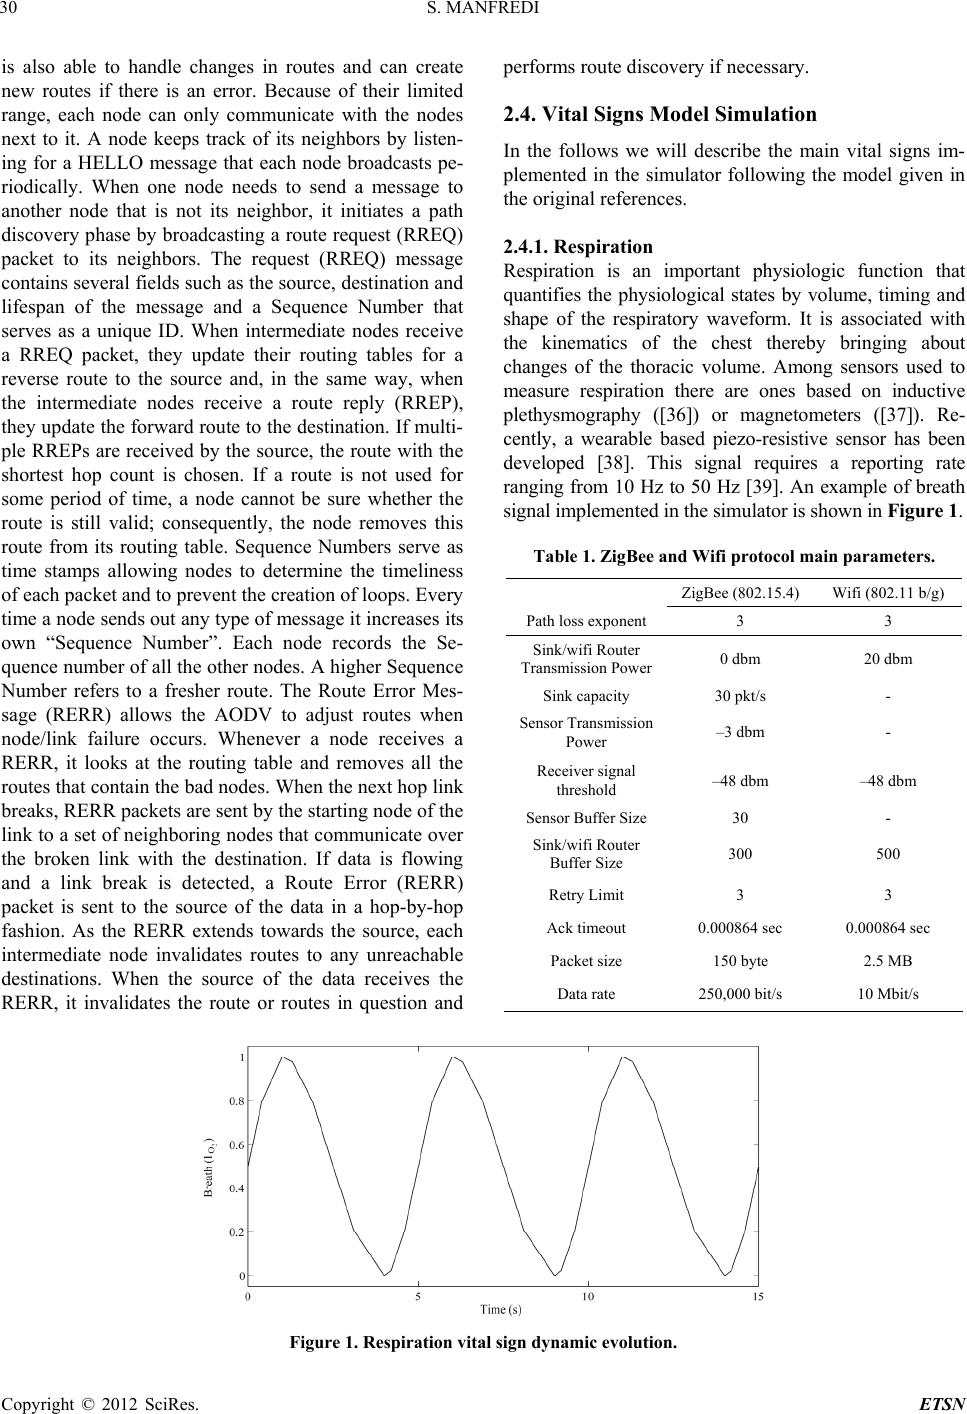 S. MANFREDI Copyright © 2012 SciRes. ETSN 30 performs route discovery if necessary. is also able to handle changes in routes and can create new routes if there is an error. Because of their limited range, each node can only communicate with the nodes next to it. A node keeps track of its neighbors by listen- ing for a HELLO message that each node broadcasts pe- riodically. When one node needs to send a message to another node that is not its neighbor, it initiates a path discovery phase by broadcasting a route request (RREQ) packet to its neighbors. The request (RREQ) message contains several fields such as the source, destination and lifespan of the message and a Sequence Number that serves as a unique ID. When intermediate nodes receive a RREQ packet, they update their routing tables for a reverse route to the source and, in the same way, when the intermediate nodes receive a route reply (RREP), they update the forward route to the destination. If multi- ple RREPs are received by the source, the route with the shortest hop count is chosen. If a route is not used for some period of time, a node cannot be sure whether the route is still valid; consequently, the node removes this route from its routing table. Sequence Numbers serve as time stamps allowing nodes to determine the timeliness of each packet and to prevent the creation of loops. Every time a node sends out any type of message it increases its own “Sequence Number”. Each node records the Se- quence number of all the other nodes. A higher Sequence Number refers to a fresher route. The Route Error Mes- sage (RERR) allows the AODV to adjust routes when node/link failure occurs. Whenever a node receives a RERR, it looks at the routing table and removes all the routes that contain the bad nodes. When the next hop link breaks, RERR packets are sent by the starting node of the link to a set of neighboring nodes that communicate over the broken link with the destination. If data is flowing and a link break is detected, a Route Error (RERR) packet is sent to the source of the data in a hop-by-hop fashion. As the RERR extends towards the source, each intermediate node invalidates routes to any unreachable destinations. When the source of the data receives the RERR, it invalidates the route or routes in question and 2.4. Vital Signs Model Simulation In the follows we will describe the main vital signs im- plemented in the simulator following the model given in the original references. 2.4.1. Respir a ti on Respiration is an important physiologic function that quantifies the physiological states by volume, timing and shape of the respiratory waveform. It is associated with the kinematics of the chest thereby bringing about changes of the thoracic volume. Among sensors used to measure respiration there are ones based on inductive plethysmography ([36]) or magnetometers ([37]). Re- cently, a wearable based piezo-resistive sensor has been developed [38]. This signal requires a reporting rate ranging from 10 Hz to 50 Hz [39]. An example of breath signal implemented in the simulator is shown in Figure 1. Table 1. ZigBee and Wifi protocol main parameters. ZigBee (802.15.4) Wifi (802.11 b/g) Path loss exponent 3 3 Sink/wifi Router Transmission Power0 dbm 20 dbm Sink capacity 30 pkt/s - Sensor Transmission Power –3 dbm - Receiver signal threshold –48 dbm –48 dbm Sensor Buffer Size 30 - Sink/wifi Router Buffer Size 300 500 Retry Limit 3 3 Ack timeout 0.000864 sec 0.000864 sec Packet size 150 byte 2.5 MB Data rate 250,000 bit/s 10 Mbit/s Figure 1. Respiration vital sign dynamic evolution. 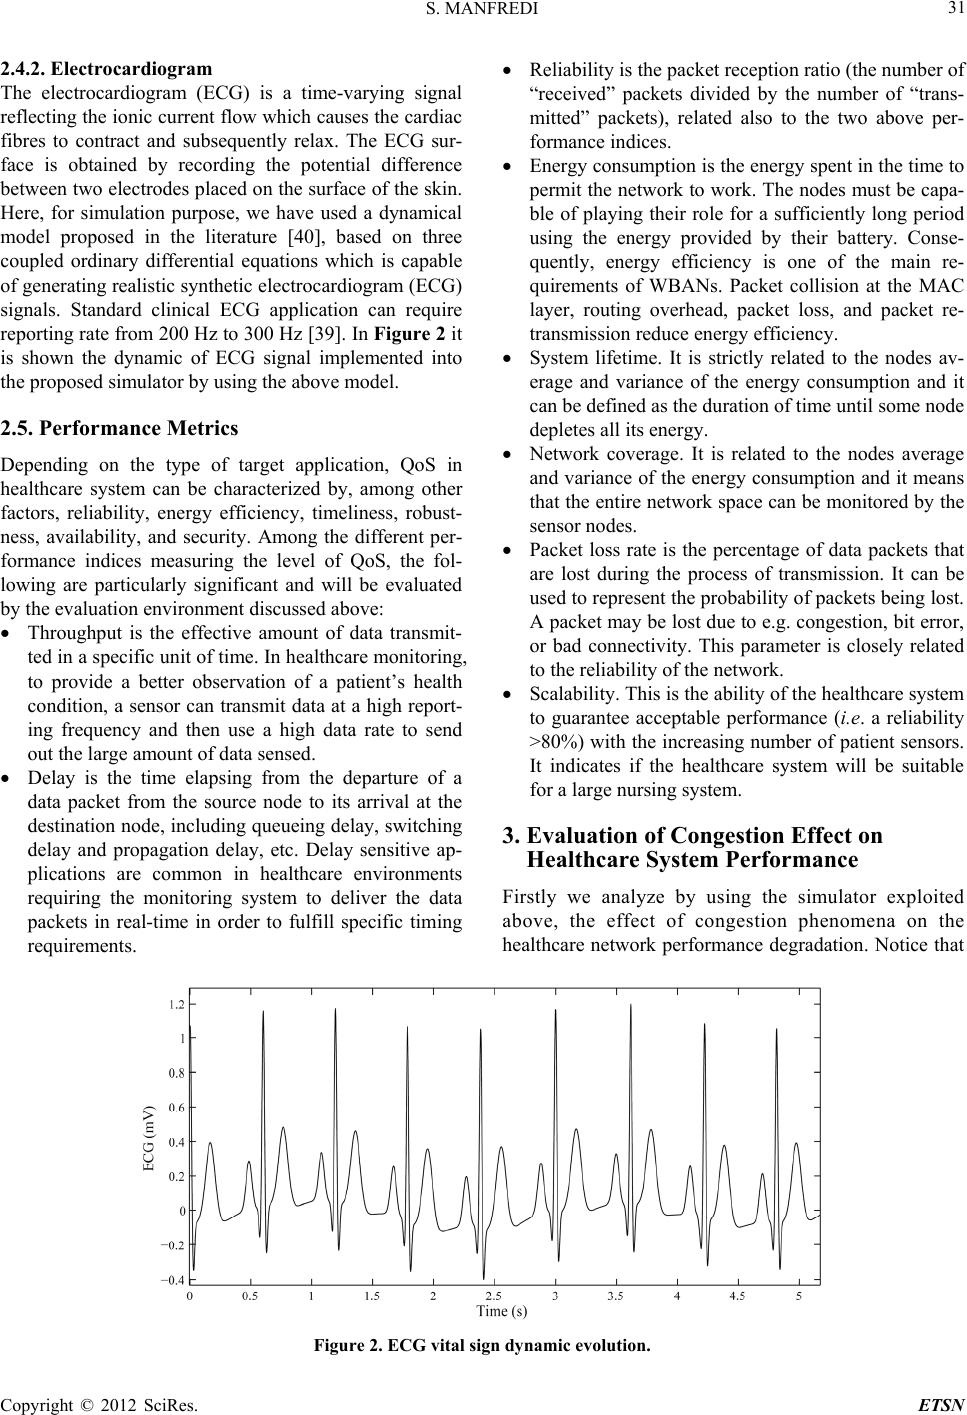 S. MANFREDI 31 2.4.2. Electrocardiogram The electrocardiogram (ECG) is a time-varying signal reflecting the ionic current flow which causes the cardiac fibres to contract and subsequently relax. The ECG sur- face is obtained by recording the potential difference between two electrodes placed on the surface of the skin. Here, for simulation purpose, we have used a dynamical model proposed in the literature [40], based on three coupled ordinary differential equations which is capable of generating realistic synthetic electrocardiogram (ECG) signals. Standard clinical ECG application can require reporting rate from 200 Hz to 300 Hz [39]. In Figure 2 it is shown the dynamic of ECG signal implemented into the proposed simulator by using the above model. 2.5. Performance Metrics Depending on the type of target application, QoS in healthcare system can be characterized by, among other factors, reliability, energy efficiency, timeliness, robust- ness, availability, and security. Among the different per- formance indices measuring the level of QoS, the fol- lowing are particularly significant and will be evaluated by the evaluation environment discussed above: Throughput is the effective amount of data transmit- ted in a specific unit of time. In healthcare monitoring, to provide a better observation of a patient’s health condition, a sensor can transmit data at a high report- ing frequency and then use a high data rate to send out the large amount of data sensed. Delay is the time elapsing from the departure of a data packet from the source node to its arrival at the destination node, including queueing delay, switching delay and propagation delay, etc. Delay sensitive ap- plications are common in healthcare environments requiring the monitoring system to deliver the data packets in real-time in order to fulfill specific timing requirements. Reliability is the packet reception ratio (the number of “received” packets divided by the number of “trans- mitted” packets), related also to the two above per- formance indices. Energy consumption is the energy spent in the time to permit the network to work. The nodes must be capa- ble of playing their role for a sufficiently long period using the energy provided by their battery. Conse- quently, energy efficiency is one of the main re- quirements of WBANs. Packet collision at the MAC layer, routing overhead, packet loss, and packet re- transmission reduce energy efficiency. System lifetime. It is strictly related to the nodes av- erage and variance of the energy consumption and it can be defined as the duration of time until some node depletes all its energy. Network coverage. It is related to the nodes average and variance of the energy consumption and it means that the entire network space can be monitored by the sensor nodes. Packet loss rate is the percentage of data packets that are lost during the process of transmission. It can be used to represent the probability of packets being lost. A packet may be lost due to e.g. congestion, bit error, or bad connectivity. This parameter is closely related to the reliability of the network. Scalability. This is the ability of the healthcare system to guarantee acceptable performance (i.e. a reliability >80%) with the increasing number of patient sensors. It indicates if the healthcare system will be suitable for a large nursing system. 3. Evaluation of Congestion Effect on Healthcare System Performance Firstly we analyze by using the simulator exploited above, the effect of congestion phenomena on the healthcare network performance degradation. Notice that Figure 2. ECG vital sign dynamic evolution. Copyright © 2012 SciRes. ETSN 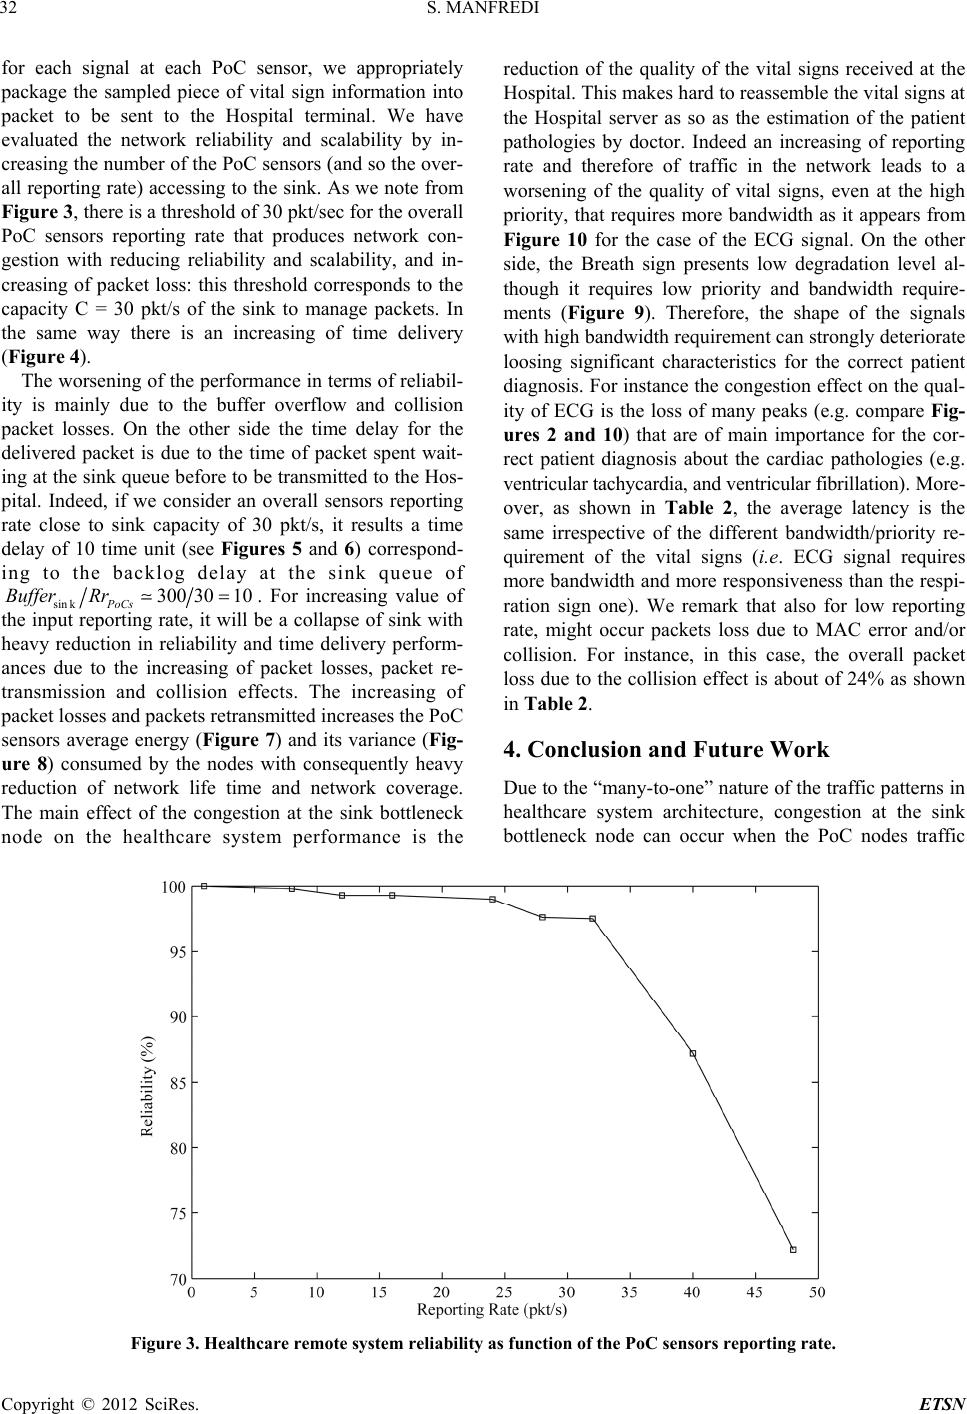 S. MANFREDI 32 for each signal at each PoC sensor, we appropriately package the sampled piece of vital sign information into packet to be sent to the Hospital terminal. We have evaluated the network reliability and scalability by in- creasing the number of the PoC sensors (and so the over- all reporting rate) accessing to the sink. As we note from Figure 3, there is a threshold of 30 pkt/sec for the overall PoC sensors reporting rate that produces network con- gestion with reducing reliability and scalability, and in- creasing of packet loss: this threshold corresponds to the capacity C = 30 pkt/s of the sink to manage packets. In the same way there is an increasing of time delivery (Figure 4). The worsening of the performance in terms of reliabil- ity is mainly due to the buffer overflow and collision packet losses. On the other side the time delay for the delivered packet is due to the time of packet spent wait- ing at the sink queue before to be transmitted to the Hos- pital. Indeed, if we consider an overall sensors reporting rate close to sink capacity of 30 pkt/s, it results a time delay of 10 time unit (see Figures 5 and 6) correspond- ing to the backlog delay at the sink queue of sin k300 3010 PoCs Buffer Rr. For increasing value of the input reporting rate, it will be a collapse of sink with heavy reduction in reliability and time delivery perform- ances due to the increasing of packet losses, packet re- transmission and collision effects. The increasing of packet losses and packets retransmitted increases the PoC sensors average energy (Figure 7) and its variance (Fig- ure 8) consumed by the nodes with consequently heavy reduction of network life time and network coverage. The main effect of the congestion at the sink bottleneck node on the healthcare system performance is the reduction of the quality of the vital signs received at the Hospital. This makes hard to reassemble the vital signs at the Hospital server as so as the estimation of the patient pathologies by doctor. Indeed an increasing of reporting rate and therefore of traffic in the network leads to a worsening of the quality of vital signs, even at the high priority, that requires more bandwidth as it appears from Figure 10 for the case of the ECG signal. On the other side, the Breath sign presents low degradation level al- though it requires low priority and bandwidth require- ments (Figure 9). Therefore, the shape of the signals with high bandwidth requirement can strongly deteriorate loosing significant characteristics for the correct patient diagnosis. For instance the congestion effect on the qual- ity of ECG is the loss of many peaks (e.g. compare Fig- ures 2 and 10) that are of main importance for the cor- rect patient diagnosis about the cardiac pathologies (e.g. ventricular tachycardia, and ventricular fibrillation). More- over, as shown in Table 2, the average latency is the same irrespective of the different bandwidth/priority re- quirement of the vital signs (i.e. ECG signal requires more bandwidth and more responsiveness than the respi- ration sign one). We remark that also for low reporting rate, might occur packets loss due to MAC error and/or collision. For instance, in this case, the overall packet loss due to the collision effect is about of 24% as shown in Table 2. 4. Conclusion and Future Work Due to the “many-to-one” nature of the traffic patterns in healthcare system architecture, congestion at the sink ottleneck node can occur when the PoC nodes traffic b Figure 3. Healthcare remote system reliability as function of the PoC sensors reporting rate. Copyright © 2012 SciRes. ETSN 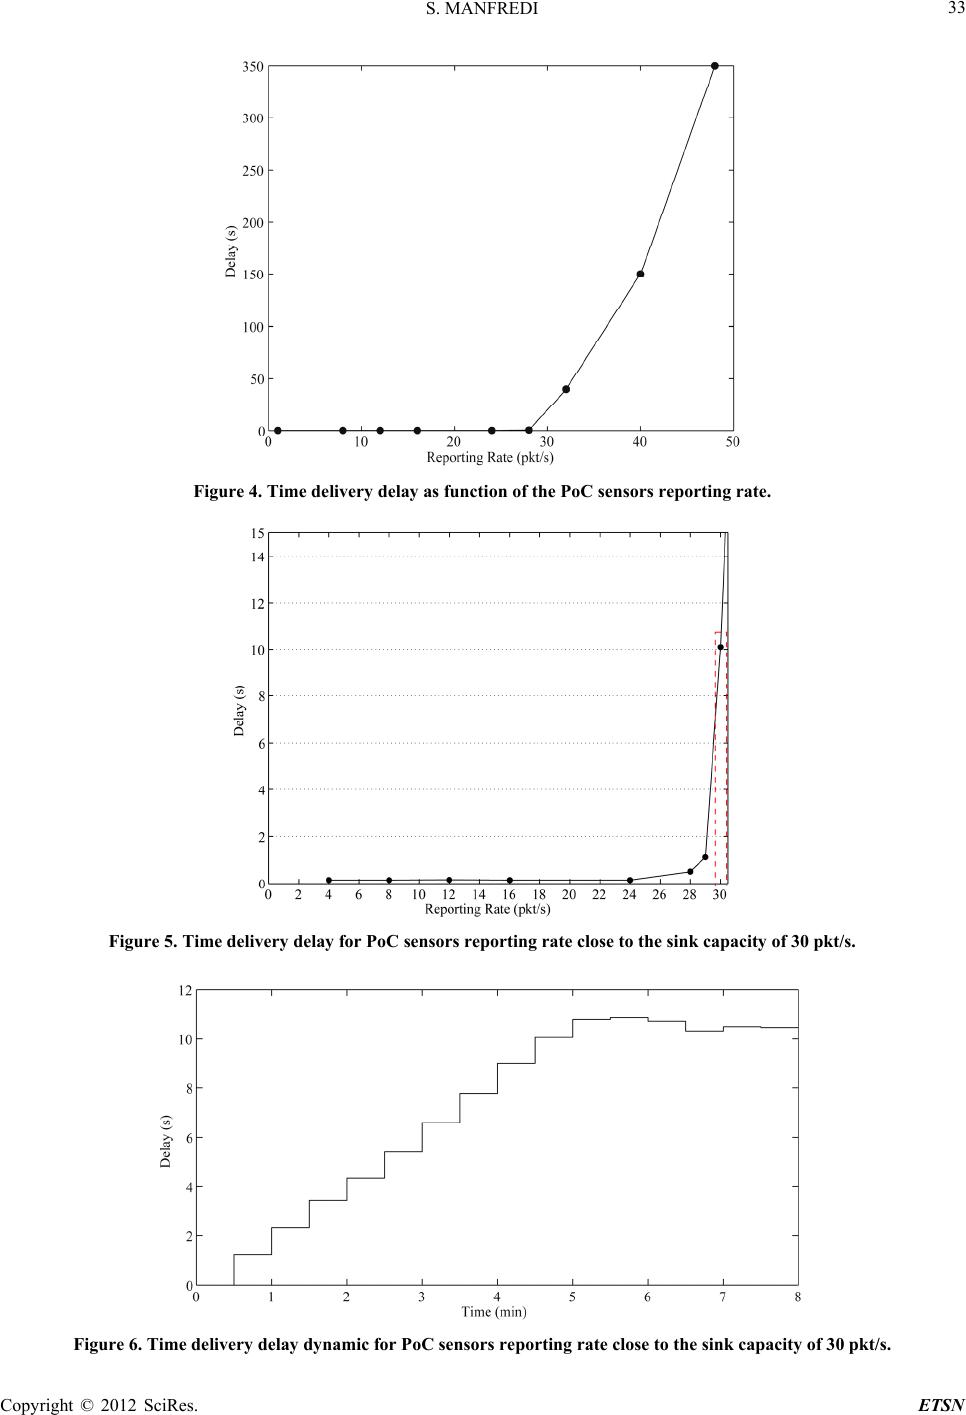 S. MANFREDI 33 Figure 4. Time delivery delay as functi on of the PoC sensors reporting rate. Figure 5. Time delivery delay for PoC sensors reporting rate close to the sink capacity of 30 pkt/s. Figure 6. Time delivery delay dynamic for P o C sensors reporting rate close to the sink capacity of 30 pkt/s. Copyright © 2012 SciRes. ETSN 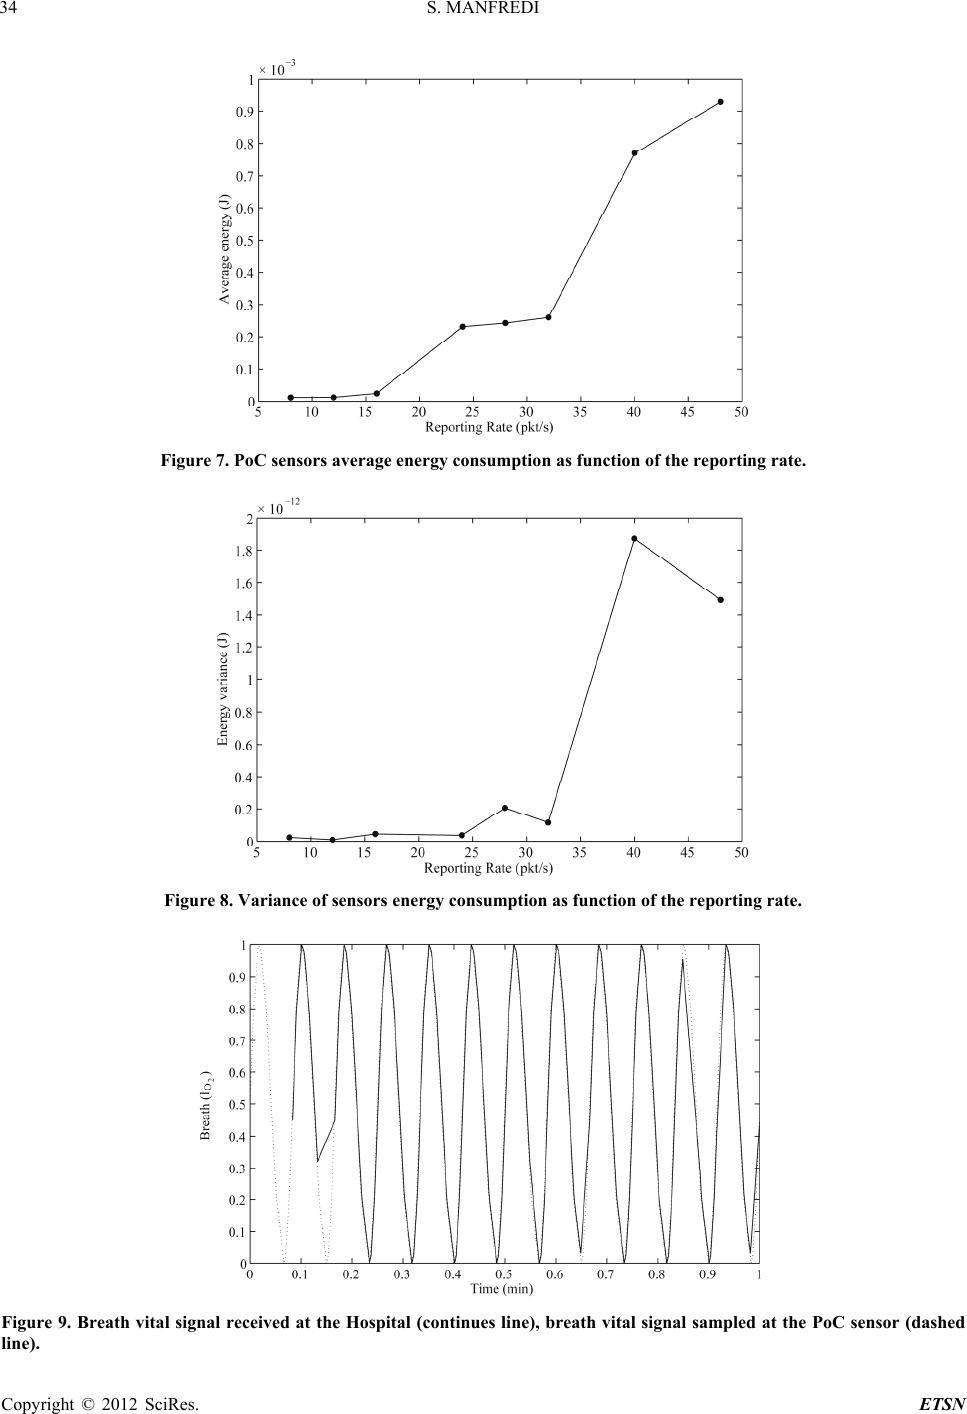 S. MANFREDI 34 Figure 7. PoC sensors average energy consumption as function of the reporting rate. Figure 8. Variance of sensors energy consumption as function of the reporting rate. Figure 9. Breath vital signal received at the Hospital (continues line), breath vital signal sampled at the PoC sensor (dashed line). Copyright © 2012 SciRes. ETSN 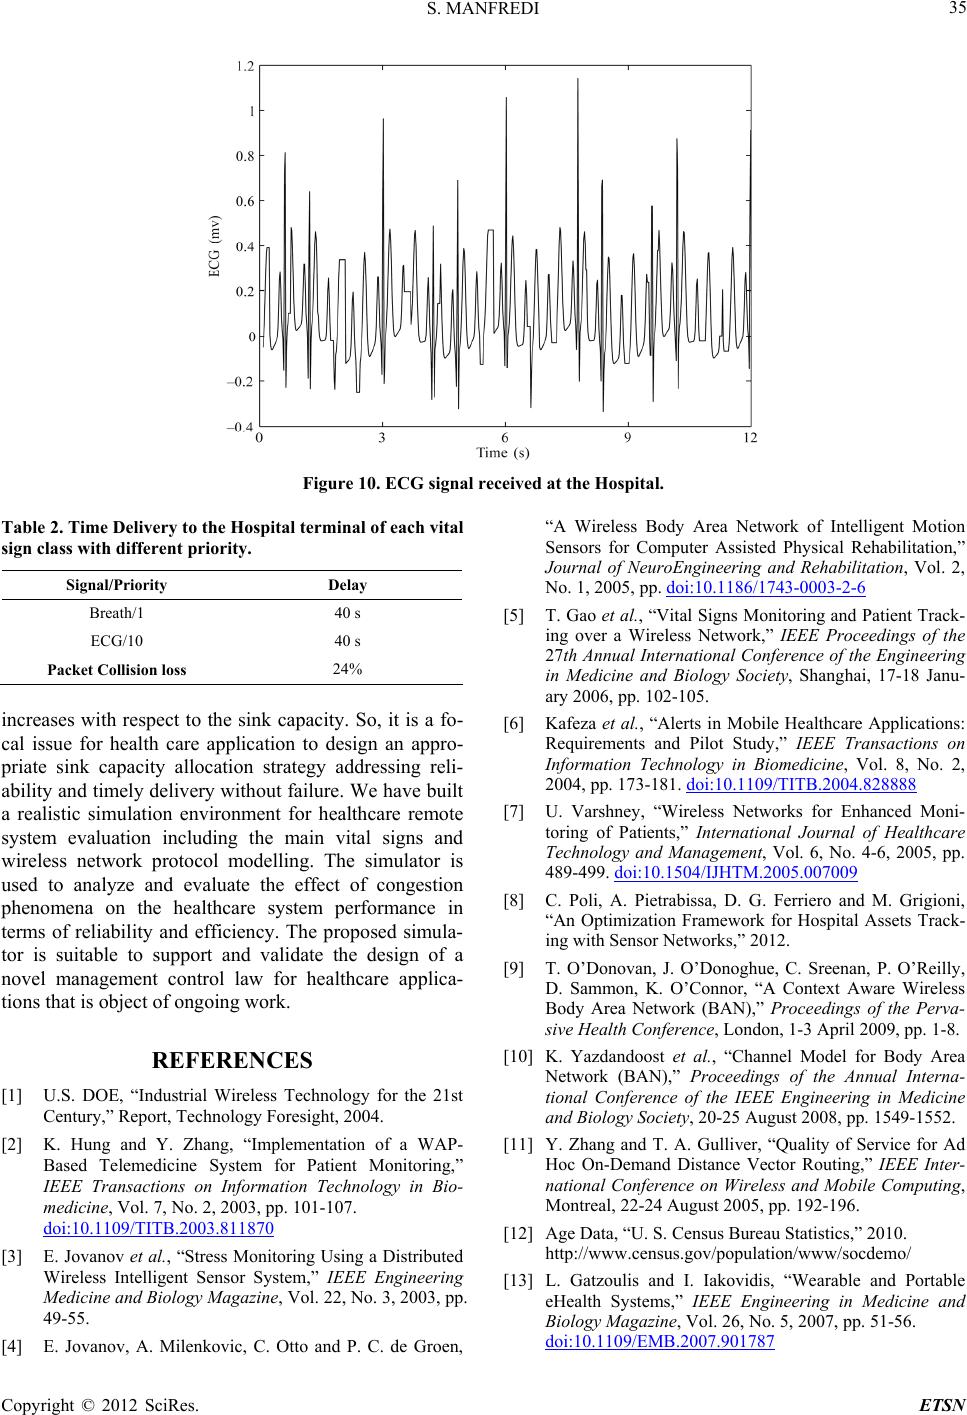 S. MANFREDI Copyright © 2012 SciRes. ETSN 35 Figure 10. ECG signal received at the Hospital. Table 2. Time Delivery to the Hospital terminal of each vital sign class with different pr iority. Signal/Priority Delay Breath/1 40 s ECG/10 40 s Packet Collision loss 24% increases with respect to the sink capacity. So, it is a fo- cal issue for health care application to design an appro- priate sink capacity allocation strategy addressing reli- ability and timely delivery without failure. We have built a realistic simulation environment for healthcare remote system evaluation including the main vital signs and wireless network protocol modelling. The simulator is used to analyze and evaluate the effect of congestion phenomena on the healthcare system performance in terms of reliability and efficiency. The proposed simula- tor is suitable to support and validate the design of a novel management control law for healthcare applica- tions that is object of ongoing work. REFERENCES [1] U.S. DOE, “Industrial Wireless Technology for the 21st Century,” Report, Technology Foresight, 2004. [2] K. Hung and Y. Zhang, “Implementation of a WAP- Based Telemedicine System for Patient Monitoring,” IEEE Transactions on Information Technology in Bio- medicine, Vol. 7, No. 2, 2003, pp. 101-107. doi:10.1109/TITB.2003.811870 [3] E. Jovanov et al., “Stress Monitoring Using a Distributed Wireless Intelligent Sensor System,” IEEE Engineering Medicine and Biology Magazine, Vol. 22, No. 3, 2003, pp. 49-55. [4] E. Jovanov, A. Milenkovic, C. Otto and P. C. de Groen, “A Wireless Body Area Network of Intelligent Motion Sensors for Computer Assisted Physical Rehabilitation,” Journal of NeuroEngineering and Rehabilitation, Vol. 2, No. 1, 2005, pp. doi:10.1186/1743-0003-2-6 [5] T. Gao et al., “Vital Signs Monitoring and Patient Track- ing over a Wireless Network,” IEEE Proceedings of the 27th Annual International Conference of the Engineering in Medicine and Biology Society, Shanghai, 17-18 Janu- ary 2006, pp. 102-105. [6] Kafeza et al., “Alerts in Mobile Healthcare Applications: Requirements and Pilot Study,” IEEE Transactions on Information Technology in Biomedicine, Vol. 8, No. 2, 2004, pp. 173-181. doi:10.1109/TITB.2004.828888 [7] U. Varshney, “Wireless Networks for Enhanced Moni- toring of Patients,” International Journal of Healthcare Technology and Management, Vol. 6, No. 4-6, 2005, pp. 489-499. doi:10.1504/IJHTM.2005.007009 [8] C. Poli, A. Pietrabissa, D. G. Ferriero and M. Grigioni, “An Optimization Framework for Hospital Assets Track- ing with Sensor Networks,” 2012. [9] T. O’Donovan, J. O’Donoghue, C. Sreenan, P. O’Reilly, D. Sammon, K. O’Connor, “A Context Aware Wireless Body Area Network (BAN),” Proceedings of the Perva- sive Health Conference, London, 1-3 April 2009, pp. 1-8. [10] K. Yazdandoost et al., “Channel Model for Body Area Network (BAN),” Proceedings of the Annual Interna- tional Conference of the IEEE Engineering in Medicine and Biology Society, 20-25 August 2008, pp. 1549-1552. [11] Y. Zhang and T. A. Gulliver, “Quality of Service for Ad Hoc On-Demand Distance Vector Routing,” IEEE Inter- national Conference on Wireless and Mobile Computing, Montreal, 22-24 August 2005, pp. 192-196. [12] Age Data, “U. S. Census Bureau Statistics,” 2010. http://www.census.gov/population/www/socdemo/ [13] L. Gatzoulis and I. Iakovidis, “Wearable and Portable eHealth Systems,” IEEE Engineering in Medicine and Biology Magazine, Vol. 26, No. 5, 2007, pp. 51-56. doi:10.1109/EMB.2007.901787  S. MANFREDI 36 [14] C. P. Price, A. St John and J. M. Hicks, “Point-of-Care Testing,” 2nd Edition, AACC Press, Washington DC, 2004. [15] A. J. Tudos, G. A. J. Besselink and R. B. M. Schasfoort, “Trends in Miniaturized Total Analysis Systems for Point-of-Care Testing in Clinical Chemistry,” Lab on a Chip, Vol. 1, No. 2, 2001, pp 83-95. doi:10.1039/b106958f [16] S. Rhee, B.-H. Yang and H. H. Asada, “Artifact-Resistant Power-Efficient Design of Finger-Ring Plethysmographic Sensors,” IEEE Transactions on Biomedical Engineering, Vol. 48, No. 5, 2001, pp. 795-805. doi:10.1109/10.930904 [17] S. Guillen, M. T. Arredondo, V. Traver, J. M. Garcia and C. Fernandez, “Multimedia Telehomecare System Using Standard TV Set,” IEEE Transactions on Biomedical En- gineering, Vol. 9, No. 12, 2002, pp. 1431-1437. doi:10.1109/TBME.2002.805457 [18] C. Lau, R. S. Churchill, J. Kim, F. A. I. Matsen and Y. Kim, “Asynchronous Web-Based Patient-Centered Home Telemedicine System,” IEEE Transactions on Biomedical Engineering, Vol. 49, No. 12, 2002, pp. 1452-1462. doi:10.1109/TBME.2002.805456 [19] “Zigbee Alliance,” 2009. www.zigbee.org [20] “Bluetooth,” 2009. www.bluetooth.com [21] IEEE 802.15, “WPAN Task Group 6,” 2009. http://www.ieee802.org/15/pub/TG6.html [22] A. Woo and D. C. Culler, “A Transmission Control Scheme for Media Access in Sensor Network,” Proceed- ings of the 7th Annual International Conference on Mo- bile Computing and Networking, New York, 16-21 July 2004, pp. 221-235. [23] C.-Y. Wan, S. B. Eisenman and A. T. Campbell, “CODA: Congestion Detection and Avoidance in Sensor Net- works,” Proceedings of the 1st International Conference on Embedded Networked Sensor Systems, 15 October 2003, pp. 266-279. [24] S. M. ElRakabawy and C. Lindemann, “A Practical Adaptive Pacing Scheme for TCP in Multihop Wireless Networks,” IEEE/ACM Transactions on Networking, August 2011, pp. 975-988. doi:10.1109/TNET.2010.2095038 [25] J. Zhao, L. Wang, S. Li, X. Liu, Z. Yuan and Z. Gao, “A Survey of Congestion Control Mechanisms in Wireless Sensor Networks,” Sixth International Conference on In- telligent Information Hiding and Multimedia Signal Processing, Darmstadt, 15-17 October 2010, pp. 719-722. doi:10.1109/IIHMSP.2010.182 [26] C. T. Ee and R. Bajcsy, “Congestion Control and Fairness for Many-to-One Routing in Sensor Networks,” Pro- ceedings of the 2nd International Conference on Embed- ded Networked Sensor Systems, New York, pp. 148-161. [27] B. Hull, K. Jamieson and H. Balakrishnan, “Mitigating Congestion in Wireless Sensor Networks,” Proceedings of the 2nd International Conference on Embedded Net- worked Sensor Systems, New York, 3-5 November 2004, pp. 134-147. [28] P. Levis, N. Patel, D. Culler and S. Shanker, “Trickle: A Self Regulating Algorithm for Code Propagation and Maintenance in Wireless Sensor Networks,” Proceedings of the 1st Symposium Networked Systems Design Imple- mentation, San Francisco, 29-31 March 2004, pp. 15-28. [29] S. H. Low and D. E. Lapsley, “Optimization Flow Con- trol I. Basic Algorithm and Convergence,” IEEE/ACM Transactions on Networking, Vol. 7, No. 6, 1999, pp. 861-874. doi:10.1109/90.811451 [30] F. P. Kelly, A. K. Maulloo and D. K. H. Tan, “Rate Con- trol in Communication Networks: Shadow Prices, Pro- portional Fairness, and Stability,” Journal of the Opera- tional Research Society, Vol. 49, No. 3, 1998, pp. 237- 252. [31] S. Low, F. Paganini and J. C. Doyle, “Internet Congestion Control,” IEEE Control Systems Magazine, Vol. 22, No. 1, 2002, pp. 28-43. [32] J. Mo and J. Walrand, “Fair End-to-End Window-Based Congestion Control,” IEEE/ACM Transaction on Net- working, Vol. 8, No. 5, 2000, pp. 556-567. doi:10.1109/90.879343 [33] S. Manfredi, “Reliable and Energy-Efficient Cooperative Routing Algorithm for Wireless Monitoring Systems,” IET Wireless Sensor Systems, Vol. 2, No. 2, 2012, pp. 128-135. doi:10.1049/iet-wss.2011.0103 [34] S. Manfredi, “A Cooperative Routing Algorithm to In- crease QoS in Wireless E-Healthcare Systems,” E-Health Care Systems and Wireless Communications: Current and Future Challenges, IGI Global, 2012. [35] I. F. Akyildiz, W. Su, Y. Sankarasubramaniam and E. Cayirci, “Wireless Sensor Networks: A Survey,” Com- puter Networks, Vol. 38, No. 4, 2002, pp. 393-422. doi:10.1016/S1389-1286(01)00302-4 [36] F. H. Wilhelm, M. C. Pfaltz and P. Grossman, “Continu- ous Electronic Data Capture of Physiology, Behavior and Experience in Real Life: Towards Ecological Momentary Assessment of Emotion,” Interacting Computers, Vol. 18, No. 2, 2006, pp. 171-186. doi:10.1016/j.intcom.2005.07.001 [37] A. Matsubara and S. Tanaka, “Unconstrained and Nonin- vasive Measurement of Heartbeat and Respiration for Drivers Using a Strain Gauge,” Proceedings of the 41st SICE Annual Conference, 5-7 August 2002, pp. 1067- 1068. doi:10.1109/SICE.2002.1195323 [38] C. T. Huang, C. L. Shen, C. F. Tang and S. H. Chang, “A Wearable Yarn-Based Piezo-Resistive Sensor,” Sensors and Actuators A: Physical, Vol. 141, No. 2, 2008, pp. 396-403. doi:10.1016/j.sna.2007.10.069 [39] M. Patel and J. Wang, “Applications, Challenges, and Prospective in Emerging Body Area Networking Tech- nologies,” IEEE Wireless Communications, Vol. 17, No. 1, 2010, pp 80-88. doi:10.1109/MWC.2010.5416354 [40] P. E. McSharry, G. D. Clifford, L. Tarassenko and L. Smith, “A Dynamical Model for Generating Synthetic Electrocardiogram Signals,” IEEE Transactions on Bio- medical Engineering, Vol. 50, No. 3, 2003, pp. 289-294. doi:10.1109/TBME.2003.808805 [41] M. Ohlin, D. Henriksson and A. Cervin, “TrueTime 1.5— Reference Manual,” Department of Automatic Control, Lund University, 2007. Copyright © 2012 SciRes. ETSN |