

Paper Menu >>
Journal Menu >>
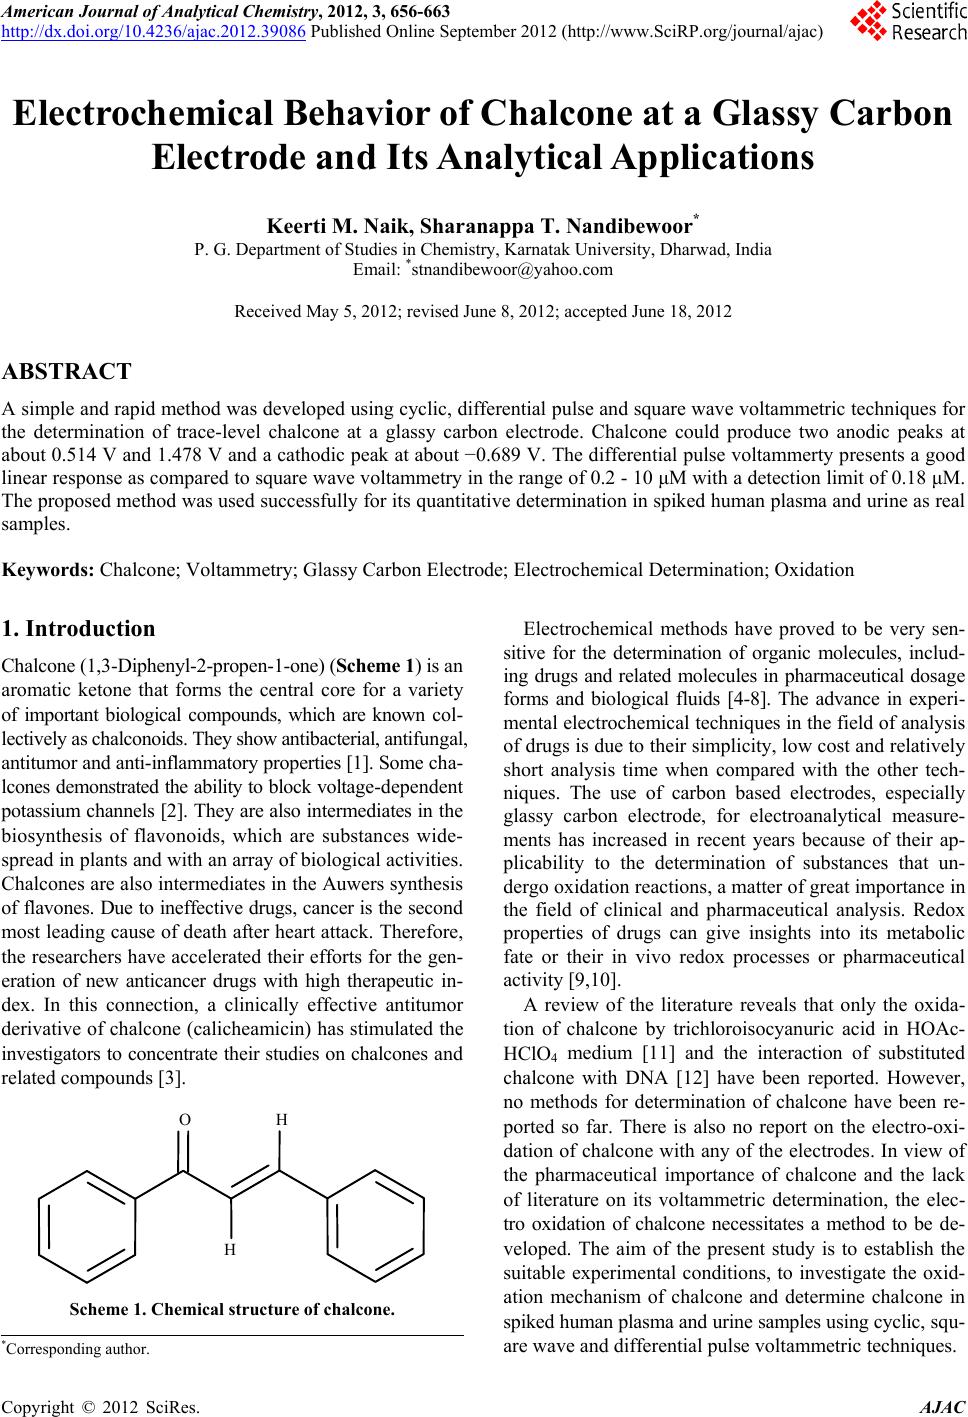 American Journal of Analytical Chemistry, 2012, 3, 656-663 http://dx.doi.org/10.4236/ajac.2012.39086 Published Online September 2012 (http://www.SciRP.org/journal/ajac) Electrochemical Behavior of Chalcone at a Glassy Carbon Electrode and Its Analytical Applications Keerti M. Naik, Sharanappa T. Nandibewoor* P. G. Department of Studies in Chemistry, Karnatak University, Dharwad, India Email: *[email protected] Received May 5, 2012; revised June 8, 2012; accepted June 18, 2012 ABSTRACT A simple and rapid method was developed using cyclic, differential pulse and square wave voltammetric techniques for the determination of trace-level chalcone at a glassy carbon electrode. Chalcone could produce two anodic peaks at about 0.514 V and 1.478 V and a cathodic peak at about −0.689 V. The differential pulse voltammerty presents a good linear response as compared to square wave voltammetry in the range of 0.2 - 10 μM with a detection limit of 0.18 μM. The proposed method was used successfully for its quantitative determination in spiked human plasma and urine as real samples. Keywords: Chalcone; Voltammetry; Glassy Carbon Electrode; Electrochemical Determination; Oxidation 1. Introduction Chalcone (1,3-Diphenyl-2-propen-1-one) (Scheme 1) is an aromatic ketone that forms the central core for a variety of important biological compounds, which are known col- lectively as chalconoids. They show antibacterial, antifungal, antitumor and anti-inflammatory properties [1]. Some cha- lcones demonstrated the ability to block voltage-dependent potassium channels [2]. They are also intermediates in the biosynthesis of flavonoids, which are substances wide- spread in plants and with an array of biological activities. Chalcones are also intermediates in the Auwers synthesis of flavones. Due to ineffective drugs, cancer is the second most leading cause of death after heart attack. Therefore, the researchers have accelerated their efforts for the gen- eration of new anticancer drugs with high therapeutic in- dex. In this connection, a clinically effective antitumor derivative of chalcone (calicheamicin) has stimulated the investigators to concentrate their studies on chalcones and related compounds [3]. O H H Scheme 1. Chemical structure of chalcone. Electrochemical methods have proved to be very sen- sitive for the determination of organic molecules, includ- ing drugs and related molecules in pharmaceutical dosage forms and biological fluids [4-8]. The advance in experi- mental electrochemical techniques in the field of analysis of drugs is due to their simplicity, low cost and relatively short analysis time when compared with the other tech- niques. The use of carbon based electrodes, especially glassy carbon electrode, for electroanalytical measure- ments has increased in recent years because of their ap- plicability to the determination of substances that un- dergo oxidation reactions, a matter of great importance in the field of clinical and pharmaceutical analysis. Redox properties of drugs can give insights into its metabolic fate or their in vivo redox processes or pharmaceutical activity [9,10]. A review of the literature reveals that only the oxida- tion of chalcone by trichloroisocyanuric acid in HOAc- HClO4 medium [11] and the interaction of substituted chalcone with DNA [12] have been reported. However, no methods for determination of chalcone have been re- ported so far. There is also no report on the electro-oxi- dation of chalcone with any of the electrodes. In view of the pharmaceutical importance of chalcone and the lack of literature on its voltammetric determination, the elec- tro oxidation of chalcone necessitates a method to be de- veloped. The aim of the present study is to establish the suitable experimental conditions, to investigate the oxid- ation mechanism of chalcone and determine chalcone in spiked human plasma and urine samples using cyclic, squ- are wave and differential pulse voltammetric techniques. *Corresponding author. C opyright © 2012 SciRes. AJAC 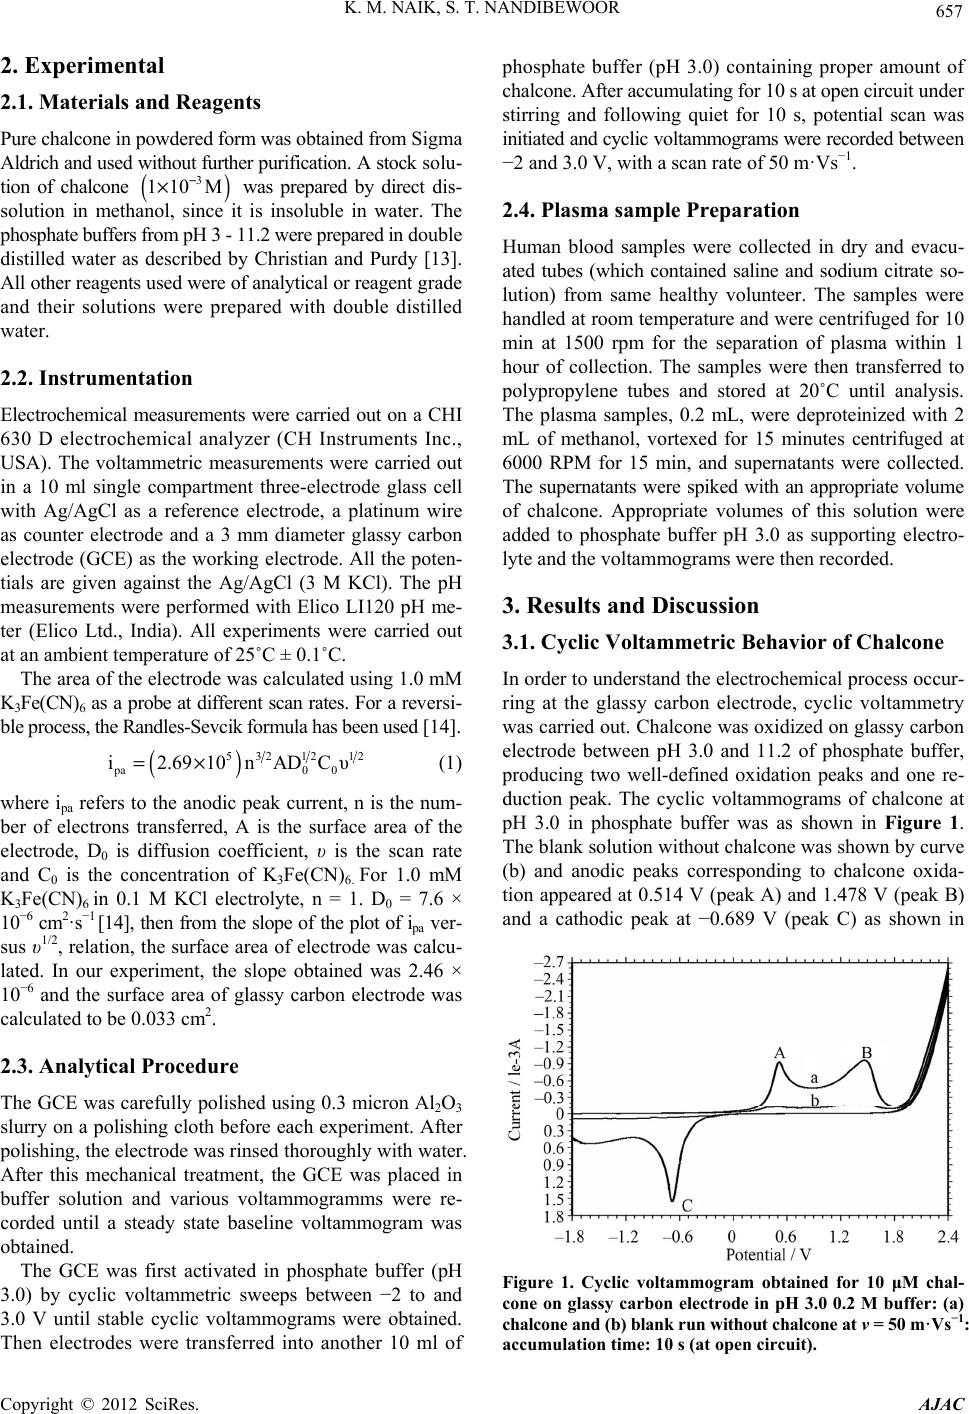 K. M. NAIK, S. T. NANDIBEWOOR 657 2. Experimental 2.1. Materials and Reagents Pure chalcone in powdered form was obtained from Sigma Aldrich and used without further purification. A stock solu- tion of chalcone was prepared by direct dis- solution in methanol, since it is insoluble in water. The phosphate buffers from pH 3 - 11.2 were prepared in double distilled water as described by Christian and Purdy [13]. All other reagents used were of analytical or reagent grade and their solutions were prepared with double distilled water. () 3 110 M − × 2.2. Instrumentation Electrochemical measurements were carried out on a CHI 630 D electrochemical analyzer (CH Instruments Inc., USA). The voltammetric measurements were carried out in a 10 ml single compartment three-electrode glass cell with Ag/AgCl as a reference electrode, a platinum wire as counter electrode and a 3 mm diameter glassy carbon electrode (GCE) as the working electrode. All the poten- tials are given against the Ag/AgCl (3 M KCl). The pH measurements were performed with Elico LI120 pH me- ter (Elico Ltd., India). All experiments were carried out at an ambient temperature of 25˚C ± 0.1˚C. The area of the electrode was calculated using 1.0 mM K3Fe(CN)6 as a probe at different scan rates. For a reversi- ble process, the Randles-Sevcik formula has been used [14]. () 53 pa i2.6910=× 2 1212 0 0 nADCυ (1) where ipa refers to the anodic peak current, n is the num- ber of electrons transferred, A is the surface area of the electrode, D0 is diffusion coefficient, υ is the scan rate and C0 is the concentration of K3Fe(CN)6. For 1.0 mM K3Fe(CN)6 in 0.1 M KCl electrolyte, n = 1. D0 = 7.6 × 10⁻⁶ cm2·s−1 [14], then from the slope of the plot of ipa ver- sus υ1/2, relation, the surface area of electrode was calcu- lated. In our experiment, the slope obtained was 2.46 × 10⁻⁶ and the surface area of glassy carbon electrode was calculated to be 0.033 cm2. 2.3. Analytical Procedure The GCE was carefully polished using 0.3 micron Al2O3 slurry on a polishing cloth before each experiment. After polishing, the electrode was rinsed thoroughly with water. After this mechanical treatment, the GCE was placed in buffer solution and various voltammogramms were re- corded until a steady state baseline voltammogram was obtained. The GCE was first activated in phosphate buffer (pH 3.0) by cyclic voltammetric sweeps between −2 to and 3.0 V until stable cyclic voltammograms were obtained. Then electrodes were transferred into another 10 ml of phosphate buffer (pH 3.0) containing proper amount of chalcone. After accumulating for 10 s at open circuit under stirring and following quiet for 10 s, potential scan was initiated and cyclic voltammograms were recorded between −2 and 3.0 V, with a scan rate of 50 m·Vs−1. 2.4. Plasma sample Preparation Human blood samples were collected in dry and evacu- ated tubes (which contained saline and sodium citrate so- lution) from same healthy volunteer. The samples were handled at room temperature and were centrifuged for 10 min at 1500 rpm for the separation of plasma within 1 hour of collection. The samples were then transferred to polypropylene tubes and stored at 20˚C until analysis. The plasma samples, 0.2 mL, were deproteinized with 2 mL of methanol, vortexed for 15 minutes centrifuged at 6000 RPM for 15 min, and supernatants were collected. The supernatants were spiked with an appropriate volume of chalcone. Appropriate volumes of this solution were added to phosphate buffer pH 3.0 as supporting electro- lyte and the voltammograms were then recorded. 3. Results and Discussion 3.1. Cyclic Voltammetric Behavior of Chalcone In order to understand the electrochemical process occur- ring at the glassy carbon electrode, cyclic voltammetry was carried out. Chalcone was oxidized on glassy carbon electrode between pH 3.0 and 11.2 of phosphate buffer, producing two well-defined oxidation peaks and one re- duction peak. The cyclic voltammograms of chalcone at pH 3.0 in phosphate buffer was as shown in Figure 1. The blank solution without chalcone was shown by curve (b) and anodic peaks corresponding to chalcone oxida- tion appeared at 0.514 V (peak A) and 1.478 V (peak B) and a cathodic peak at −0.689 V (peak C) as shown in Figure 1. Cyclic voltammogram obtained for 10 μM chal- cone on glassy carbon electrode in pH 3.0 0.2 M buffer: (a) chalcone and (b) blank run without chalcone at ν = 50 m·Vs−1: accumulation time: 10 s (at open circuit). Copyright © 2012 SciRes. AJAC  K. M. NAIK, S. T. NANDIBEWOOR 658 curve (a). The peak current for the first wave was found to increase with increase in concentration of chalcone. The plot ip vs. concentration was linear in the range 0.2 to 10.0 μM and deviates from linearity above 10 μM. This is due to the adsorption of chalcone or chalcone oxidation product at higher concentration. It is shown that the reduction peak was observed in the reverse scan, suggesting that the electrochemical reaction was a quasi-reversible process [15]. Nevertheless, it was found that the oxidation peak current of chalcone showed a remarkable decrease during the successive cyclic volta- mmetric sweeps. After every sweep, the peak current dec- reased greatly and finally remained unchanged. This phe- nomenon may be attributed to the consumption of adsor- bed chalcone on the electrode surface or due to the fact that the adsorption of oxidative product occurs at the elec- trode surface. Therefore, the voltammograms correspond- ing to the first cycle and peak A were generally recorded, since peak A was more intense than B. 3.2. Influence of Accumulation Potential and Time It was important to fix the accumulation potential and time when adsorption studies were undertaken. Both conditions could affect the amount of adsorption of chalcone at the electrode. Bearing this in mind, the effect of accumula- tion potential and time on peak current response was stud- ied by CV. The concentration of chalcone used was 10 μM. When accumulation potential was varied from +0.4 to −0.4 V, the peak current changed a little. Hence, accu- mulation at open circuit was adopted. The peak current increased very rapidly with increasing accumulation time, which induced rapid adsorption of oxidative product on the surface of the GCE. The peak current reached the maximum at 10 s and their after being decreased which indicates the saturation accumulation. 3.3. Influence of pH The electrochemical oxidation of chalcone was studied with different supporting electrolytes such as Britton-Robinson buffer and phosphate buffer. Within the range of pH 3.0 - 11.2, the phosphate buffer gave the good results as com- pared to other supporting electrolytes. Hence phosphate buffers were taken as a supporting electrolyte. With in- creasing the pH of the buffer solution, the peak potential shifted to less positive values as shown in Figure 2. The plot of Ep versus pH (Figure 3(a)) shows that the peak potential is pH dependent. The variation of peak cur- rent with pH is as shown in Figure 3(b). The peak cur- rent decreased from pH 3 - 11.2. The voltammetric re- sponse was markedly dependent on pH. From the experi- mental results, (Figure 2) it is observed that highest peak current and better shape of the voltammogram was ob- served at pH 3.0, suggesting this pH is optimal pH value. From the plot of current versus pH (Figure 3(b)) it is evident that current goes on decreasing with increase in pH. Hence pH variation is restricted to 11.2. Figure 2. Influence of pH on the shape of the peaks in phos- phate buffer solution at (a) pH 3.0; (b) pH 4.2; (c) pH 5.0; (d) pH 6.0; (e) pH 7.0; (f) pH 8.0; (g) pH 9.2; (h) pH 10.4 and (i) pH 11.2. Other conditions are as in Figure 1. Ep ( V ) pH 0.0 0.2 0.4 0.6 0.8 1.0 1.2 1.4 1.6 1.8 2.0 024681012 A B (a) 0 5 10 15 051015 Current x 1 0-4 A pH (b) Figure 3. (a) Influence of pH on the peak potential of chal- cone for peaks A and B. Other conditions are as in Figure 1; (b) Variation of peak currents of peaks A and B with pH. Other conditions are as in Figure 1. Copyright © 2012 SciRes. AJAC  K. M. NAIK, S. T. NANDIBEWOOR 659 3.4. Influence of Scan Rate Useful information involving electrochemical mechanism usually can be acquired from the relationship between peak current and scan rate. Therefore, the electrochemical be- havior of chalcone at different scan rates from 50 to 300 m·Vs−1 (Figure 4) was also studied. From this we observed that increasing the scan rate, the peak potential of A is shifted to more positive values. Simultaneously, the width at half-height of peak A increases. It is suggested that this corresponds to the oxidation of chalcone dimers formed at the GCE surface. The formation of such kind of dimers is well documented in the literature [16,17], but they can only be observed when high scan rates are used probably because they have short life time. At the same time, the cathodic peak C is displaced to more negative values whereas its current increases with the scan rate. Nevertheless, the fact that peak current of C is always smaller than the peak current of A suggests that the oxidation product of chalcone is very unstable and undergoes hydrolysis in the solution [18]. There is a good linear relationship between peak cur- rent and scan rate. The equations are , () () 41 p I10 A4.6745Vs0.7531υ −− =−, r0.9821= , r0.9828= 1 3,r0.9917== 6,r0.9842== and () () 41 p I10 A5.7583Vs0.8515υ −− =− for peaks A and B, respectively as shown in Figure 5(a). In addition, there was a linear relation between log Ip and log υ, corresponding to the following equation: () () 4 p log I10A0.4881logVs+0.581υ −− and () () 41 p log I10A0.516logVs+0.670υ −− , for peaks A and B, respectively (Figure 5(b)). The slope of 0.4881 and 0.516 is close to the theoretically expected value of 0.5 for a diffusion controlled process [19]. Figure 4. Cyclic voltammograms of 10 μM chalcone on GCE with different scan rates, (a) - (f) were 50, 100, 150, 200, 250 and 300 m·Vs–1, respectively. Other conditions are as in Fig- ure 1. υ (V/s) Current × 10 – 4 A A B 0. 00 0. 50 1. 00 1. 50 2. 00 2. 50 3. 00 0.000.10 0.200.30 0.40 log υ (V/s) (a) -0. 2 -0. 1 0 0.1 0.2 0.3 0.4 0.5 -1.5 -1.3 -1.1-0.9 -0.7 -0.5 -0.3 -0.1 log Ip × 10 –4 A A B (b) 0.0 0.4 0.8 1.2 1.6 2.0 -1.6 -1.2-0.8 -0.40.0 lo g υ ( V/s ) Ep (V) A B () () 1 p EV0.5993logVs+1.2974 ν − = () () 1 pV0.2591 logVs+1.8196 ν − = () (c) Figure 5. (a) Dependence of the oxidation peak current of peaks A and B on the scan rate; (b) Dependence of the loga- rithm of peak current on logarithm of scan rate for peaks A and B; (c) Relationship between peak potential and loga- rithm of scan rate for the peaks A and B. The peak potential shifted to more positive values with increasing the scan rates. The linear relationship between peak potential and logarithm of scan rate can be expressed as and E, for the peaks A and B, respectively (Figure 5(c)). According to the quasi reversible electrode process, Ip is defined by the following equation [20]: () () 1212 12 5 p ao o I2.6910nn ADC αν =×××××× (2) where α (alpha) is the transfer coefficient, na the number Copyright © 2012 SciRes. AJAC 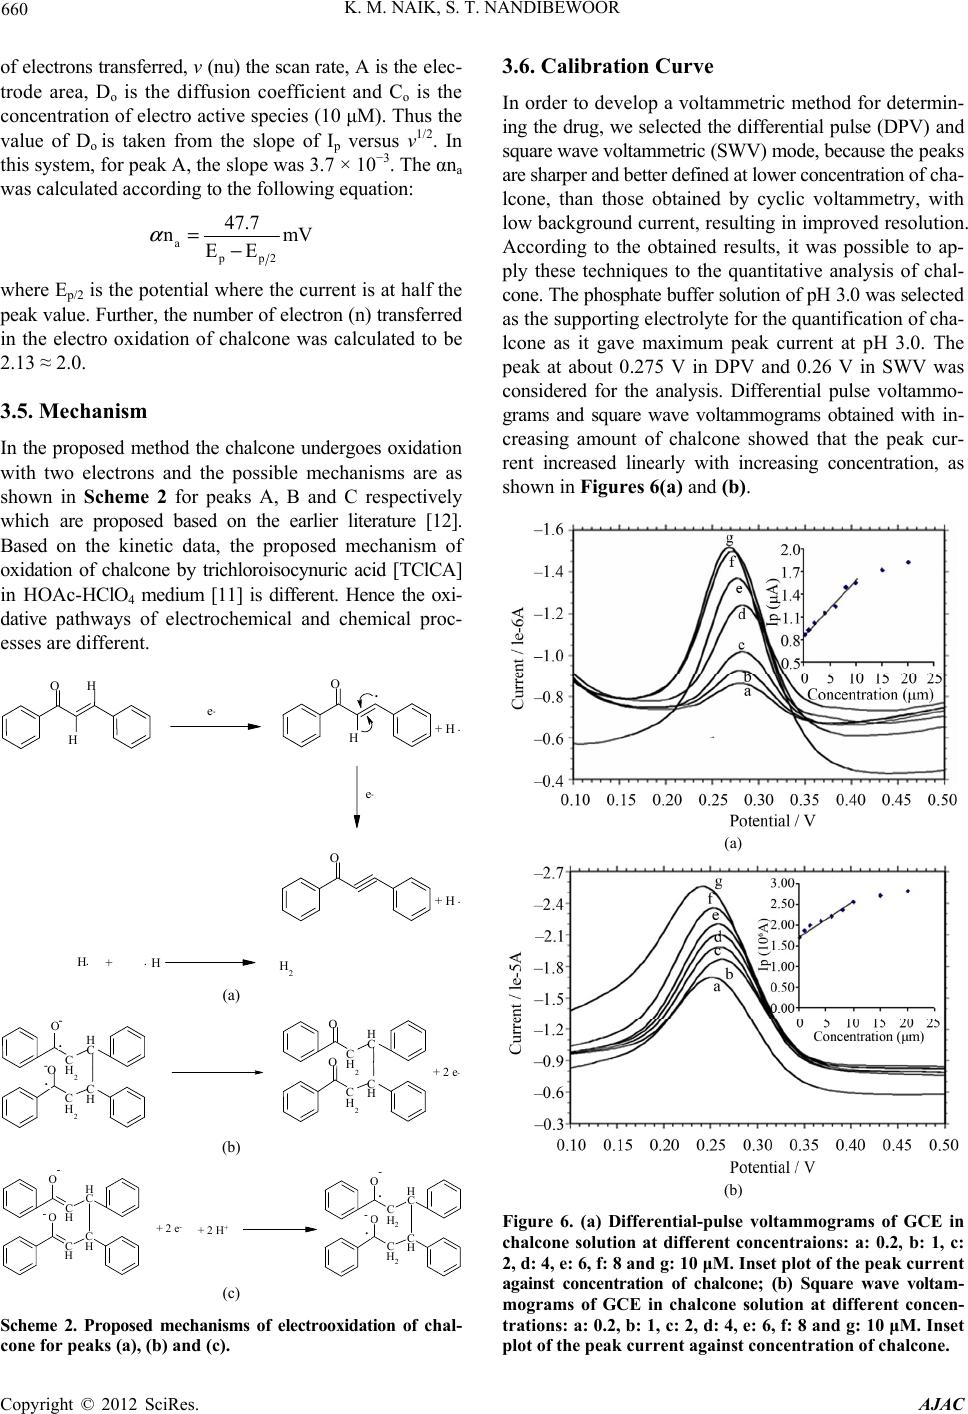 K. M. NAIK, S. T. NANDIBEWOOR 660 of electrons transferred, ν (nu) the scan rate, A is the elec- trode area, Do is the diffusion coefficient and Co is the concentration of electro active species (10 μM). Thus the value of Do is taken from the slope of Ip versus ν1/2. In this system, for peak A, the slope was 3.7 × 10⁻³. The αna was calculated according to the following equation: a α = pp 2 47.7 nmV EE− where Ep/2 is the potential where the current is at half the peak value. Further, the number of electron (n) transferred in the electro oxidation of chalcone was calculated to be 2.13 ≈ 2.0. 3.5. Mechanism In the proposed method the chalcone undergoes oxidation with two electrons and the possible mechanisms are as shown in Scheme 2 for peaks A, B and C respectively which are proposed based on the earlier literature [12]. Based on the kinetic data, the proposed mechanism of oxidation of chalcone by trichloroisocynuric acid [TClCA] in HOAc-HClO4 medium [11] is different. Hence the oxi- dative pathways of electrochemical and chemical proc- esses are different. O H O H H O e - e - . + H . + H . H . + H . H 2 (a) C H 2 C H C H 2 C H O C H 2 C H C H 2 C H O O - - . . + 2 e - O (b) C H C H C H C H O OO C H2 C H C H2 C H O - - + 2 e-+ 2 H+ - - . . (c) Scheme 2. Proposed mechanisms of electrooxidation of chal- cone for peaks (a), (b) and (c). 3.6. Calibration Curve In order to develop a voltammetric method for determin- ing the drug, we selected the differential pulse (DPV) and square wave voltammetric (SWV) mode, because the peaks are sharper and better defined at lower concentration of cha- lcone, than those obtained by cyclic voltammetry, with low background current, resulting in improved resolution. According to the obtained results, it was possible to ap- ply these techniques to the quantitative analysis of chal- cone. The phosphate buffer solution of pH 3.0 was selected as the supporting electrolyte for the quantification of cha- lcone as it gave maximum peak current at pH 3.0. The peak at about 0.275 V in DPV and 0.26 V in SWV was considered for the analysis. Differential pulse voltammo- grams and square wave voltammograms obtained with in- creasing amount of chalcone showed that the peak cur- rent increased linearly with increasing concentration, as shown in Figures 6(a) and (b) . (a) (b) Figure 6. (a) Differential-pulse voltammograms of GCE in chalcone solution at different concentraions: a: 0.2, b: 1, c: 2, d: 4, e: 6, f: 8 and g: 10 μM. Inset plot of the peak current against concentration of chalcone; (b) Square wave voltam- mograms of GCE in chalcone solution at different concen- trations: a: 0.2, b: 1, c: 2, d: 4, e: 6, f: 8 and g: 10 μM. Inset plot of the peak current against concentration of chalcone. Copyright © 2012 SciRes. AJAC 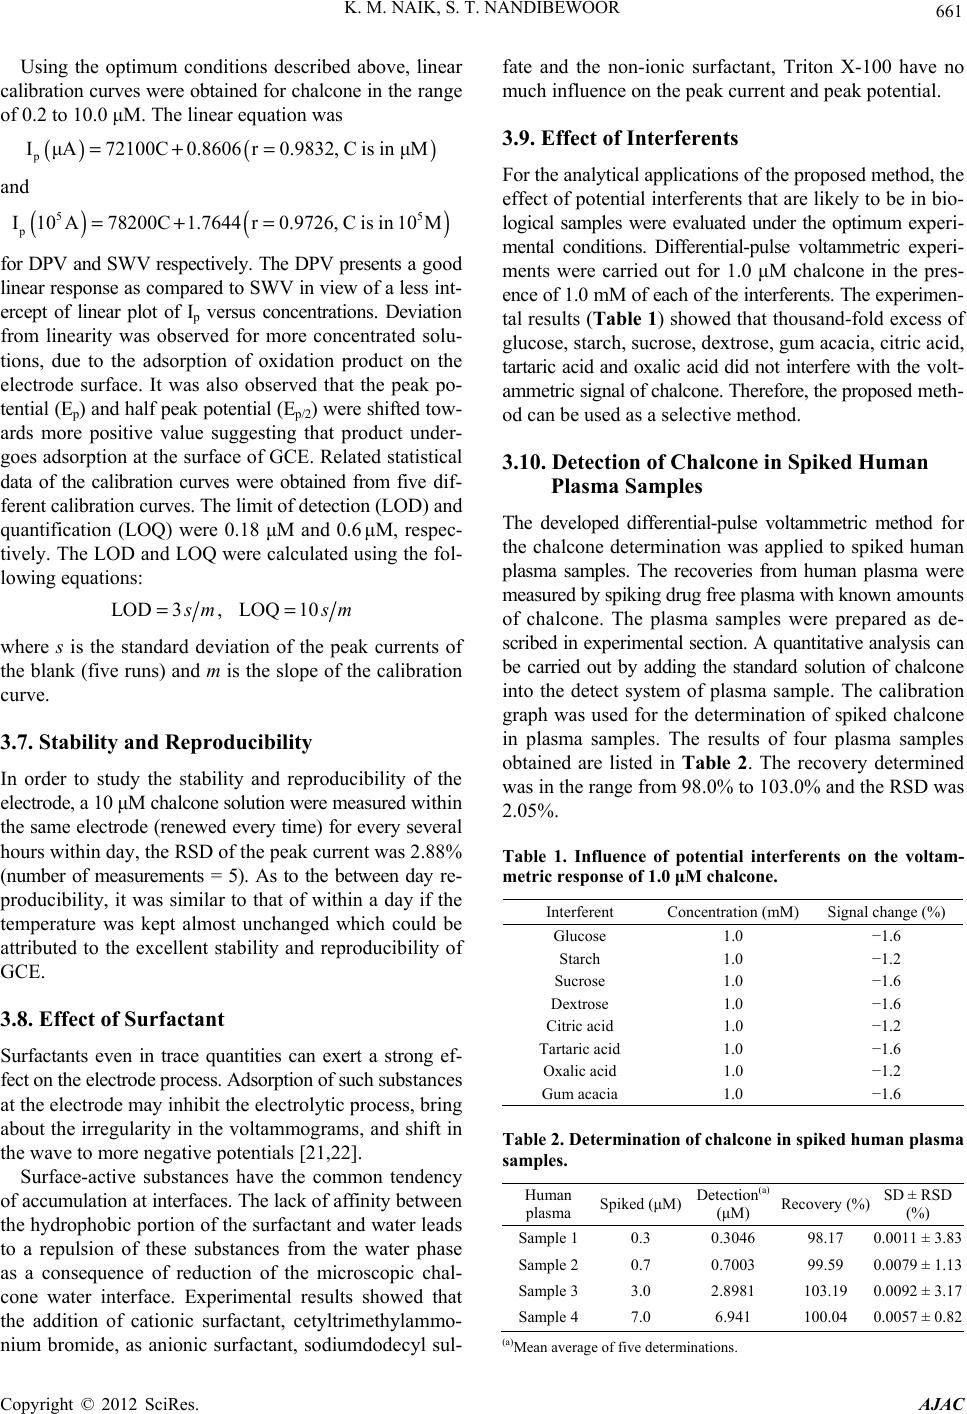 K. M. NAIK, S. T. NANDIBEWOOR 661 Using the optimum conditions described above, linear calibration curves were obtained for chalcone in the range of 0.2 to 10.0 μM. The linear equation was () ( p IμA72100C0.8606 r0.9832=+ = ) , C is inμM ) 5 Cisin 10M and () ( 5 p I10 A78200C1.7644r0.9726,=+ = for DPV and SWV respectively. The DPV presents a good linear response as compared to SWV in view of a less int- ercept of linear plot of Ip versus concentrations. Deviation from linearity was observed for more concentrated solu- tions, due to the adsorption of oxidation product on the electrode surface. It was also observed that the peak po- tential (Ep) and half peak potential (Ep/2) were shifted tow- ards more positive value suggesting that product under- goes adsorption at the surface of GCE. Related statistical data of the calibration curves were obtained from five dif- ferent calibration curves. The limit of detection (LOD) and quantification (LOQ) were 0.18 μM and 0.6 μM, respec- tively. The LOD and LOQ were calculated using the fol- lowing equations: LOD3, LOQ10 s msm== where s is the standard deviation of the peak currents of the blank (five runs) and m is the slope of the calibration curve. 3.7. Stability and Reproducibility In order to study the stability and reproducibility of the electrode, a 10 μM chalcone solution were measured within the same electrode (renewed every time) for every several hours within day, the RSD of the peak current was 2.88% (number of measurements = 5). As to the between day re- producibility, it was similar to that of within a day if the temperature was kept almost unchanged which could be attributed to the excellent stability and reproducibility of GCE. 3.8. Effect of Surfactant Surfactants even in trace quantities can exert a strong ef- fect on the electrode process. Adsorption of such substances at the electrode may inhibit the electrolytic process, bring about the irregularity in the voltammograms, and shift in the wave to more negative potentials [21,22]. Surface-active substances have the common tendency of accumulation at interfaces. The lack of affinity between the hydrophobic portion of the surfactant and water leads to a repulsion of these substances from the water phase as a consequence of reduction of the microscopic chal- cone water interface. Experimental results showed that the addition of cationic surfactant, cetyltrimethylammo- nium bromide, as anionic surfactant, sodiumdodecyl sul- fate and the non-ionic surfactant, Triton X-100 have no much influence on the peak current and peak potential. 3.9. Effect of Interferents For the analytical applications of the proposed method, the effect of potential interferents that are likely to be in bio- logical samples were evaluated under the optimum experi- mental conditions. Differential-pulse voltammetric experi- ments were carried out for 1.0 μM chalcone in the pres- ence of 1.0 mM of each of the interferents. The experimen- tal results (Table 1) showed that thousand-fold excess of glucose, starch, sucrose, dextrose, gum acacia, citric acid, tartaric acid and oxalic acid did not interfere with the volt- ammetric signal of chalcone. Therefore, the proposed meth- od can be used as a selective method. 3.10. Detection of Chalcone in Spiked Human Plasma Samples The developed differential-pulse voltammetric method for the chalcone determination was applied to spiked human plasma samples. The recoveries from human plasma were measured by spiking drug free plasma with known amounts of chalcone. The plasma samples were prepared as de- scribed in experimental section. A quantitative analysis can be carried out by adding the standard solution of chalcone into the detect system of plasma sample. The calibration graph was used for the determination of spiked chalcone in plasma samples. The results of four plasma samples obtained are listed in Table 2. The recovery determined was in the range from 98.0% to 103.0% and the RSD was 2.05%. Table 1. Influence of potential interferents on the voltam- metric response of 1.0 μM chalcone. Interferent Concentration (mM) Signal change (%) Glucose 1.0 −1.6 Starch 1.0 −1.2 Sucrose 1.0 −1.6 Dextrose 1.0 −1.6 Citric acid 1.0 −1.2 Tartaric acid 1.0 −1.6 Oxalic acid 1.0 −1.2 Gum acacia 1.0 −1.6 Table 2. Determination of chalcone in spiked human plasma samples. Human plasma Spiked (μM) Detection(a) (μM) Recovery (%)SD ± RSD (%) Sample 1 0.3 0.3046 98.17 0.0011 ± 3.83 Sample 2 0.7 0.7003 99.59 0.0079 ± 1.13 Sample 3 3.0 2.8981 103.19 0.0092 ± 3.17 Sample 4 7.0 6.941 100.04 0.0057 ± 0.82 (a)Mean average of five determinations. Copyright © 2012 SciRes. AJAC 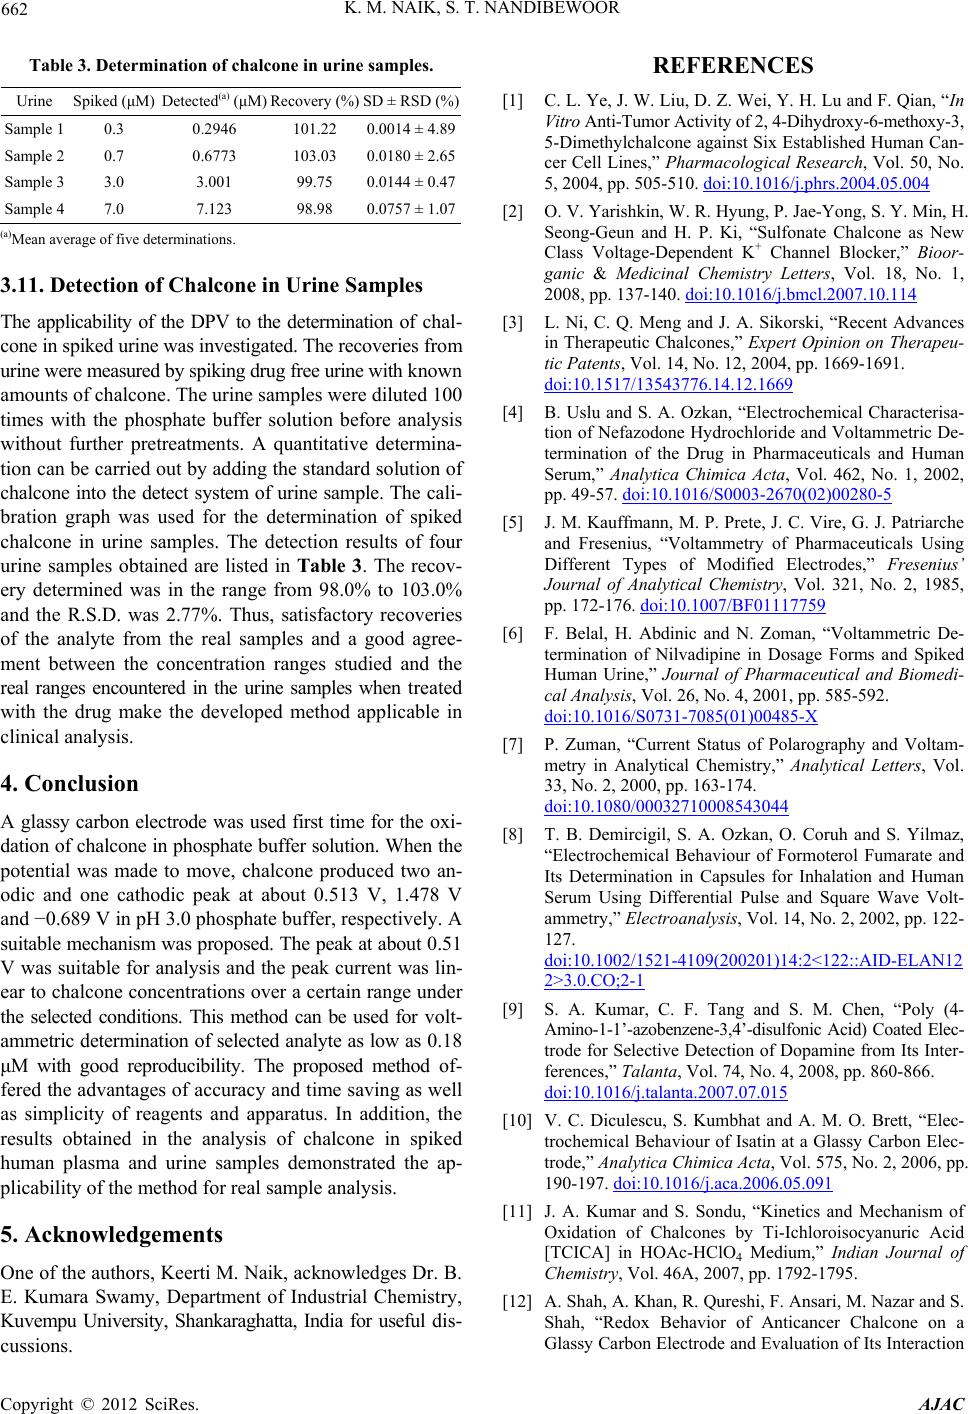 K. M. NAIK, S. T. NANDIBEWOOR 662 Table 3. Determination of chalcone in urine samples. Urine Spiked (μM) Detected(a) (μM) Recovery (%) SD ± RSD (%) Sample 1 0.3 0.2946 101.22 0.0014 ± 4.89 Sample 2 0.7 0.6773 103.03 0.0180 ± 2.65 Sample 3 3.0 3.001 99.75 0.0144 ± 0.47 Sample 4 7.0 7.123 98.98 0.0757 ± 1.07 (a)Mean average of five determinations. 3.11. Detection of Chalcone in Urine Samples The applicability of the DPV to the determination of chal- cone in spiked urine was investigated. The recoveries from urine were measured by spiking drug free urine with known amounts of chalcone. The urine samples were diluted 100 times with the phosphate buffer solution before analysis without further pretreatments. A quantitative determina- tion can be carried out by adding the standard solution of chalcone into the detect system of urine sample. The cali- bration graph was used for the determination of spiked chalcone in urine samples. The detection results of four urine samples obtained are listed in Table 3. The recov- ery determined was in the range from 98.0% to 103.0% and the R.S.D. was 2.77%. Thus, satisfactory recoveries of the analyte from the real samples and a good agree- ment between the concentration ranges studied and the real ranges encountered in the urine samples when treated with the drug make the developed method applicable in clinical analysis. 4. Conclusion A glassy carbon electrode was used first time for the oxi- dation of chalcone in phosphate buffer solution. When the potential was made to move, chalcone produced two an- odic and one cathodic peak at about 0.513 V, 1.478 V and −0.689 V in pH 3.0 phosphate buffer, respectively. A suitable mechanism was proposed. The peak at about 0.51 V was suitable for analysis and the peak current was lin- ear to chalcone concentrations over a certain range under the selected conditions. This method can be used for volt- ammetric determination of selected analyte as low as 0.18 μM with good reproducibility. The proposed method of- fered the advantages of accuracy and time saving as well as simplicity of reagents and apparatus. In addition, the results obtained in the analysis of chalcone in spiked human plasma and urine samples demonstrated the ap- plicability of the method for real sample analysis. 5. Acknowledgements One of the authors, Keerti M. Naik, acknowledges Dr. B. E. Kumara Swamy, Department of Industrial Chemistry, Kuvempu University, Shankaraghatta, India for useful dis- cussions. REFERENCES [1] C. L. Ye, J. W. Liu, D. Z. Wei, Y. H. Lu and F. Qian, “In Vitro Anti-Tumor Activity of 2, 4-Dihydroxy-6-methoxy-3, 5-Dimethylchalcone against Six Established Human Can- cer Cell Lines,” Pharmacological Research, Vol. 50, No. 5, 2004, pp. 505-510. doi:10.1016/j.phrs.2004.05.004 [2] O. V. Yarishkin, W. R. Hyung, P. Jae-Yong, S. Y. Min, H. Seong-Geun and H. P. Ki, “Sulfonate Chalcone as New Class Voltage-Dependent K+ Channel Blocker,” Bioor- ganic & Medicinal Chemistry Letters, Vol. 18, No. 1, 2008, pp. 137-140. doi:10.1016/j.bmcl.2007.10.114 [3] L. Ni, C. Q. Meng and J. A. Sikorski, “Recent Advances in Therapeutic Chalcones,” Expert Opinion on Therapeu- tic Patents, Vol. 14, No. 12, 2004, pp. 1669-1691. doi:10.1517/13543776.14.12.1669 [4] B. Uslu and S. A. Ozkan, “Electrochemical Characterisa- tion of Nefazodone Hydrochloride and Voltammetric De- termination of the Drug in Pharmaceuticals and Human Serum,” Analytica Chimica Acta, Vol. 462, No. 1, 2002, pp. 49-57. doi:10.1016/S0003-2670(02)00280-5 [5] J. M. Kauffmann, M. P. Prete, J. C. Vire, G. J. Patriarche and Fresenius, “Voltammetry of Pharmaceuticals Using Different Types of Modified Electrodes,” Fresenius’ Journal of Analytical Chemistry, Vol. 321, No. 2, 1985, pp. 172-176. doi:10.1007/BF01117759 [6] F. Belal, H. Abdinic and N. Zoman, “Voltammetric De- termination of Nilvadipine in Dosage Forms and Spiked Human Urine,” Journal of Pharmaceutical and Biomedi- cal Analysis, Vol. 26, No. 4, 2001, pp. 585-592. doi:10.1016/S0731-7085(01)00485-X [7] P. Zuman, “Current Status of Polarography and Voltam- metry in Analytical Chemistry,” Analytical Letters, Vol. 33, No. 2, 2000, pp. 163-174. doi:10.1080/00032710008543044 [8] T. B. Demircigil, S. A. Ozkan, O. Coruh and S. Yilmaz, “Electrochemical Behaviour of Formoterol Fumarate and Its Determination in Capsules for Inhalation and Human Serum Using Differential Pulse and Square Wave Volt- ammetry,” Electroanalysis, Vol. 14, No. 2, 2002, pp. 122- 127. doi:10.1002/1521-4109(200201)14:2<122::AID-ELAN12 2>3.0.CO;2-1 [9] S. A. Kumar, C. F. Tang and S. M. Chen, “Poly (4- Amino-1-1’-azobenzene-3,4’-disulfonic Acid) Coated Elec- trode for Selective Detection of Dopamine from Its Inter- ferences,” Talanta, Vol. 74, No. 4, 2008, pp. 860-866. doi:10.1016/j.talanta.2007.07.015 [10] V. C. Diculescu, S. Kumbhat and A. M. O. Brett, “Elec- trochemical Behaviour of Isatin at a Glassy Carbon Elec- trode,” Analytica Chimica Acta, Vol. 575, No. 2, 2006, pp. 190-197. doi:10.1016/j.aca.2006.05.091 [11] J. A. Kumar and S. Sondu, “Kinetics and Mechanism of Oxidation of Chalcones by Ti-Ichloroisocyanuric Acid [TCICA] in HOAc-HClO4 Medium,” Indian Journal of Chemistry, Vol. 46A, 2007, pp. 1792-1795. [12] A. Shah, A. Khan, R. Qureshi, F. Ansari, M. Nazar and S. Shah, “Redox Behavior of Anticancer Chalcone on a Glassy Carbon Electrode and Evaluation of Its Interaction Copyright © 2012 SciRes. AJAC 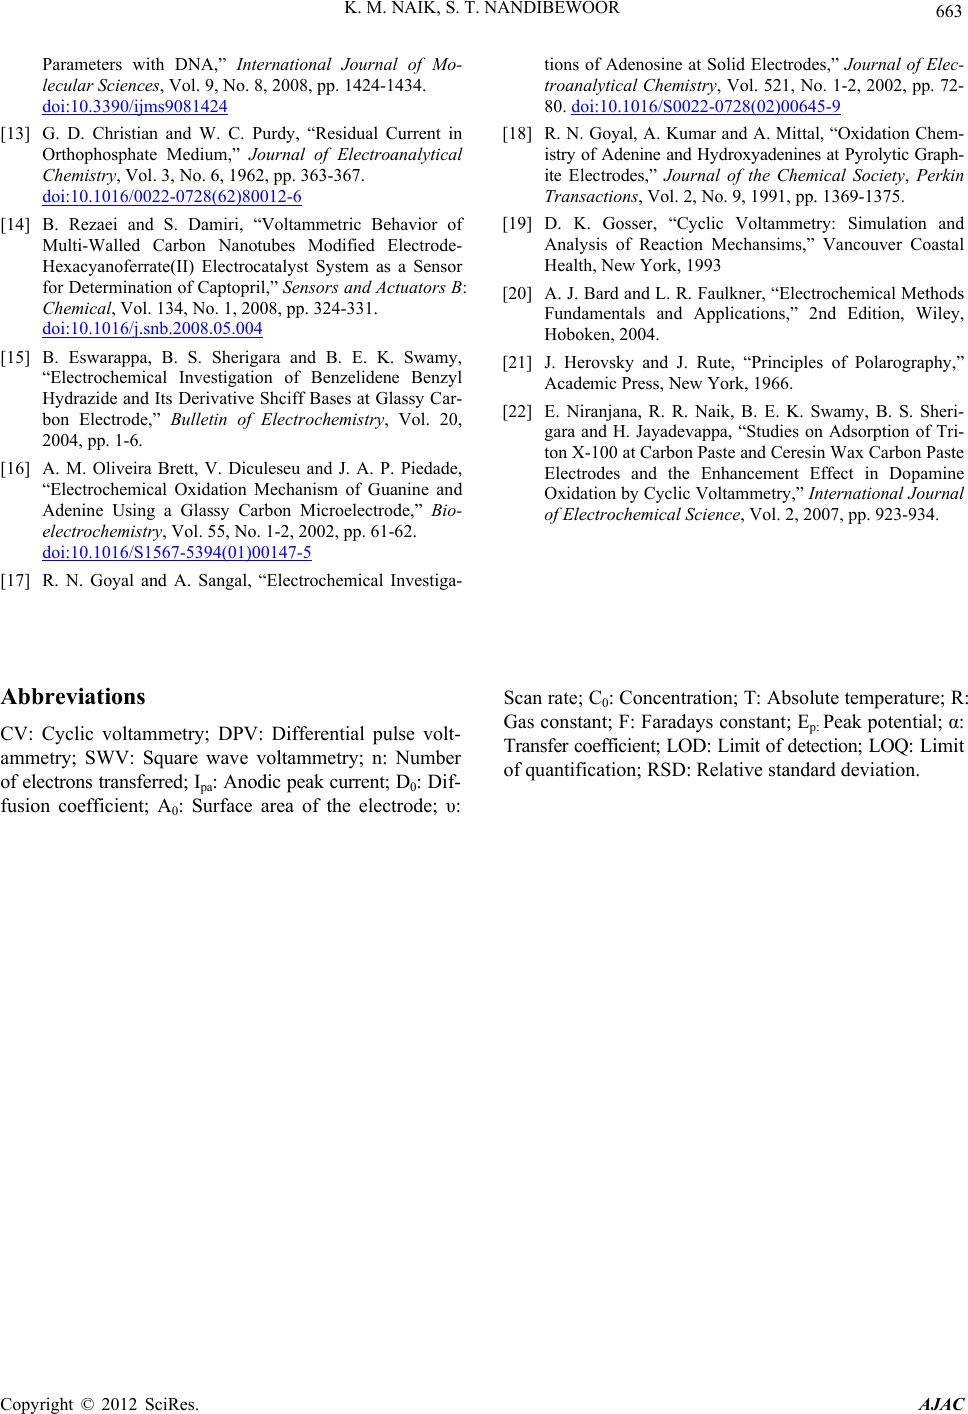 K. M. NAIK, S. T. NANDIBEWOOR Copyright © 2012 SciRes. AJAC 663 Parameters with DNA,” International Journal of Mo- lecular Sciences, Vol. 9, No. 8, 2008, pp. 1424-1434. doi:10.3390/ijms9081424 [13] G. D. Christian and W. C. Purdy, “Residual Current in Orthophosphate Medium,” Journal of Electroanalytical Chemistry, Vol. 3, No. 6, 1962, pp. 363-367. doi:10.1016/0022-0728(62)80012-6 [14] B. Rezaei and S. Damiri, “Voltammetric Behavior of Multi-Walled Carbon Nanotubes Modified Electrode- Hexacyanoferrate(II) Electrocatalyst System as a Sensor for Determination of Captopril,” Sensors and Actuators B: Chemical, Vol. 134, No. 1, 2008, pp. 324-331. doi:10.1016/j.snb.2008.05.004 [15] B. Eswarappa, B. S. Sherigara and B. E. K. Swamy, “Electrochemical Investigation of Benzelidene Benzyl Hydrazide and Its Derivative Shciff Bases at Glassy Car- bon Electrode,” Bulletin of Electrochemistry, Vol. 20, 2004, pp. 1-6. [16] A. M. Oliveira Brett, V. Diculeseu and J. A. P. Piedade, “Electrochemical Oxidation Mechanism of Guanine and Adenine Using a Glassy Carbon Microelectrode,” Bio- electrochemistry, Vol. 55, No. 1-2, 2002, pp. 61-62. doi:10.1016/S1567-5394(01)00147-5 [17] R. N. Goyal and A. Sangal, “Electrochemical Investiga- tions of Adenosine at Solid Electrodes,” Journal of Elec- troanalytical Chemistry, Vol. 521, No. 1-2, 2002, pp. 72- 80. doi:10.1016/S0022-0728(02)00645-9 [18] R. N. Goyal, A. Kumar and A. Mittal, “Oxidation Chem- istry of Adenine and Hydroxyadenines at Pyrolytic Graph- ite Electrodes,” Journal of the Chemical Society, Perkin Transactions, Vol. 2, No. 9, 1991, pp. 1369-1375. [19] D. K. Gosser, “Cyclic Voltammetry: Simulation and Analysis of Reaction Mechansims,” Vancouver Coastal Health, New York, 1993 [20] A. J. Bard and L. R. Faulkner, “Electrochemical Methods Fundamentals and Applications,” 2nd Edition, Wiley, Hoboken, 2004. [21] J. Herovsky and J. Rute, “Principles of Polarography,” Academic Press, New York, 1966. [22] E. Niranjana, R. R. Naik, B. E. K. Swamy, B. S. Sheri- gara and H. Jayadevappa, “Studies on Adsorption of Tri- ton X-100 at Carbon Paste and Ceresin Wax Carbon Paste Electrodes and the Enhancement Effect in Dopamine Oxidation by Cyclic Voltammetry,” International Journal of Electrochemical Science, Vol. 2, 2007, pp. 923-934. Abbreviations CV: Cyclic voltammetry; DPV: Differential pulse volt- ammetry; SWV: Square wave voltammetry; n: Number of electrons transferred; Ipa: Anodic peak current; D0: Dif- fusion coefficient; A0: Surface area of the electrode; υ: Scan rate; C0: Concentration; T: Absolute temperature; R: Gas constant; F: Faradays constant; Ep: Peak potential; α: Transfer coefficient; LOD: Limit of detection; LOQ: Limit of quantification; RSD: Relative standard deviation. |