

Paper Menu >>
Journal Menu >>
 American Journal of Analytical Chemistry, 2012, 3, 613-621 doi:10.4236/ajac.2012.39080 Published Online September 2012 (http://www.SciRP.org/journal/ajac) Copyright © 2012 SciRes. AJAC Analysis of Urea in Petfood Matrices: Comparison of Spectro-Colorimetric, Enzymatic and Liquid Chromatography Electrospray Ionization High Resolution Mass Spectrometry Methods Patrick Pibarot 1 , Serge Pilard 2 1 Nestlé Research and Development Centers, Aubigny, France 2 Analytical Platform, University of Picardie Jules Verne, Amiens, France Email: [email protected] Received July 4, 2012; revised August 12, 2012; accepted August 19, 2012 ABSTRACT Adulteration may consist in non authorized source of nitrogen addition to increase the protein content of some raw ma- terials. Urea which is authorized for feed is a non nutritional source of nitrogen in food and pet food. Adulteration of food or pet food raw material by urea is thus monitored by manufacturer and governmental authorities with official methods which are either enzymatic (Association of Official Agricultural Chemists, AOAC) or spectro-colorimetric (European Community, EC). Each method gives results which are not comparable and spectro-colorimetric methods may result in false-positive urea detection. Liquid chromatographic (LC/UV-DAD) analysis of extracts from spectro- colorimetric method indicates that presence of free amino-acid may interfere with colorimetric detection of urea in the EC method with pet food samples. Liquid chromatography electrospray ionization high resolution mass spectrometry (LC/ESI-HRMS) has allowed to quantify low content (<0.01%) of urea in pet food water extracts for samples which resulted in significant urea detection with colorimetric method and in content below the detection threshold with enzy- matic method. This study demonstrates the EC colorimetric method is not applicable to pet food and also food samples which have a complex composition with significant levels of free amino acids. On the other hand we clearly evidenced by means of the LC/ESI-HRMS results that the AOC Enzymatic method is applicable to urea quantification in pet food samples and gives reliable results. Keywords: Pet Food; Food; Urea; Adulteration; Enzymatic Method; Spectro-Colorimetry; LC/UV-DAD; LC/ESI-HRMS 1. Introduction Non authorized food ingredient can be used to adulterate ingredients, raw materials (e.g. Gluten) or finished prod- uct (e.g. milk products) to artificially increase the protein content. Melamine, for instance, has been used as the food additive to increase the apparent protein content in food products [1]. Ruminant can convert non protein nitrogen into protein and urea may be used to increase the nutritional nitrogen content of feed, hay or silage. Urea is authorized as a com- ponent of animal feeds to provide nutritional source of nitrogen. Urea is accepted as a “Generally Recognized as Safe” food additive and is also used as a fermentation aid in foods and beverages [2]. Urea is produced in the liver of mammals as an end- product of protein metabolism and excreted in urine. Hu- mans excrete up to 30 grams of urea per day in the urine [2]. Avian species (e.g. poultry) metabolize mainly uric acid (55% - 72%) and some urea in lower proportion (2% - 11%), the rest of protein metabolism product is ammonia (11% - 21%) [3,4]. Therefore, poultry meat and by products should not present significant amount of urea while mammal meat by-product may contain some urea in more significant amounts. Kjeldahl or Dumas methods measure the protein con- tent by analyzing total nitrogen content, without identi- fying its sources. The research of non-protein nitrogen source is complementary to protein analysis to check the absence of adulteration in raw materials and finished pro- ducts. Urea is one possible molecule which may be used to adulterate (increase nitrogen content) food and petfood or one of the ingredients used to manufacture food or pet- food.  P. PIBAROT, S. PILARD Copyright © 2012 SciRes. AJAC 614 Therefore, even if toxicology is not an issue, the analy- sis of urea in food ingredients and in finished products may be of importance to prevent the use of non author- ized nitrogen sources in food and petfood industries. Various analytical methods including colorimetry, urea enzymatic conversion to ammonia, liquid or gas chroma- tography or near infrared spectrometry are described for urea analysis in feed, silage, fertilizers, blood, serum, urine and other matrices [5]. The two main analytical methods used in food and feed areas are: Spectro-colorimetric methods [6,7]; Enzymatic (urease) methods [8]. These methods are either based: On the reaction of urea with a specific molecule to create a chromophore which content is analyzed by spe- ctro-colorimetry; Or on the enzymatic degradation of urea in presence of urease to ammonia and on ammonia analysis by the Kjeldahl method (acidic titration) or other various met- hods. Their main advantage is rapid and easy to use protocol. Other more sophisticated methods based on gas chro- matography coupled to isotope ratio [9] or isotope dilu- tion [10,11] mass spectrometry and liquid chromatogra- phy hyphenated to tandem mass spectrometry [1] have been developed. Several cases of interference in colorimetric method or enzyme activity disturbance are reported [5,11,12]. Co-elution problem leading to result variations in chr- omatography methods are also reported [13]. The objective of the current study is: To compare the results of spectro-colorimetric method and enzymatic method reliability for the routine analy- sis of urea dry petfood products; To define which method is the most suitable for urea analysis in dry petfood by comparing the results ob- tained by the routine methods to the results obtained with liquid chromatography electrospray ionization high resolution mass spectrometry (LC/ESI-HRMS). Finally the conclusion of the study should allow to rec- ommend an official method for analyzing urea in dry pet- food products and in pet food raw materials. 2. Experimental Sections 2.1. Spectro-Colorimetric Method (European Regulation) This method corresponds to the method recommended by the European Union and is described in European Com- mission Regulation (EC) No. 152/2009 laying down the methods of sampling and analysis for the official control of feed [6]. This method is also described as a AOAC method [7]. The sample is suspended in water with a clarifying agent (active carbon). The suspension is filtered. The urea con- tent of the filtrate is determined after the addition of 4- dimethylaminobenzaldehyde (4-DMAB) by measuring the optical density at a wavelength of 420 nm. If the sample contains simple nitrogenous compounds such as amino acids, the optical density shall be measured at 435 nm. 2.2. Enzymatic Method The enzymatic method is the official method of urea ana- lysis in feed of AOAC international (No. 941.04) [8]. The method consists in digesting 1 g of samples in urease enzyme solution at pH = 7 in order to convert the urea in carbon dioxide and ammonia. After alkalization, ammo- nia vapor is released and distillated in a known amount of acid and the distillate titrated with standard base solu- tion (Kjedhal method). It should be noticed that ammonia is analyzed together with urea and that some heavy metal may inhibit the ac- tivity of urease. 2.3. Liquid Chromatography Ultraviolet-Visible Diode Array Detection (LC/UV-DAD) The analyses were run on AS DX 500 HPLC (Dionex, Sunnyvale CA, USA) equipment with UV-Vis Diode Ar- ray detector UVD 340 S. After several trials with several columns and elution conditions (ion exchange, pH adjustment) the following chromatographic conditions were selected. The reverse phase column was an Acclaim PA2 C18, 4.6 × 150 mm, 5 µm supplied by Dionex France. The chromatographic conditions were: Isocratic elution with 100% purified water at 1 mL/min and 30˚C; Sample injection 250 µL (auto-sampler AS 50); Detection 200 - 595 nm (resolution 1nm). Urea quan- tification is performed at 435 nm as indicated in the EC protocol [6,7]. The samples of petfood were ground and extracted in the same conditions than for the DMAB spectro-colori- metric analysis (except active carbon treatment). The ex- tract reacted with DMAB were directly injected on the HPLC column. The separation and detection of the mole- cules produced by reaction between urea and DMAB has been chosen with two objectives: To improve the selectivity and sensibility of the urea detection by UV absorbance; To check the presence of other molecules than urea in dry pet food which may react with DMAB and absorb at the wavelength used by the EC colorimetric method. 2.4. Liquid Chromatography Electrospray Ionization High Resolution Mass Spectrometry (LC/ESI-HRMS) The LC/ESI-HRMS experiments were performed on a Q- 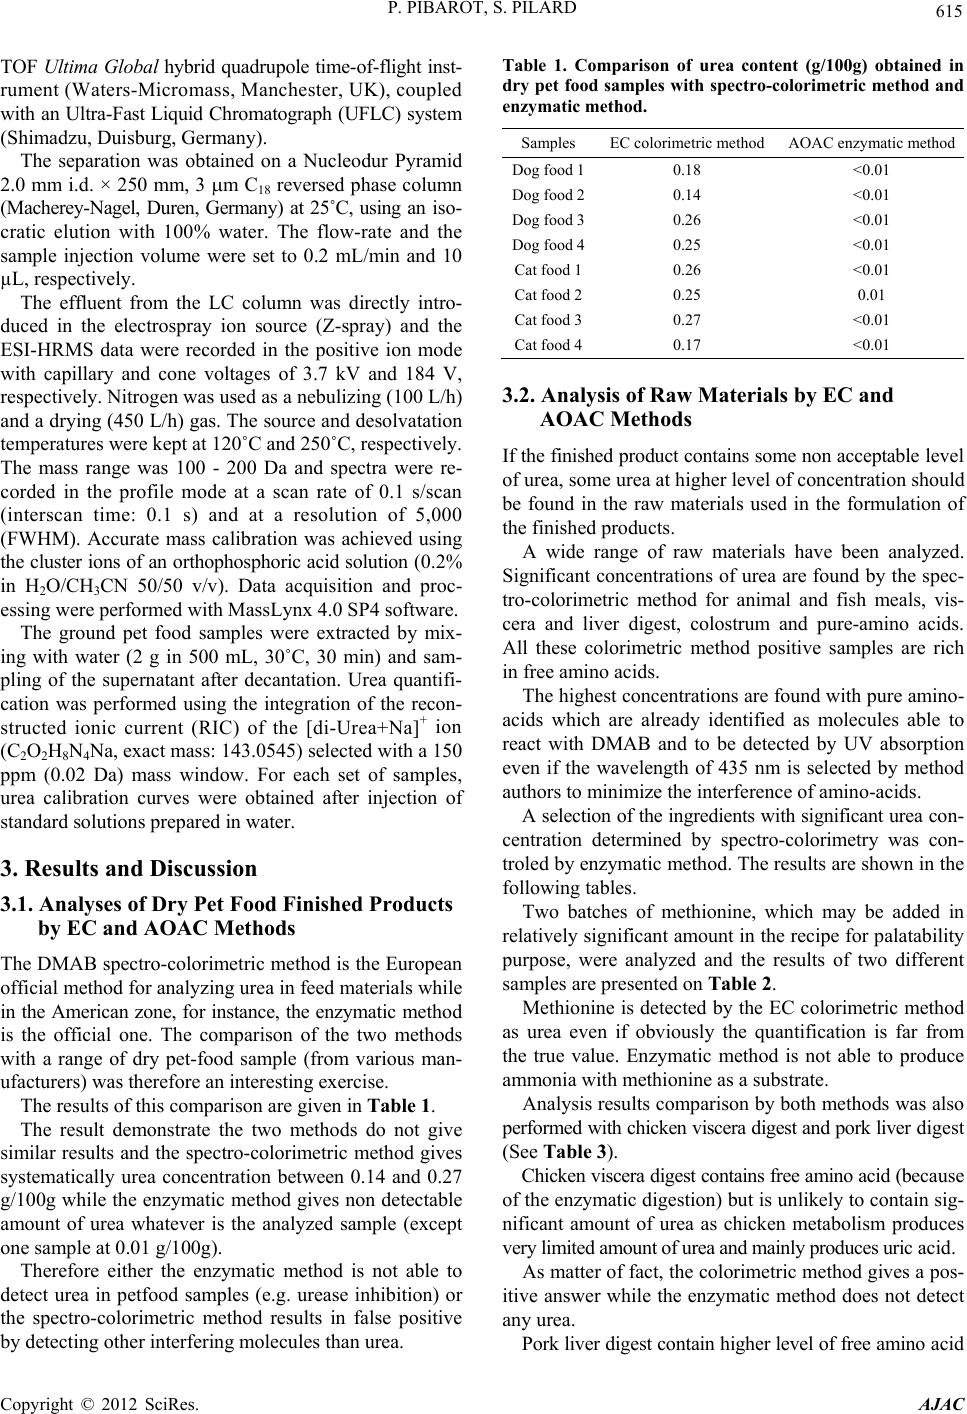 P. PIBAROT, S. PILARD Copyright © 2012 SciRes. AJAC 615 TOF Ultima Global hybrid quadrupole time-of-flight inst- rument (Waters-Micromass, Manchester, UK), coupled with an Ultra-Fast Liquid Chromatograph (UFLC) system (Shimadzu, Duisburg, Germany). The separation was obtained on a Nucleodur Pyramid 2.0 mm i.d. × 250 mm, 3 m C 18 reversed phase column (Macherey-Nagel, Duren, Germany) at 25˚C, using an iso- cratic elution with 100% water. The flow-rate and the sample injection volume were set to 0.2 mL/min and 10 µL, respectively. The effluent from the LC column was directly intro- duced in the electrospray ion source (Z-spray) and the ESI-HRMS data were recorded in the positive ion mode with capillary and cone voltages of 3.7 kV and 184 V, respectively. Nitrogen was used as a nebulizing (100 L/h) and a drying (450 L/h) gas. The source and desolvatation temperatures were kept at 120˚C and 250˚C, respectively. The mass range was 100 - 200 Da and spectra were re- corded in the profile mode at a scan rate of 0.1 s/scan (interscan time: 0.1 s) and at a resolution of 5,000 (FWHM). Accurate mass calibration was achieved using the cluster ions of an orthophosphoric acid solution (0.2% in H 2 O/CH 3 CN 50/50 v/v). Data acquisition and proc- essing were performed with MassLynx 4.0 SP4 software. The ground pet food samples were extracted by mix- ing with water (2 g in 500 mL, 30˚ C, 30 min) and sam- pling of the supernatant after decantation. Urea quantifi- cation was performed using the integration of the recon- structed ionic current (RIC) of the [di-Urea+Na] + ion (C 2 O 2 H 8 N 4 Na, exact mass: 143.0545) selected with a 150 ppm (0.02 Da) mass window. For each set of samples, urea calibration curves were obtained after injection of standard solutions prepared in water. 3. Results and Discussion 3.1. Analyses of Dry Pet Food Finished Products by EC and AOAC Methods The DMAB spectro-colorimetric method is the European official method for analyzing urea in feed materials while in the American zone, for instance, the enzymatic method is the official one. The comparison of the two methods with a range of dry pet-food sample (from various man- ufacturers) was therefore an interesting exercise. The results of this comparison are given in Table 1. The result demonstrate the two methods do not give similar results and the spectro-colorimetric method gives systematically urea concentration between 0.14 and 0.27 g/100g while the enzymatic method gives non detectable amount of urea whatever is the analyzed sample (except one sample at 0.01 g/100g). Therefore either the enzymatic method is not able to detect urea in petfood samples (e.g. urease inhibition) or the spectro-colorimetric method results in false positive by detecting other interfering molecules than urea. Table 1. Comparison of urea content (g/100g) obtained in dry pet food samples with spectro-colorimetric method and enzymatic method. Samples EC colorimetric method AOAC enzymatic method Dog food 10.18 <0.01 Dog food 20.14 <0.01 Dog food 30.26 <0.01 Dog food 40.25 <0.01 Cat food 10.26 <0.01 Cat food 20.25 0.01 Cat food 30.27 <0.01 Cat food 40.17 <0.01 3.2. Analysis of Raw Materials by EC and AOAC Methods If the finished product contains some non acceptable level of urea, some urea at higher level of concentration should be found in the raw materials used in the formulation of the finished products. A wide range of raw materials have been analyzed. Significant concentrations of urea are found by the spec- tro-colorimetric method for animal and fish meals, vis- cera and liver digest, colostrum and pure-amino acids. All these colorimetric method positive samples are rich in free amino acids. The highest concentrations are found with pure amino- acids which are already identified as molecules able to react with DMAB and to be detected by UV absorption even if the wavelength of 435 nm is selected by method authors to minimize the interference of amino-acids. A selection of the ingredients with significant urea con- centration determined by spectro-colorimetry was con- troled by enzymatic method. The results are shown in the following tables. Two batches of methionine, which may be added in relatively significant amount in the recipe for palatability purpose, were analyzed and the results of two different samples are presented on Table 2. Methionine is detected by the EC colorimetric method as urea even if obviously the quantification is far from the true value. Enzymatic method is not able to produce ammonia with methionine as a substrate. Analysis results comparison by both methods was also performed with chicken viscera digest and pork liver digest (See Table 3). Chicken viscera digest contains free amino acid (because of the enzymatic digestion) but is unlikely to contain sig- nificant amount of urea as chicken metabolism produces very limited amount of urea and mainly produces uric acid. As matter of fact, the colorimetric method gives a pos- itive answer while the enzymatic method does not detect any urea. Pork liver digest contain higher level of free amino acid 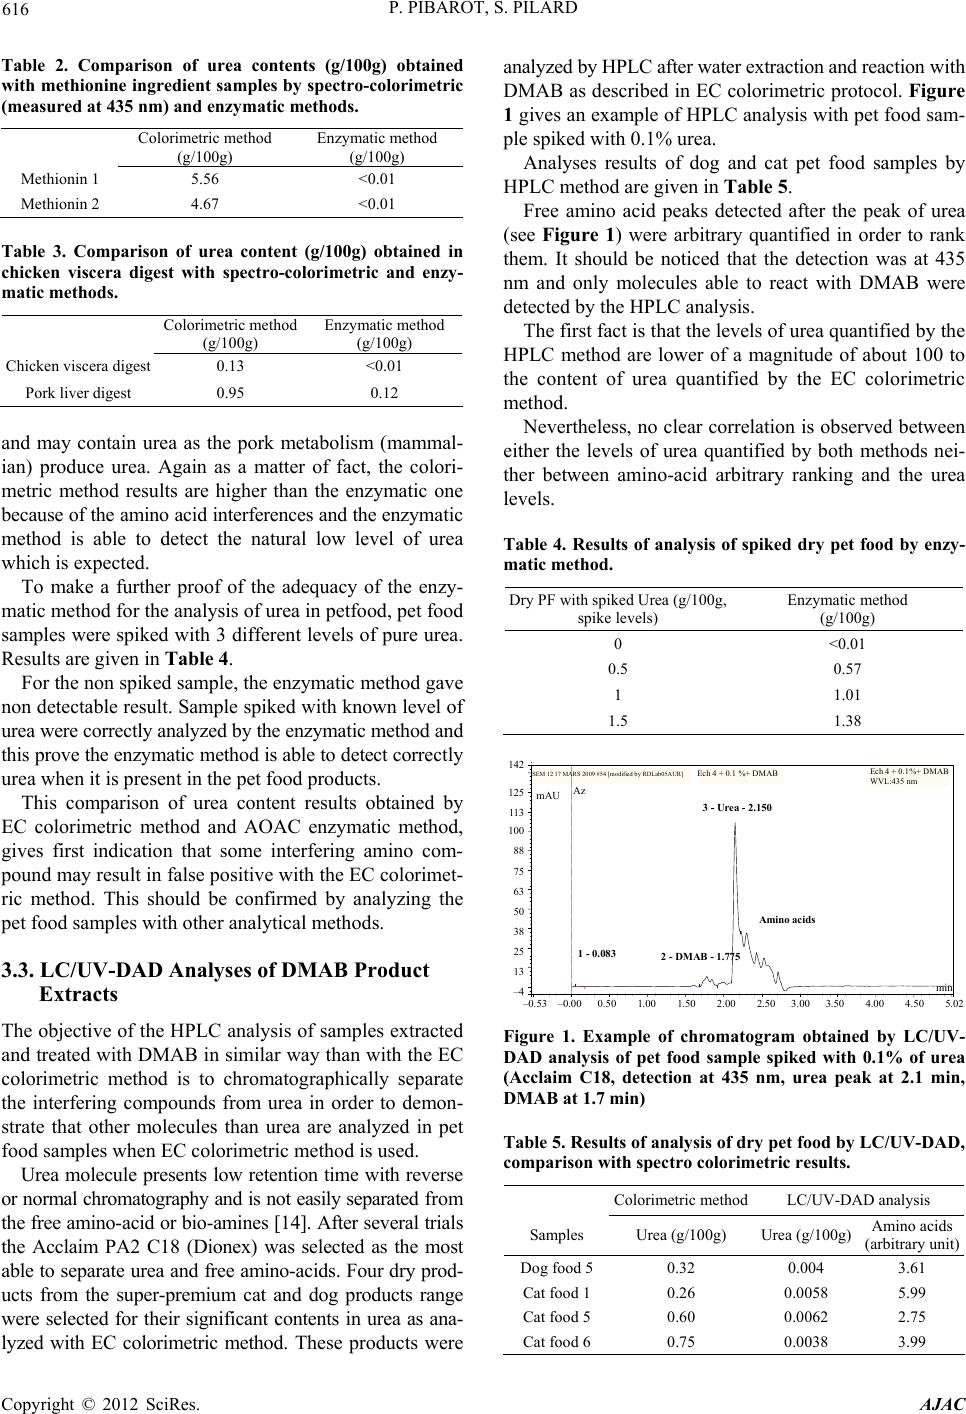 P. PIBAROT, S. PILARD Copyright © 2012 SciRes. AJAC 616 Table 2. Comparison of urea contents (g/100g) obtained with methionine ingredient samples by spectro-colorimetric (measured at 435 nm) and enzymatic methods. Colorimetric method (g/100g) Enzymatic method (g/100g) Methionin 1 5.56 <0.01 Methionin 2 4.67 <0.01 Table 3. Comparison of urea content (g/100g) obtained in chicken viscera digest with spectro-colorimetric and enzy- matic methods. Colorimetric method (g/100g) Enzymatic method (g/100g) Chicken viscera digest 0.13 <0.01 Pork liver digest 0.95 0.12 and may contain urea as the pork metabolism (mammal- ian) produce urea. Again as a matter of fact, the colori- metric method results are higher than the enzymatic one because of the amino acid interferences and the enzymatic method is able to detect the natural low level of urea which is expected. To make a further proof of the adequacy of the enzy- matic method for the analysis of urea in petfood, pet food samples were spiked with 3 different levels of pure urea. Results are given in Table 4. For the non spiked sample, the enzymatic method gave non detectable result. Sample spiked with known level of urea were correctly analyzed by the enzymatic method and this prove the enzymatic method is able to detect correctly urea when it is present in the pet food products. This comparison of urea content results obtained by EC colorimetric method and AOAC enzymatic method, gives first indication that some interfering amino com- pound may result in false positive with the EC colorimet- ric method. This should be confirmed by analyzing the pet food samples with other analytical methods. 3.3. LC/UV-DAD Analyses of DMAB Product Extracts The objective of the HPLC analysis of samples extracted and treated with DMAB in similar way than with the EC colorimetric method is to chromatographically separate the interfering compounds from urea in order to demon- strate that other molecules than urea are analyzed in pet food samples when EC colorimetric method is used. Urea molecule presents low retention time with reverse or normal chromatography and is not easily separated from the free amino-acid or bio-amines [14]. After several trials the Acclaim PA2 C18 (Dionex) was selected as the most able to separate urea and free amino-acids. Four dry prod- ucts from the super-premium cat and dog products range were selected for their significant contents in urea as ana- lyzed with EC colorimetric method. These products were analyzed by HPLC after water extraction and reaction with DMAB as described in EC colorimetric protocol. Figure 1 gives an example of HPLC analysis with pet food sam- ple spiked with 0.1% urea. Analyses results of dog and cat pet food samples by HPLC method are given in Table 5. Free amino acid peaks detected after the peak of urea (see Figure 1) were arbitrary quantified in order to rank them. It should be noticed that the detection was at 435 nm and only molecules able to react with DMAB were detected by the HPLC analysis. The first fact is that the levels of urea quantified by the HPLC method are lower of a magnitude of about 100 to the content of urea quantified by the EC colorimetric method. Nevertheless, no clear correlation is observed between either the levels of urea quantified by both methods nei- ther between amino-acid arbitrary ranking and the urea levels. Table 4. Results of analysis of spiked dry pet food by enzy- matic method. Dry PF with spiked Urea (g/100g, spike levels) Enzymatic method (g/100g) 0<0.01 0.50.57 11.01 1.51.38 – 0.53 –0.00 0.50 1.00 1.50 2.00 2.50 3.00 3.50 4.00 4.50 5.02 142 125 113 100 88 75 63 50 38 25 13 –4 SEM 12 17 MARS 2009 #54 [modified by RDLab05AUR] Ech 4 + 0.1 %+ DMAB Ech 4 + 0.1%+ DMAB WVL:435 nm mAU min 1 - 0.083 2 - DMAB - 1.775 3 - Urea - 2.150 Az Amino acids Figure 1. Example of chromatogram obtained by LC/UV- DAD analysis of pet food sample spiked with 0.1% of urea (Acclaim C18, detection at 435 nm, urea peak at 2.1 min, DMAB at 1.7 min) Table 5. Results of analysis of dry pet food by LC/UV-DAD, comparison with spectro colorimetric results. Colorimetric method LC/UV-DAD analysis Samples Urea (g/100g) Urea (g/100g) Amino acids (arbitrary unit) Dog food 5 0.32 0.004 3.61 Cat food 1 0.26 0.0058 5.99 Cat food 5 0.60 0.0062 2.75 Cat food 6 0.75 0.0038 3.99 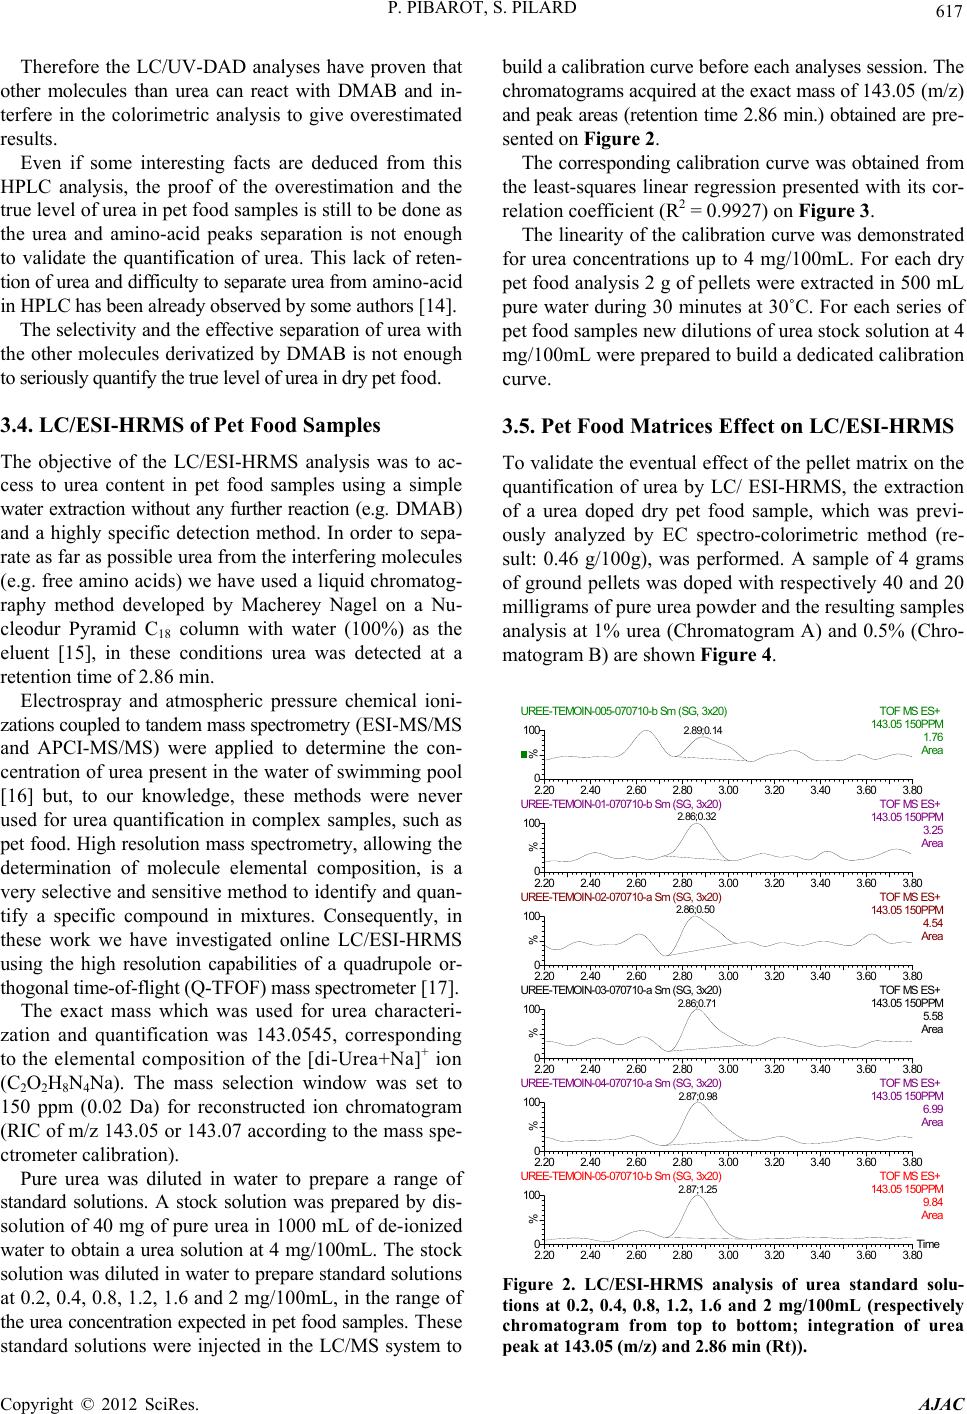 P. PIBAROT, S. PILARD Copyright © 2012 SciRes. AJAC 617 Therefore the LC/UV-DAD analyses have proven that other molecules than urea can react with DMAB and in- terfere in the colorimetric analysis to give overestimated results. Even if some interesting facts are deduced from this HPLC analysis, the proof of the overestimation and the true level of urea in pet food samples is still to be done as the urea and amino-acid peaks separation is not enough to validate the quantification of urea. This lack of reten- tion of urea and difficulty to separate urea from amino-acid in HPLC has been already observed by some authors [14]. The selectivity and the effective separation of urea with the other molecules derivatized by DMAB is not enough to seriously quantify the true level of urea in dry pet food. 3.4. LC/ESI-HRMS of Pet Food Samples The objective of the LC/ESI-HRMS analysis was to ac- cess to urea content in pet food samples using a simple water extraction without any further reaction (e.g. DMAB) and a highly specific detection method. In order to sepa- rate as far as possible urea from the interfering molecules (e.g. free amino acids) we have used a liquid chromatog- raphy method developed by Macherey Nagel on a Nu- cleodur Pyramid C 18 column with water (100%) as the eluent [15], in these conditions urea was detected at a retention time of 2.86 min. Electrospray and atmospheric pressure chemical ioni- zations coupled to tandem mass spectrometry (ESI-MS/MS and APCI-MS/MS) were applied to determine the con- centration of urea present in the water of swimming pool [16] but, to our knowledge, these methods were never used for urea quantification in complex samples, such as pet food. High resolution mass spectrometry, allowing the determination of molecule elemental composition, is a very selective and sensitive method to identify and quan- tify a specific compound in mixtures. Consequently, in these work we have investigated online LC/ESI-HRMS using the high resolution capabilities of a quadrupole or- thogonal time-of-flight (Q-TFOF) mass spectrometer [17]. The exact mass which was used for urea characteri- zation and quantification was 143.0545, corresponding to the elemental composition of the [di-Urea+Na] + ion (C 2 O 2 H 8 N 4 Na). The mass selection window was set to 150 ppm (0.02 Da) for reconstructed ion chromatogram (RIC of m/z 143.05 or 143.07 according to the mass spe- ctrometer calibration). Pure urea was diluted in water to prepare a range of standard solutions. A stock solution was prepared by dis- solution of 40 mg of pure urea in 1000 mL of de-ionized water to obtain a urea solution at 4 mg/100mL. The stock solution was diluted in water to prepare standard solutions at 0.2, 0.4, 0.8, 1.2, 1.6 and 2 mg/100mL, in the range of the urea concentration expected in pet food samples. These standard solutions were injected in the LC/MS system to build a calibration curve before each analyses session. The chromatograms acquired at the exact mass of 143.05 (m/z) and peak areas (retention time 2.86 min.) obtained are pre- sented on Figure 2. The corresponding calibration curve was obtained from the least-squares linear regression presented with its cor- relation coefficient (R 2 = 0.9927) on Figure 3. The linearity of the calibration curve was demonstrated for urea concentrations up to 4 mg/100mL. For each dry pet food analysis 2 g of pellets were extracted in 500 mL pure water during 30 minutes at 30˚C. For each series of pet food samples new dilutions of urea stock solution at 4 mg/100mL were prepared to build a dedicated calibration curve. 3.5. Pet Food Matrices Effect on LC/ESI-HRMS To validate the eventual effect of the pellet matrix on the quantification of urea by LC/ ESI-HRMS, the extraction of a urea doped dry pet food sample, which was previ- ously analyzed by EC spectro-colorimetric method (re- sult: 0.46 g/100g), was performed. A sample of 4 grams of ground pellets was doped with respectively 40 and 20 milligrams of pure urea powder and the resulting samples analysis at 1% urea (Chromatogram A) and 0.5% (Chro- matogram B) are shown Figure 4. Time 2.202.402.602.803.003.203.403.603.80 % 0 100 2.202.402.602.803.003.203.403.603.80 % 0 100 2.202.402.602.803.003.203.403.603.80 % 0 100 2.202.402.602.803.003.203.403.603.80 % 0 100 2.202.402.602.803.003.203.403.603.80 % 0 100 2.202.402.602.803.003.203.403.603.80 % 0 100 UREE-TEMOIN-005-070710-b Sm (SG, 3x20)TOF MS ES+ 143.05 150PPM 1.76 Area 2.89;0.14 UREE-TEMOIN-01-070710-b Sm (SG, 3x20)TOF MS ES+ 143.05 150PPM 3.25 Area 2.86;0.32 UREE-TEMOIN-02-070710-a Sm (SG, 3x20)TOF MS ES+ 143.05 150PPM 4.54 Area 2.86;0.50 UREE-TEMOIN-03-070710-a Sm (SG, 3x20)TOF MS ES+ 143.05 150PPM 5.58 Area 2.86;0.71 UREE-TEMOIN-04-070710-a Sm (SG, 3x20)TOF MS ES+ 143.05 150PPM 6.99 Area 2.87;0.98 UREE-TEMOIN-05-070710-b Sm (SG, 3x20)TOF MS ES+ 143.05 150PPM 9.84 Area 2.87;1.25 Figure 2. LC/ESI-HRMS analysis of urea standard solu- tions at 0.2, 0.4, 0.8, 1.2, 1.6 and 2 mg/100mL (respectively chromatogram from top to bottom; integration of urea peak at 143.05 (m/z) and 2.86 min (Rt)). 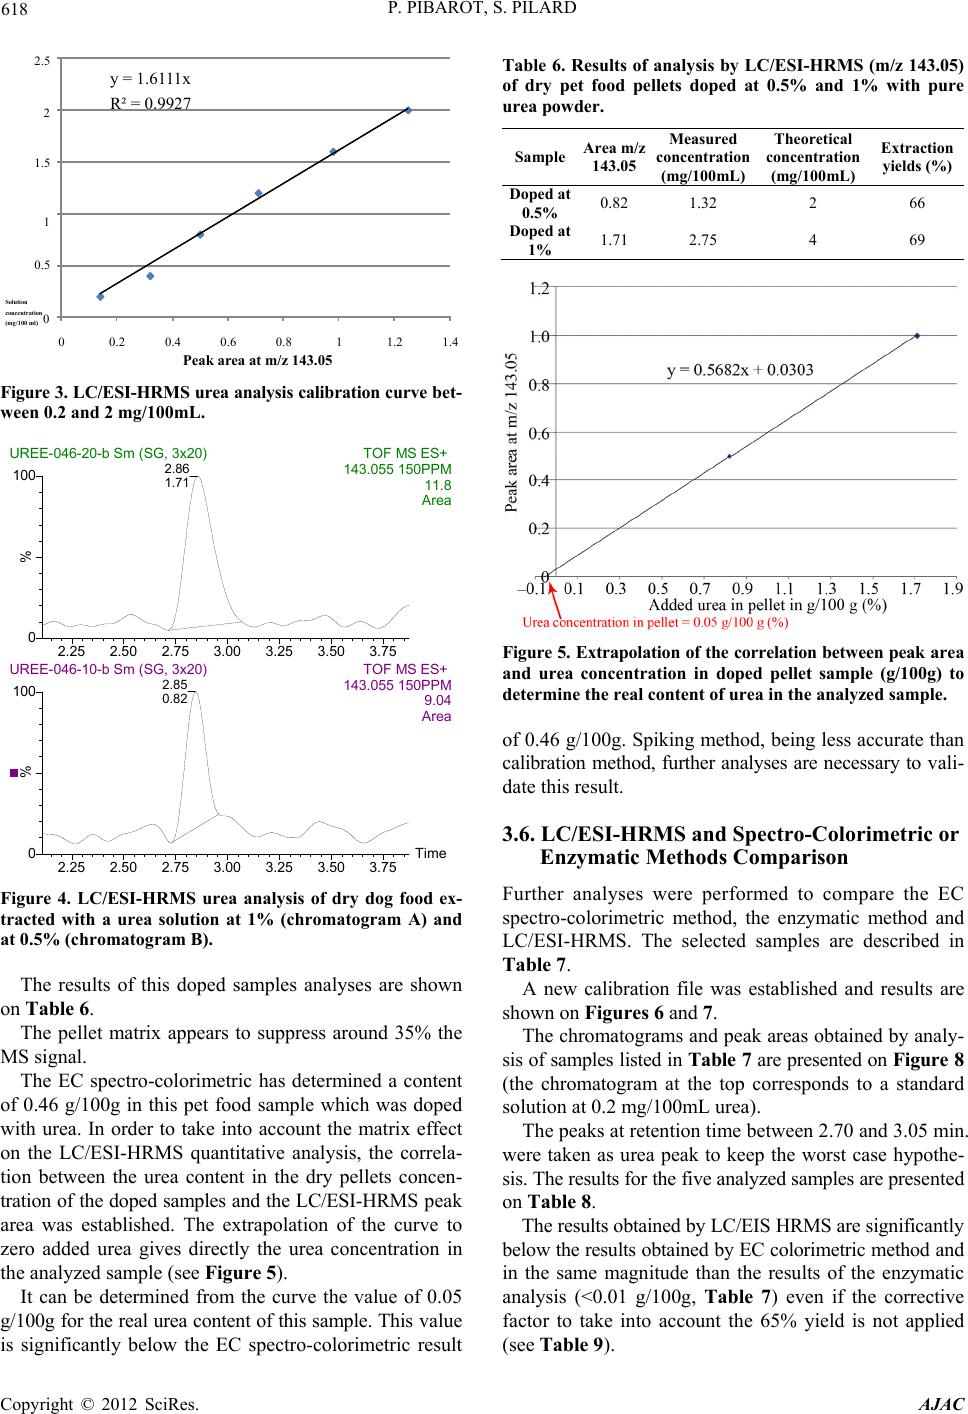 P. PIBAROT, S. PILARD Copyright © 2012 SciRes. AJAC 618 y = 1.6111x R² = 0.9927 0 0.5 1 1.5 2 2.5 0 0.2 0.4 0.60.8 1 1.21.4 Solution concentration (mg/100 ml) Peak area at m/z 143.05 Figure 3. LC/ESI-HRMS urea analysis calibration curve bet- ween 0.2 and 2 mg/100mL. Time 2.252.502.753.003.253.503.75 % 0 100 2.252.502.753.003.253.503.75 % 0 100 UREE-046-20-b Sm (SG, 3x20)TOF MS ES+ 143.055 150PPM 11.8 Area 2.86 1.71 UREE-046-10-b Sm (SG, 3x20)TOF MS ES+ 143.055 150PPM 9.04 Area 2.85 0.82 Figure 4. LC/ESI-HRMS urea analysis of dry dog food ex- tracted with a urea solution at 1% (chromatogram A) and at 0.5% (chromatogram B). The results of this doped samples analyses are shown on Table 6. The pellet matrix appears to suppress around 35% the MS signal. The EC spectro-colorimetric has determined a content of 0.46 g/100g in this pet food sample which was doped with urea. In order to take into account the matrix effect on the LC/ESI-HRMS quantitative analysis, the correla- tion between the urea content in the dry pellets concen- tration of the doped samples and the LC/ESI-HRMS peak area was established. The extrapolation of the curve to zero added urea gives directly the urea concentration in the analyzed sample (see Figure 5). It can be determined from the curve the value of 0.05 g/100g for the real urea content of this sample. This value is significantly below the EC spectro-colorimetric result Table 6. Results of analysis by LC/ESI-HRMS (m/z 143.05) of dry pet food pellets doped at 0.5% and 1% with pure urea powder. Sample Area m/z 143.05 Measured concentration (mg/100mL) Theoretical concentration (mg/100mL) Extraction yields (%) Doped at 0.5% 0.82 1.32 2 66 Doped at 1% 1.71 2.75 4 69 Figure 5. Extrapolation of the correlation between peak area and urea concentration in doped pellet sample (g/100g) to determine the real content of urea in the analyzed sample. of 0.46 g/100g. Spiking method, being less accurate than calibration method, further analyses are necessary to vali- date this result. 3.6. LC/ESI-HRMS and Spectro-Colorimetric or Enzymatic Methods Comparison Further analyses were performed to compare the EC spectro-colorimetric method, the enzymatic method and LC/ESI-HRMS. The selected samples are described in Table 7. A new calibration file was established and results are shown on Figures 6 and 7. The chromatograms and peak areas obtained by analy- sis of samples listed in Table 7 are presented on Figure 8 (the chromatogram at the top corresponds to a standard solution at 0.2 mg/100mL urea). The peaks at retention time between 2.70 and 3.05 min. were taken as urea peak to keep the worst case hypothe- sis. The results for the five analyzed samples are presented on Table 8. The results obtained by LC/EIS HRMS are significantly below the results obtained by EC colorimetric method and in the same magnitude than the results of the enzymatic analysis (<0.01 g/100g, Table 7) even if the corrective factor to take into account the 65% yield is not applied (see Table 9). 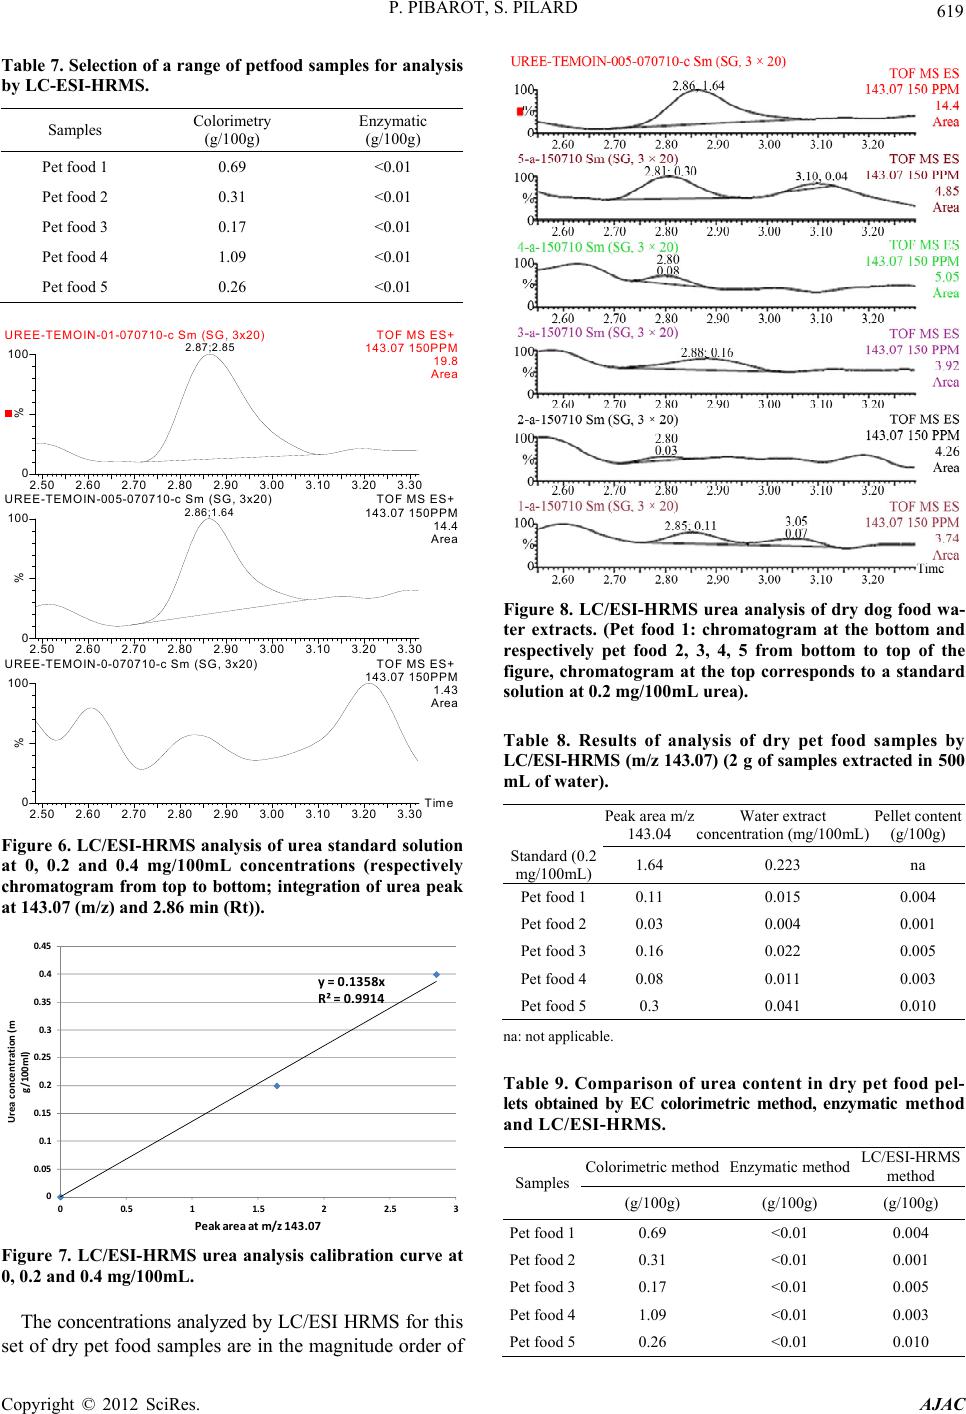 P. PIBAROT, S. PILARD Copyright © 2012 SciRes. AJAC 619 Table 7. Selection of a range of petfood samples for analysis by LC-ESI-HRMS. Samples Colorimetry (g/100g) Enzymatic (g/100g) Pet food 1 0.69 <0.01 Pet food 2 0.31 <0.01 Pet food 3 0.17 <0.01 Pet food 4 1.09 <0.01 Pet food 5 0.26 <0.01 Time 2.502.602.702.802.903.003.103.203.30 % 0 100 2.502.602.702.802.903.003.103.203.30 % 0 100 2.502.602.702.802.903.003.103.203.30 % 0 100 UREE-TEMOIN-01-070710-c Sm (SG, 3x20)TOF MS ES+ 143.07 150PPM 19.8 Area 2.87;2.85 UREE-TEMOIN-005-070710-c Sm (SG, 3x20)TOF MS ES+ 143.07 150PPM 14.4 Area 2.86;1.64 UREE-TEMOIN-0-070710-c Sm (SG, 3x20)TOF MS ES+ 143.07 150PPM 1.43 Area Figure 6. LC/ESI-HRMS analysis of urea standard solution at 0, 0.2 and 0.4 mg/100mL concentrations (respectively chromatogram from top to bottom; integration of urea peak at 143.07 (m/z) and 2.86 min (Rt)). y=0.1358x R²=0.9914 0 0.05 0.1 0.15 0.2 0.25 0.3 0.35 0.4 0.45 00.511.522.53 Ureaconcentration(m g/100ml) Peakareaatm/z143.07 Figure 7. LC/ESI-HRMS urea analysis calibration curve at 0, 0.2 and 0.4 mg/100mL. The concentrations analyzed by LC/ESI HRMS for this set of dry pet food samples are in the magnitude order of Figure 8. LC/ESI-HRMS urea analysis of dry dog food wa- ter extracts. (Pet food 1: chromatogram at the bottom and respectively pet food 2, 3, 4, 5 from bottom to top of the figure, chromatogram at the top corresponds to a standard solution at 0.2 mg/100mL urea). Table 8. Results of analysis of dry pet food samples by LC/ESI-HRMS (m/z 143.07) (2 g of samples extracted in 500 mL of water). Peak area m/z 143.04 Water extract concentration (mg/100mL) Pellet content (g/100g) Standard (0.2 mg/100mL) 1.64 0.223 na Pet food 1 0.11 0.015 0.004 Pet food 2 0.03 0.004 0.001 Pet food 3 0.16 0.022 0.005 Pet food 4 0.08 0.011 0.003 Pet food 5 0.3 0.041 0.010 na: not applicable. Table 9. Comparison of urea content in dry pet food pel- lets obtained by EC colorimetric method, enzymatic method and LC/ESI-HRMS. Colorimetric methodEnzymatic method LC/ESI-HRMS method Samples (g/100g) (g/100g) (g/100g) Pet food 10.69 <0.01 0.004 Pet food 20.31 <0.01 0.001 Pet food 30.17 <0.01 0.005 Pet food 41.09 <0.01 0.003 Pet food 50.26 <0.01 0.010 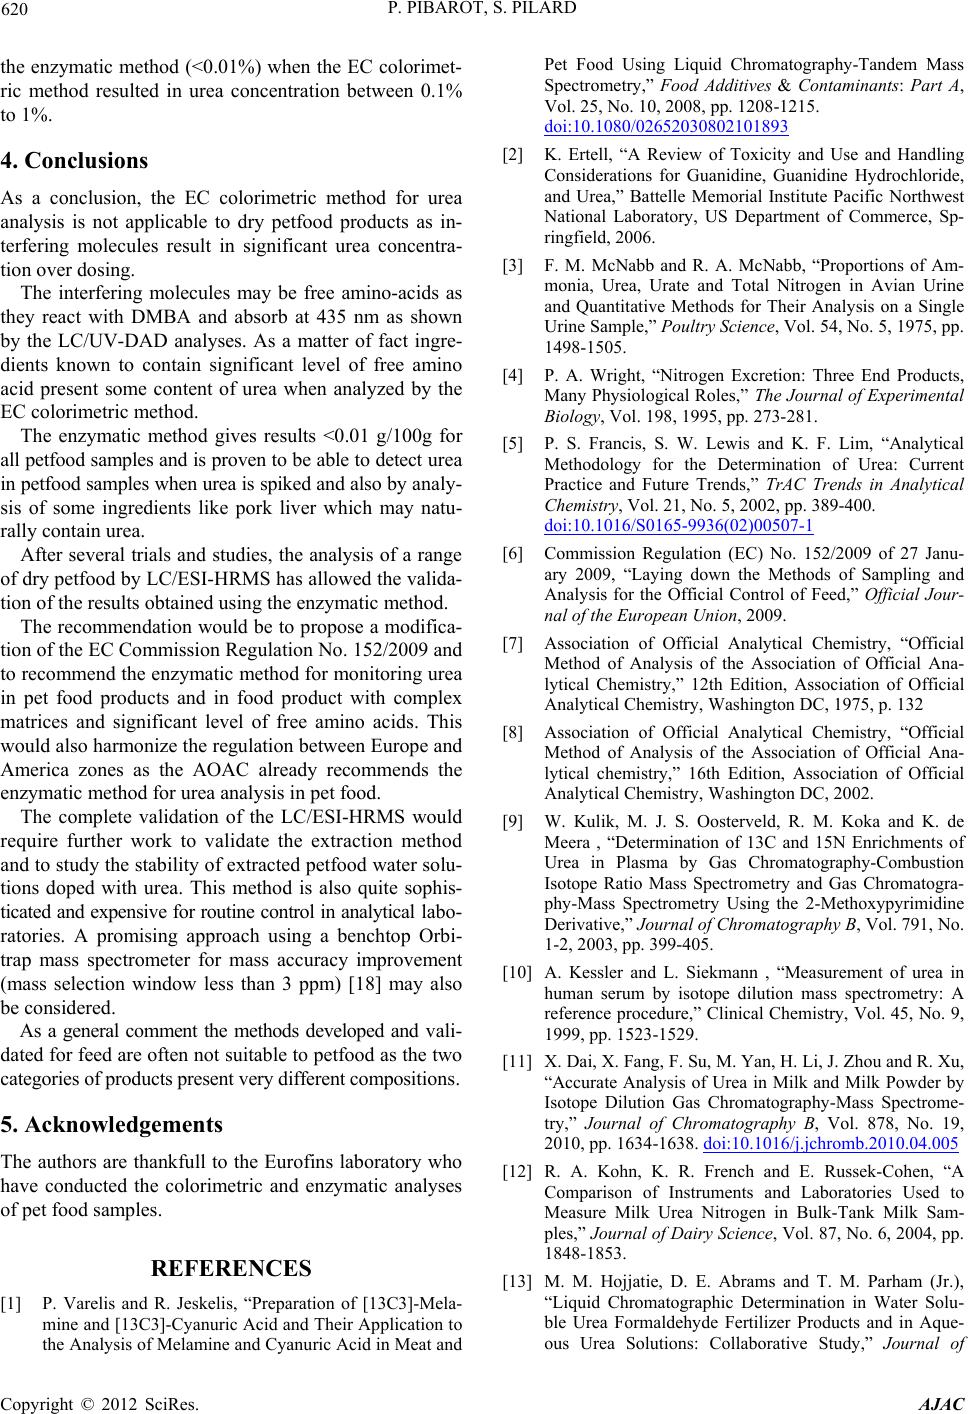 P. PIBAROT, S. PILARD Copyright © 2012 SciRes. AJAC 620 the enzymatic method (<0.01%) when the EC colorimet- ric method resulted in urea concentration between 0.1% to 1%. 4. Conclusions As a conclusion, the EC colorimetric method for urea analysis is not applicable to dry petfood products as in- terfering molecules result in significant urea concentra- tion over dosing. The interfering molecules may be free amino-acids as they react with DMBA and absorb at 435 nm as shown by the LC/UV-DAD analyses. As a matter of fact ingre- dients known to contain significant level of free amino acid present some content of urea when analyzed by the EC colorimetric method. The enzymatic method gives results <0.01 g/100g for all petfood samples and is proven to be able to detect urea in petfood samples when urea is spiked and also by analy- sis of some ingredients like pork liver which may natu- rally contain urea. After several trials and studies, the analysis of a range of dry petfood by LC/ESI-HRMS has allowed the valida- tion of the results obtained using the enzymatic method. The recommendation would be to propose a modifica- tion of the EC Commission Regulation No. 152/2009 and to recommend the enzymatic method for monitoring urea in pet food products and in food product with complex matrices and significant level of free amino acids. This would also harmonize the regulation between Europe and America zones as the AOAC already recommends the enzymatic method for urea analysis in pet food. The complete validation of the LC/ESI-HRMS would require further work to validate the extraction method and to study the stability of extracted petfood water solu- tions doped with urea. This method is also quite sophis- ticated and expensive for routine control in analytical labo- ratories. A promising approach using a benchtop Orbi- trap mass spectrometer for mass accuracy improvement (mass selection window less than 3 ppm) [18] may also be considered. As a general comment the methods developed and vali- dated for feed are often not suitable to petfood as the two categories of products present very different compositions. 5. Acknowledgements The authors are thankfull to the Eurofins laboratory who have conducted the colorimetric and enzymatic analyses of pet food samples. REFERENCES [1] P. Varelis and R. Jeskelis, “Preparation of [13C3]-Mela- mine and [13C3]-Cyanuric Acid and Their Application to the Analysis of Melamine and Cyanuric Acid in Meat and Pet Food Using Liquid Chromatography-Tandem Mass Spectrometry,” Food Additives & Contaminants: Part A, Vol. 25, No. 10, 2008, pp. 1208-1215. doi:10.1080/02652030802101893 [2] K. Ertell, “A Review of Toxicity and Use and Handling Considerations for Guanidine, Guanidine Hydrochloride, and Urea,” Battelle Memorial Institute Pacific Northwest National Laboratory, US Department of Commerce, Sp- ringfield, 2006. [3] F. M. McNabb and R. A. McNabb, “Proportions of Am- monia, Urea, Urate and Total Nitrogen in Avian Urine and Quantitative Methods for Their Analysis on a Single Urine Sample,” Poultry Science, Vol. 54, No. 5, 1975, pp. 1498-1505. [4] P. A. Wright, “Nitrogen Excretion: Three End Products, Many Physiological Roles,” The Journal of Experimental Biology, Vol. 198, 1995, pp. 273-281. [5] P. S. Francis, S. W. Lewis and K. F. Lim, “Analytical Methodology for the Determination of Urea: Current Practice and Future Trends,” TrAC Trends in Analytical Chemistry, Vol. 21, No. 5, 2002, pp. 389-400. doi:10.1016/S0165-9936(02)00507-1 [6] Commission Regulation (EC) No. 152/2009 of 27 Janu- ary 2009, “Laying down the Methods of Sampling and Analysis for the Official Control of Feed,” Official Jour- nal of the European Union, 2009. [7] Association of Official Analytical Chemistry, “Official Method of Analysis of the Association of Official Ana- lytical Chemistry,” 12th Edition, Association of Official Analytical Chemistry, Washington DC, 1975, p. 132 [8] Association of Official Analytical Chemistry, “Official Method of Analysis of the Association of Official Ana- lytical chemistry,” 16th Edition, Association of Official Analytical Chemistry, Washington DC, 2002. [9] W. Kulik, M. J. S. Oosterveld, R. M. Koka and K. de Meera , “Determination of 13C and 15N Enrichments of Urea in Plasma by Gas Chromatography-Combustion Isotope Ratio Mass Spectrometry and Gas Chromatogra- phy-Mass Spectrometry Using the 2-Methoxypyrimidine Derivative,” Journal of Chromatography B, Vol. 791, No. 1-2, 2003, pp. 399-405. [10] A. Kessler and L. Siekmann , “Measurement of urea in human serum by isotope dilution mass spectrometry: A reference procedure,” Clinical Chemistry, Vol. 45, No. 9, 1999, pp. 1523-1529. [11] X. Dai, X. Fang, F. Su, M. Yan, H. Li, J. Zhou and R. Xu, “Accurate Analysis of Urea in Milk and Milk Powder by Isotope Dilution Gas Chromatography-Mass Spectrome- try,” Journal of Chromatography B, Vol. 878, No. 19, 2010, pp. 1634-1638. doi:10.1016/j.jchromb.2010.04.005 [12] R. A. Kohn, K. R. French and E. Russek-Cohen, “A Comparison of Instruments and Laboratories Used to Measure Milk Urea Nitrogen in Bulk-Tank Milk Sam- ples,” Journal of Dairy Science, Vol. 87, No. 6, 2004, pp. 1848-1853. [13] M. M. Hojjatie, D. E. Abrams and T. M. Parham (Jr.), “Liquid Chromatographic Determination in Water Solu- ble Urea Formaldehyde Fertilizer Products and in Aque- ous Urea Solutions: Collaborative Study,” Journal of  P. PIBAROT, S. PILARD Copyright © 2012 SciRes. AJAC 621 AOAC International, Vol. 87, No. 2, 2004, pp. 346-351. [14] M. Koebel and M. Elsener, “Determination of Urea and Its Thermal Decomposition Products by High-Perfor- mance Liquid Chromatography,” Journal of Chromatog- raphy A, Vol. 689, No. 1, 1995, pp. 164-169. doi:10.1016/0021-9673(94)00922-V [15] Macherey Nagel Application Note 120440, “Separation of Urea, Biuret and Cyanuric Acid (Courtesy of C. Greve),” University of Clausthal, Institute of Chemical Engineering, Clausthal, 2005. [16] H. Abidi, J. L. Gass and M. F. Grenier-Loustalot, “Ana- lyse Quantitative de l’Urée dans l’Eau par HPLC-APCI- MS-MS et HPLC-ES-MS-MS,” L’Actualité Chimique, No. 4, 2001, pp. 33-36. [17] H. R. Morris, T. Paxton, A. Dell, J. Langhorne, M. Berg, R. S. Bordoli, J. Hoyes and R. H Bateman, “High Sensi- tivity Collisionally-Activated Decomposition Tandem Mass Spectrometry on a Novel Quadrupole/Orthogonal- Acceleration Time-of-Flight Mass Spectrometer,” Rapid Communications in Mass Spectrometry, Vol. 10, No. 8, 1996, pp. 889-896. [18] J. V. Olsen, L. M. F. de Godoy, G. Li, B. Macek, P. Mortensen, R. Pesch, A. Makarov, O. Lange, S. Horning and M. Mann, “Parts per Million Mass Accuracy on an Orbitrap Mass Spectrometer via Lock Mass Injection into a C-Trap,” Molecular & Cellular Proteomics, Vol. 4, No. 12, 2005, pp. 2010-2021. |