

Paper Menu >>
Journal Menu >>
 Vol.2, No.7, 741-747 (2010) Natural Science http://dx.doi.org/10.4236/ns.2010.27093 Copyright © 2010 SciRes. OPEN ACCESS Comparison of factor loadings for anthropometric and physiometric measures among type 2 diabetic males, pre- and post-menopausal females in North Indian Punjabi population Badaruddoza*, Basanti Barna, Amarjit Singh Bhanwer Department of Human Genetics, Guru Nanak Dev University, Amritsar, India; *Corresponding Author: [email protected] Received 10 April 2010; revised 18 May 2010; accepted 23 May 2010. ABSTRACT Background: The objective of the present study was to compare the relationship of anthropom- etric and physiometric characteristics using principal component factor analysis among three groups of type 2 diabetic subjects such as males, pre- and post-menopausal females in North Indian Punjabi population. Method: A total of 349 type 2 diabetic subjects (males 157; fe- males 192; 88 pre- and 104 post-menopausal) were ascertained for the present study. Different anthropometric and physiometric measure- ments were taken. Principal component factor analysis (PCFA) was applied to identify the components which are more close to type 2 diabetes among the three groups. Results: PCFA revealed five uncorrelated components which explained 79% of the total variance among diabetic males and six unrelated com- ponents which explained 78% of the total vari- ance among pre- and post-menopausal females. The important two factors could be identified as central obesity (factor 1) and blood pressure (factor 2) among these three groups. Conclu- sion: Higher clustering of obesity and blood pressures were found in diabetic males as com- pared to pre- and post-menopausal diabetic females in North Indian Punjabi population whereas, waist to hip ratio (WHR) has maximum loading in post-menopausal females as com- pared to others. Keywords: Factor Analysis; Blood Pressure; Type 2 Diabetes; Anthropometry; Punjabi Population 1. INTRODUCTION The relationships between type 2 diabetes mellitus (T2DM), anthropometric variables and blood pressures are statistically complex [1,2]. Strong inter-correlation between anthropometric and physiometric variables cre- ates complexities in the analysis and interpretation of independent associations of these variables with the de- velopment of type 2 diabetes. Principal Component Factor Analysis (PCFA) is the technique to reduce a large number of variables to a smaller number of factors which are more closely associated with antecedent [2-4]. The objective of the present study using principal com- ponent factor analysis is to compare the relationship between anthropometric and physiometric components with diabetic males, pre- and post-meno-pausal females in North Indian Punjabi population. The attention has also been given to find out which factors can be used as significant predictors of T2DM. 2. MATERIALS AND METHODS Present study was conducted at the different clinical centres such as Heart Station and Diabetic Clinic, A.P. Hospital and Heart Care Centre, Diabetic Clinic and Research Institute in Amritsar district in the state of Punjab among Punjabi population. Punjabi population may be defined as similar genotype groupings and ag- gregate of similar cultural practices, life style pattern, social influence and similar ethnic characteristics with Punjabi language speaking and at least reside in Punjab for the last 20 years. A total of 349 type 2 diabetic indi- viduals participated in the baseline examination for the present study which occurred from October 2008 to September 2009. Among total individuals 157 and 192 are males and females respectively whereas, among fe- males 88 and 104 are pre- and post-menopausal. All par- ticipants provided written informed consent. 2.1. Anthropometric Measurements Actual age and age on the onset of the disease were re- corded from the subject’s health card provided by the  Badaruddoza et al. / Natural Science 2 (2010) 741-747 Copyright © 2010 SciRes. OPEN ACCESS 742 clinical centres. Height, weight, circumferences of waist (WC), hip (HC), arm (AC) and Calf (CC) and four skin fold thickness (biceps, triceps, sub-scapular and su- pra-iliac) were taken by female author on each individ- ual using standard anthropometric techniques and tools [5,6]. Height and weight were measured to the nearest 0.5 cm and 0.1 kg respectively. Body mass index (BMI) was calculated for an estimate of overall adiposity using the formula: BMI = weight (kg)/height (m2). Waist and Hip circumference (WC and HC) for an estimate of cen- tral obesity [7] were measured to the nearest 0.5 cm with a steel tape. Waist to hip ratio (WHR) was calculated using the standard formula: WHR = WC (cm)/HC (cm). A Lange skinfold calliper was used to measure the skin- folds to the nearest 0.2 mm. Two subsequent measure- ments were taken and averages were used in the analysis. 2.2. Physiometric Measurements Left arm blood pressures (first phase systolic and fifth phase diastolic) were taken from each participant with standard mercury sphygmomanometer after a 5 min rest. The average of the two subsequent measurements was used for analysis. All efforts were made to minimize the factors which affect the blood pressure like anxiety, fear, stress, laughing and recent activity [8]. Mean arterial blood pressure (MBP) was calculated for each of the two readings taken for SBP and DBP by using the formula: MBP = SBP + (SBP-DBP)/3 [9]. The radial artery at the wrist was used to count the pulse. It was counted over one minute. The difference of SBP and DBP was used as pulse pressure. 3. STATISTICAL ANALYSIS Descriptive statistics such as means, standard deviations and coefficient of skewness were calculated for all vari- ables. All statistical analysis including factor analyses were conducted by SPSS (Statistical Package for Social Sciences, version 17.0, SPSS Inc. USA). Each of the anthropometric and physiometric variables is highly inter-correlated with each others and creates a methodo- logical problem for analysis the data. PCFA is used when variables are highly correlated and this multivariate sta- tistical tool able to reduce a large number of inter-corre- lated variables to a smaller number of principal compo- nents which account for most of the variance in the data [10,11]. Factor analysis has done on the basis of correla- tion matrix which helps to understand the amount of association between the variables, factor extraction and orthogonal rotation to make factors easily interpretable. Hence, PCFA was used to extract uncorrelated factors and varimax rotation, which is an orthogonal rotation in which the factors are assumed to act independently, was used in the present study. Factor loadings were equiva- lent to the correlation coefficients between the variables (rows) and factors (columns). The final factors pattern was interpreted using factor loadings of ≥ 0.4. Extracted factors or number of factors to be retained was based on eigenvalue criteria ≥ 1.0. Eigenvalues indicate the amount of variance explained by each factor. A factor with low eigenvalue has a little contribution to explain the variances in the variables and may be ignored. The first and second principal components were identified through largest and second largest amount of variance in the data and so on. Communality is the squared multiple correlation for the variable (as dependent) using as pre- dictors. Hence, the communality estimates is the meas- ure the percent of variance in a given variable explained by all factors. A communality of 0.75 and 0.25 consid- ered large and low respectively. Low communality indi- cates variables are negligibly related to each other. The probability values less than or equal to 0.05 (two-tailed) were considered to be significant. 4. RESULTS Table 1 presents the mean, standard deviation (SD) and skewness of anthropometric and physiometric variables. All right skewed distributions have converted to a nor- mal distribution by square root transformation whereas; reciprocal transformation is used for left skewed distri- bution among type 2 diabetic males, pre- and post- menopausal females. The highest mean age for onset of T2DM was found among post-menopausal females (52.46 ± 6.22years) and the lowest mean age for the on- set of disease was found among pre-menopausal females (36.97 ± 5.96 years) as compared to males (45.19 ± 7.79 years). The other highest mean values of important an- thropometric indicator such as BMI, hip circumference, biceps skinfold, triceps skinfold and arm circumference were found among diabetic post-menopausal females as compared to males and pre-menopausal females. The diabetic males have higher mean values for WHR and waist circumference. The physiometric variables such as SBP, DBP, pulse rate and pulse pressure have not shown any specific trend among three groups of diabetic sub- jects. Bivariate correlations of the traits were examined among type 2 diabetic males, pre- and post-menopausal females and are presented in Tables 2 to 4. Waist cir- cumference, hip circumference, biceps skinfold, triceps skinfold, arm circumference and calf circumference with Weight and BMI; hip circumference, biceps skinfold, triceps skinfold, arm circumference and calf circumfer- ence with waist circumference have been found signifi- 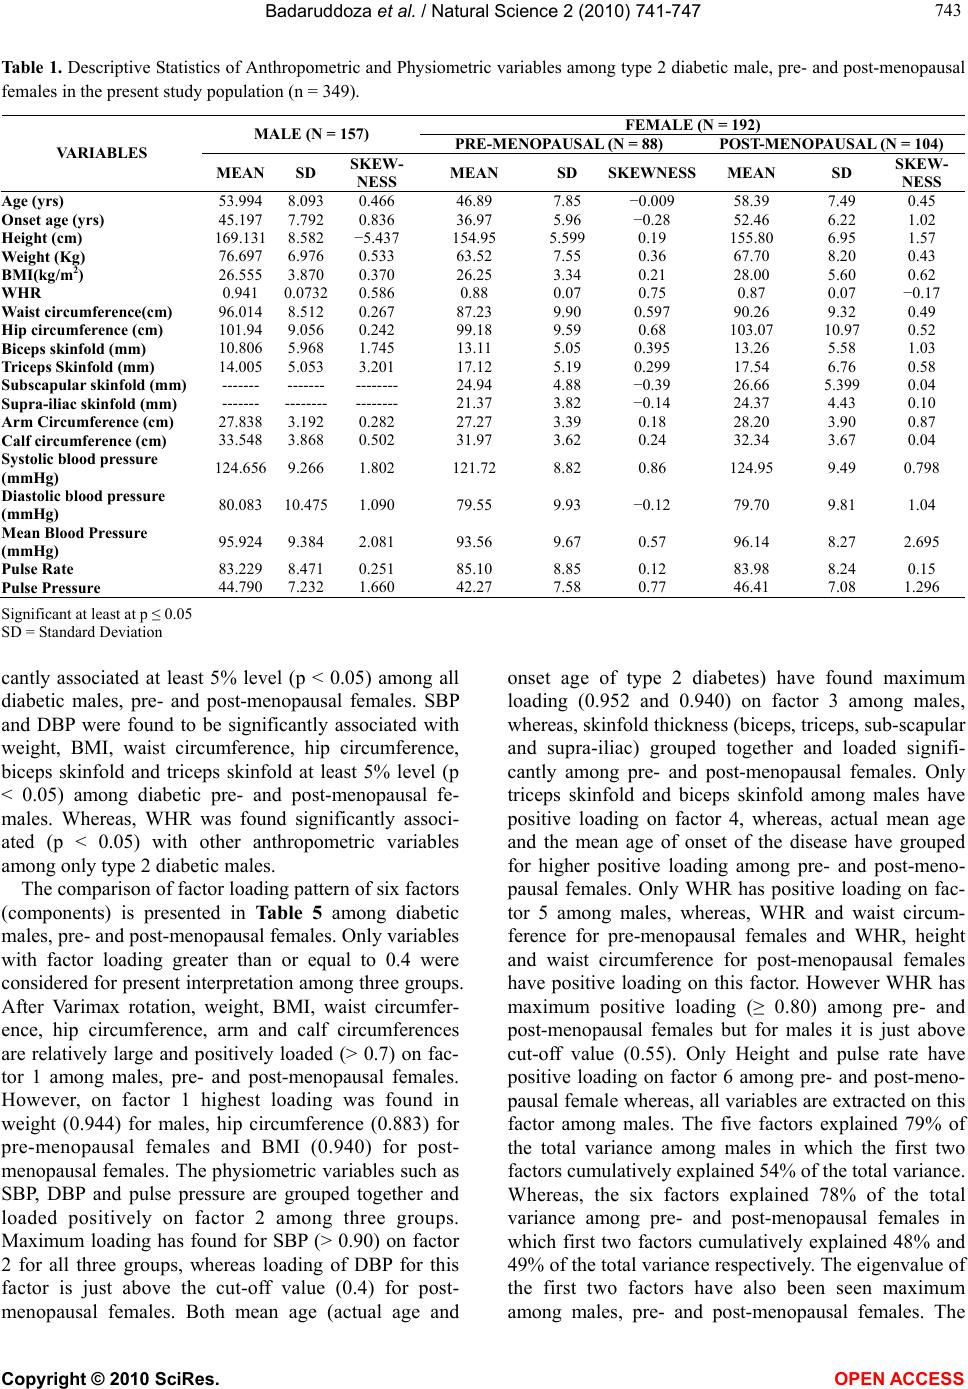 Badaruddoza et al. / Natural Science 2 (2010) 741-747 Copyright © 2010 SciRes. OPEN ACCESS 743 743 Table 1. Descriptive Statistics of Anthropometric and Physiometric variables among type 2 diabetic male, pre- and post-menopausal females in the present study population (n = 349). FEMALE (N = 192) MALE (N = 157) PRE-MENOPAUSAL (N = 88) POST-MENOPAUSAL (N = 104) VARIABLES MEAN SD SKEW- NESS MEAN SD SKEWNESSMEAN SD SKEW- NESS Age (yrs) 53.994 8.093 0.466 46.89 7.85 −0.009 58.39 7.49 0.45 Onset age (yrs) 45.197 7.792 0.836 36.97 5.96 −0.28 52.46 6.22 1.02 Height (cm) 169.131 8.582 −5.437 154.95 5.599 0.19 155.80 6.95 1.57 Weight (Kg) 76.697 6.976 0.533 63.52 7.55 0.36 67.70 8.20 0.43 BMI(kg/m2) 26.555 3.870 0.370 26.25 3.34 0.21 28.00 5.60 0.62 WHR 0.941 0.0732 0.586 0.88 0.07 0.75 0.87 0.07 −0.17 Waist circumference(cm) 96.014 8.512 0.267 87.23 9.90 0.597 90.26 9.32 0.49 Hip circumference (cm) 101.94 9.056 0.242 99.18 9.59 0.68 103.07 10.97 0.52 Biceps skinfold (mm) 10.806 5.968 1.745 13.11 5.05 0.395 13.26 5.58 1.03 Triceps Skinfold (mm) 14.005 5.053 3.201 17.12 5.19 0.299 17.54 6.76 0.58 Subscapular skinfold (mm) ------- ------- -------- 24.94 4.88 −0.39 26.66 5.399 0.04 Supra-iliac skinfold (mm) ------- -------- -------- 21.37 3.82 −0.14 24.37 4.43 0.10 Arm Circumference (cm) 27.838 3.192 0.282 27.27 3.39 0.18 28.20 3.90 0.87 Calf circumference (cm) 33.548 3.868 0.502 31.97 3.62 0.24 32.34 3.67 0.04 Systolic blood pressure (mmHg) 124.656 9.266 1.802 121.72 8.82 0.86 124.95 9.49 0.798 Diastolic blood pressure (mmHg) 80.083 10.475 1.090 79.55 9.93 −0.12 79.70 9.81 1.04 Mean Blood Pressure (mmHg) 95.924 9.384 2.081 93.56 9.67 0.57 96.14 8.27 2.695 Pulse Rate 83.229 8.471 0.251 85.10 8.85 0.12 83.98 8.24 0.15 Pulse Pressure 44.790 7.232 1.660 42.27 7.58 0.77 46.41 7.08 1.296 Significant at least at p ≤ 0.05 SD = Standard Deviation cantly associated at least 5% level (p < 0.05) among all diabetic males, pre- and post-menopausal females. SBP and DBP were found to be significantly associated with weight, BMI, waist circumference, hip circumference, biceps skinfold and triceps skinfold at least 5% level (p < 0.05) among diabetic pre- and post-menopausal fe- males. Whereas, WHR was found significantly associ- ated (p < 0.05) with other anthropometric variables among only type 2 diabetic males. The comparison of factor loading pattern of six factors (components) is presented in Table 5 among diabetic males, pre- and post-menopausal females. Only variables with factor loading greater than or equal to 0.4 were considered for present interpretation among three groups. After Varimax rotation, weight, BMI, waist circumfer- ence, hip circumference, arm and calf circumferences are relatively large and positively loaded (> 0.7) on fac- tor 1 among males, pre- and post-menopausal females. However, on factor 1 highest loading was found in weight (0.944) for males, hip circumference (0.883) for pre-menopausal females and BMI (0.940) for post- menopausal females. The physiometric variables such as SBP, DBP and pulse pressure are grouped together and loaded positively on factor 2 among three groups. Maximum loading has found for SBP (> 0.90) on factor 2 for all three groups, whereas loading of DBP for this factor is just above the cut-off value (0.4) for post- menopausal females. Both mean age (actual age and onset age of type 2 diabetes) have found maximum loading (0.952 and 0.940) on factor 3 among males, whereas, skinfold thickness (biceps, triceps, sub-scapular and supra-iliac) grouped together and loaded signifi- cantly among pre- and post-menopausal females. Only triceps skinfold and biceps skinfold among males have positive loading on factor 4, whereas, actual mean age and the mean age of onset of the disease have grouped for higher positive loading among pre- and post-meno- pausal females. Only WHR has positive loading on fac- tor 5 among males, whereas, WHR and waist circum- ference for pre-menopausal females and WHR, height and waist circumference for post-menopausal females have positive loading on this factor. However WHR has maximum positive loading (≥ 0.80) among pre- and post-menopausal females but for males it is just above cut-off value (0.55). Only Height and pulse rate have positive loading on factor 6 among pre- and post-meno- pausal female whereas, all variables are extracted on this factor among males. The five factors explained 79% of the total variance among males in which the first two factors cumulatively explained 54% of the total variance. Whereas, the six factors explained 78% of the total variance among pre- and post-menopausal females in which first two factors cumulatively explained 48% and 49% of the total variance respectively. The eigenvalue of the first two factors have also been seen maximum among males, pre- and post-menopausal females. The 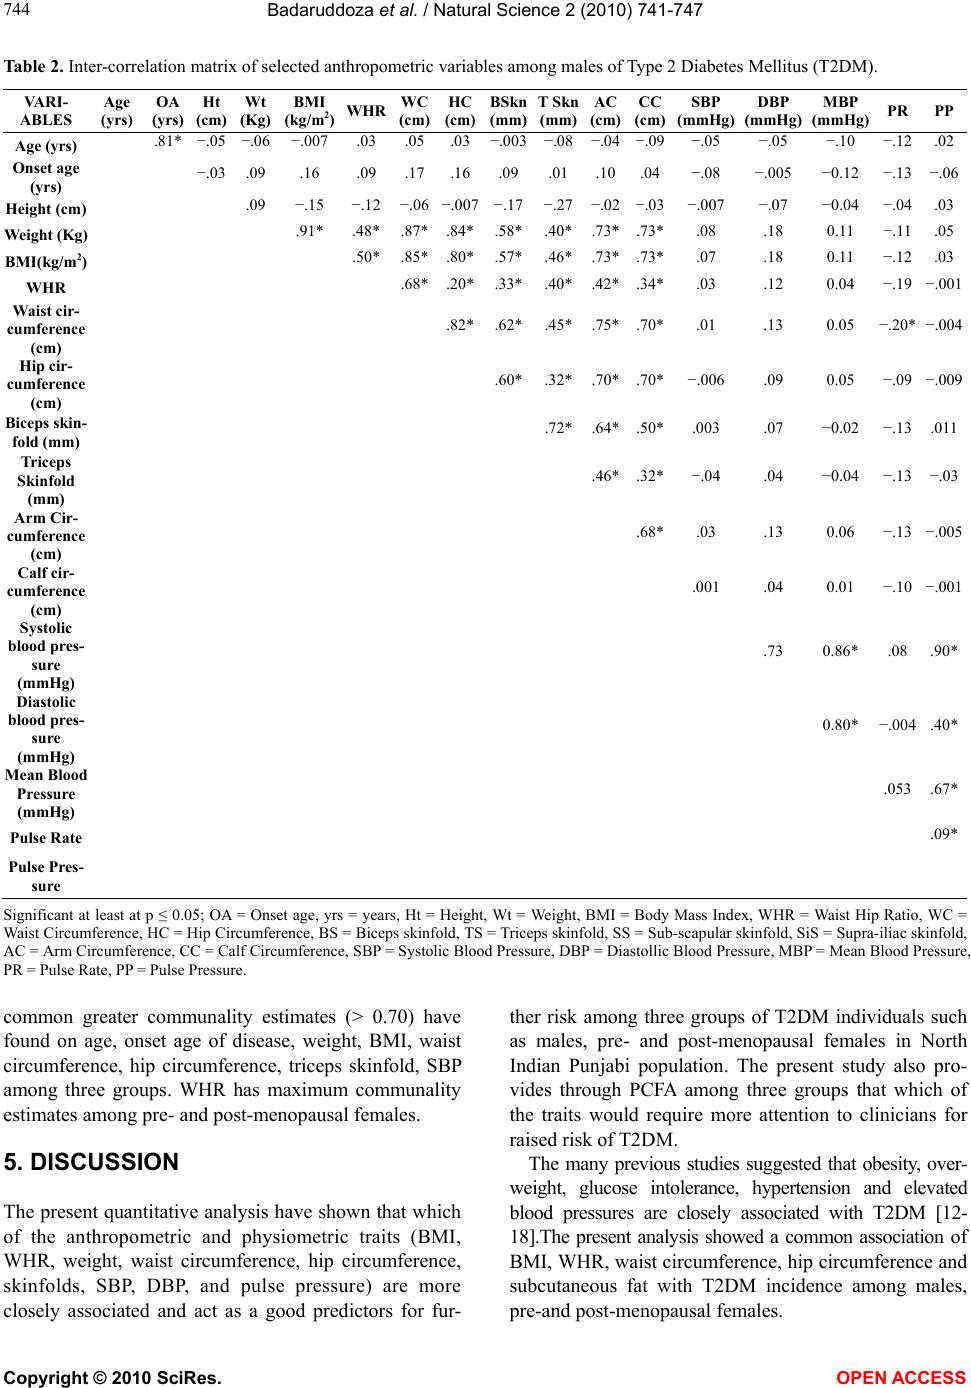 Badaruddoza et al. / Natural Science 2 (2010) 741-747 Copyright © 2010 SciRes. OPEN ACCESS 744 Table 2. Inter-correlation matrix of selected anthropometric variables among males of Type 2 Diabetes Mellitus (T2DM). VARI- ABLES Age (yrs) OA (yrs) Ht (cm) Wt (Kg) BMI (kg/m2) WHR WC (cm) HC (cm) BSkn (mm) T Skn (mm) AC (cm) CC (cm) SBP (mmHg) DBP (mmHg) MBP (mmHg) PR PP Age (yrs) .81* −.05 −.06 −.007 .03 .05.03−.003 −.08 −.04 −.09 −.05 −.05 −.10 −.12 .02 Onset age (yrs) −.03 .09 .16 .09 .17.16.09.01.10.04−.08 −.005 −0.12 −.13 −.06 Height (cm) .09 −.15 −.12 −.06 −.007 −.17 −.27 −.02 −.03 −.007 −.07 −0.04 −.04 .03 Weight (Kg) .91* .48* .87*.84*.58*.40*.73*.73*.08 .18 0.11 −.11 .05 BMI(kg/m2) .50* .85*.80*.57*.46*.73*.73*.07 .18 0.11 −.12 .03 WHR .68*.20*.33*.40*.42*.34*.03 .12 0.04 −.19 −.001 Waist cir- cumference (cm) .82*.62*.45*.75*.70*.01 .13 0.05 −.20* −.004 Hip cir- cumference (cm) .60*.32*.70*.70*−.006.09 0.05 −.09 −.009 Biceps skin- fold (mm) .72*.64*.50*.003 .07 −0.02 −.13 .011 Triceps Skinfold (mm) .46*.32*−.04 .04 −0.04 −.13−.03 Arm Cir- cumference (cm) .68*.03 .13 0.06 −.13 −.005 Calf cir- cumference (cm) .001 .04 0.01 −.10 −.001 Systolic blood pres- sure (mmHg) .73 0.86* .08.90* Diastolic blood pres- sure (mmHg) 0.80* −.004 .40* Mean Blood Pressure (mmHg) .053.67* Pulse Rate .09* Pulse Pres- sure Significant at least at p ≤ 0.05; OA = Onset age, yrs = years, Ht = Height, Wt = Weight, BMI = Body Mass Index, WHR = Waist Hip Ratio, WC = Waist Circumference, HC = Hip Circumference, BS = Biceps skinfold, TS = Triceps skinfold, SS = Sub-scapular skinfold, SiS = Supra-iliac skinfold, AC = Arm Circumference, CC = Calf Circumference, SBP = Systolic Blood Pressure, DBP = Diastollic Blood Pressure, MBP = Mean Blood Pressure, PR = Pulse Rate, PP = Pulse Pressure. common greater communality estimates (> 0.70) have found on age, onset age of disease, weight, BMI, waist circumference, hip circumference, triceps skinfold, SBP among three groups. WHR has maximum communality estimates among pre- and post-menopausal females. 5. DISCUSSION The present quantitative analysis have shown that which of the anthropometric and physiometric traits (BMI, WHR, weight, waist circumference, hip circumference, skinfolds, SBP, DBP, and pulse pressure) are more closely associated and act as a good predictors for fur- ther risk among three groups of T2DM individuals such as males, pre- and post-menopausal females in North Indian Punjabi population. The present study also pro- vides through PCFA among three groups that which of the traits would require more attention to clinicians for raised risk of T2DM. The many previous studies suggested that obesity, over- weight, glucose intolerance, hypertension and elevated blood pressures are closely associated with T2DM [12- 18].The present analysis showed a common association of BMI, WHR, waist circumference, hip circumference and subcutaneous fat with T2DM incidence among males, pre-and post-menopausal females. 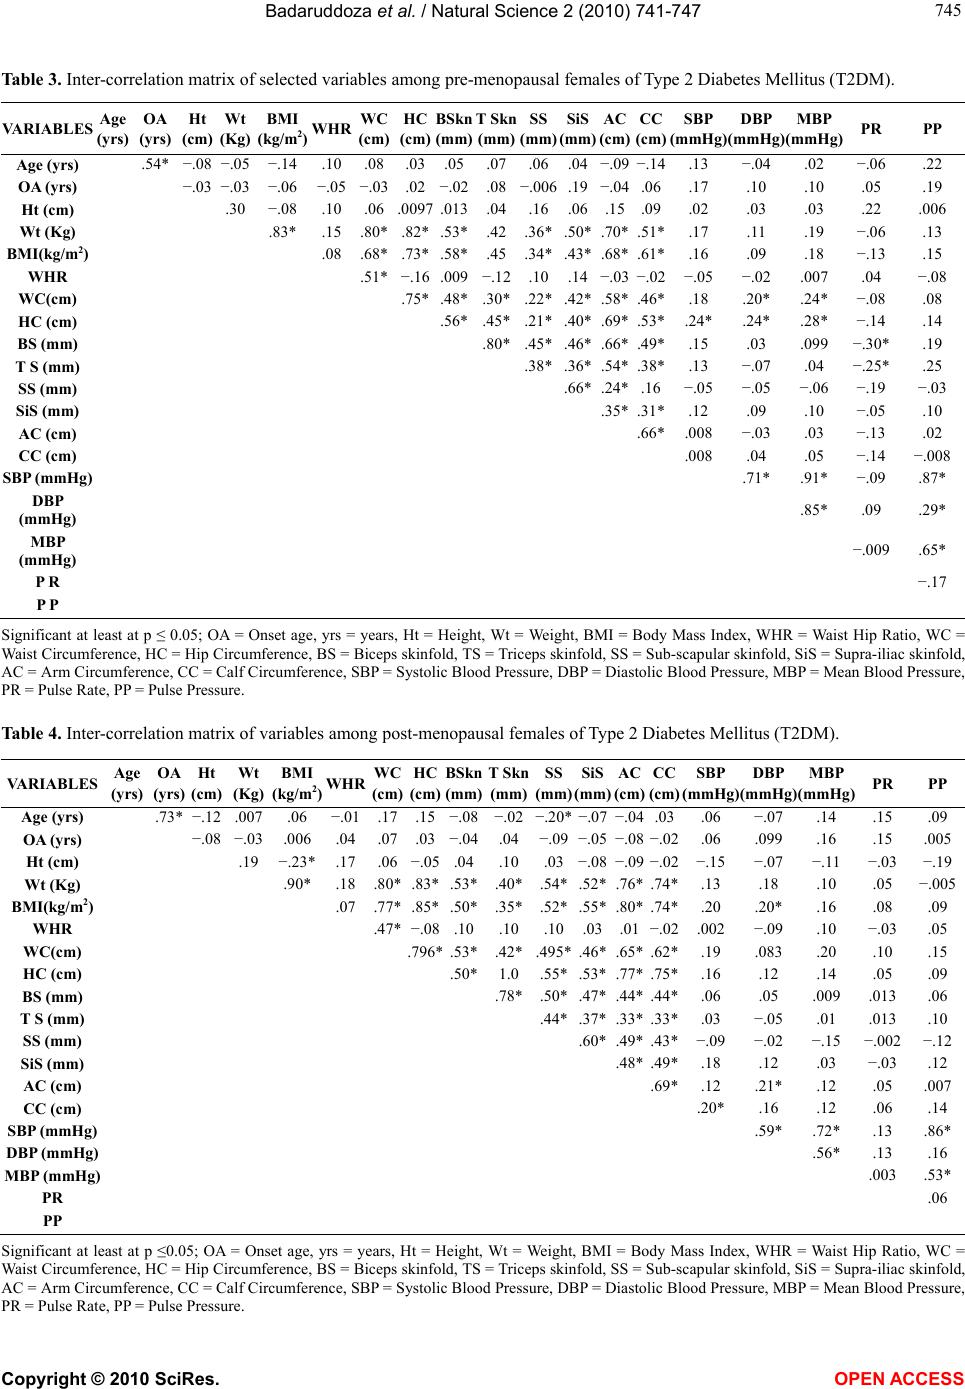 Badaruddoza et al. / Natural Science 2 (2010) 741-747 Copyright © 2010 SciRes. OPEN ACCESS 745 745 Table 3. Inter-correlation matrix of selected variables among pre-menopausal females of Type 2 Diabetes Mellitus (T2DM). VARIABLES Age (yrs) OA (yrs) Ht (cm) Wt (Kg) BMI (kg/m2) WHR WC (cm) HC (cm) BSkn (mm) T Skn (mm) SS (mm) SiS (mm) AC (cm) CC (cm) SBP (mmHg) DBP (mmHg) MBP (mmHg) PR PP Age (yrs) .54* −.08 −.05 −.14 .10 .08.03.05.07.06.04−.09 −.14.13 −.04 .02 −.06.22 OA (yrs) −.03 −.03 −.06 −.05 −.03.02 −.02.08 −.006 .19−.04.06.17 .10 .10 .05 .19 Ht (cm) .30−.08 .10 .06.0097.013.04.16.06.15.09.02 .03 .03 .22 .006 Wt (Kg) .83* .15 .80*.82*.53*.42.36*.50*.70*.51*.17 .11 .19 −.06.13 BMI(kg/m2) .08 .68*.73*.58*.45.34*.43*.68*.61*.16 .09 .18 −.13.15 WHR .51*−.16 .009−.12.10.14 −.03 −.02−.05 −.02 .007 .04 −.08 WC(cm) .75*.48*.30*.22*.42*.58*.46*.18 .20* .24* −.08.08 HC (cm) .56*.45*.21*.40*.69*.53*.24*.24* .28* −.14.14 BS (mm) .80*.45*.46*.66*.49*.15 .03 .099 −.30*.19 T S (mm) .38*.36*.54*.38*.13 −.07 .04 −.25*.25 SS (mm) .66*.24*.16−.05 −.05 −.06 −.19 −.03 SiS (mm) .35*.31*.12 .09 .10 −.05.10 AC (cm) .66*.008−.03 .03 −.13.02 CC (cm) .008.04 .05 −.14 −.008 SBP (mmHg) .71* .91* −.09.87* DBP (mmHg) .85* .09 .29* MBP (mmHg) −.009.65* P R −.17 P P Significant at least at p ≤ 0.05; OA = Onset age, yrs = years, Ht = Height, Wt = Weight, BMI = Body Mass Index, WHR = Waist Hip Ratio, WC = Waist Circumference, HC = Hip Circumference, BS = Biceps skinfold, TS = Triceps skinfold, SS = Sub-scapular skinfold, SiS = Supra-iliac skinfold, AC = Arm Circumference, CC = Calf Circumference, SBP = Systolic Blood Pressure, DBP = Diastolic Blood Pressure, MBP = Mean Blood Pressure, PR = Pulse Rate, PP = Pulse Pressure. Table 4. Inter-correlation matrix of variables among post-menopausal females of Type 2 Diabetes Mellitus (T2DM). VARIABLES Age (yrs) OA (yrs) Ht (cm) Wt (Kg) BMI (kg/m2) WHR WC (cm) HC (cm) BSkn (mm) T Skn (mm) SS (mm) SiS (mm) AC (cm) CC (cm) SBP (mmHg) DBP (mmHg) MBP (mmHg) PR PP Age (yrs) .73* −.12 .007 .06 −.01 .17.15−.08 −.02 −.20* −.07 −.04.03.06 −.07 .14 .15 .09 OA (yrs) −.08 −.03 .006 .04 .07.03−.04 .04 −.09 −.05 −.08 −.02.06 .099 .16 .15 .005 Ht (cm) .19 −.23* .17 .06−.05.04 .10 .03−.08 −.09 −.02 −.15 −.07 −.11 −.03 −.19 Wt (Kg) .90* .18 .80*.83*.53*.40*.54*.52*.76*.74*.13 .18 .10 .05 −.005 BMI(kg/m2) .07 .77*.85*.50*.35*.52*.55*.80*.74*.20 .20* .16 .08 .09 WHR .47*−.08.10 .10 .10.03.01−.02.002−.09 .10 −.03.05 WC(cm) .796*.53*.42*.495*.46*.65*.62*.19 .083 .20 .10 .15 HC (cm) .50*1.0.55*.53*.77*.75*.16 .12 .14 .05 .09 BS (mm) .78*.50*.47*.44*.44*.06 .05 .009 .013.06 T S (mm) .44*.37*.33*.33*.03 −.05 .01 .013.10 SS (mm) .60*.49*.43*−.09 −.02 −.15 −.002 −.12 SiS (mm) .48*.49*.18 .12 .03 −.03.12 AC (cm) .69*.12 .21* .12 .05 .007 CC (cm) .20*.16 .12 .06 .14 SBP (mmHg) .59* .72* .13 .86* DBP (mmHg) .56* .13 .16 MBP (mmHg) .003.53* PR .06 PP Significant at least at p ≤0.05; OA = Onset age, yrs = years, Ht = Height, Wt = Weight, BMI = Body Mass Index, WHR = Waist Hip Ratio, WC = Waist Circumference, HC = Hip Circumference, BS = Biceps skinfold, TS = Triceps skinfold, SS = Sub-scapular skinfold, SiS = Supra-iliac skinfold, AC = Arm Circumference, CC = Calf Circumference, SBP = Systolic Blood Pressure, DBP = Diastolic Blood Pressure, MBP = Mean Blood Pressure, PR = Pulse Rate, PP = Pulse Pressure. 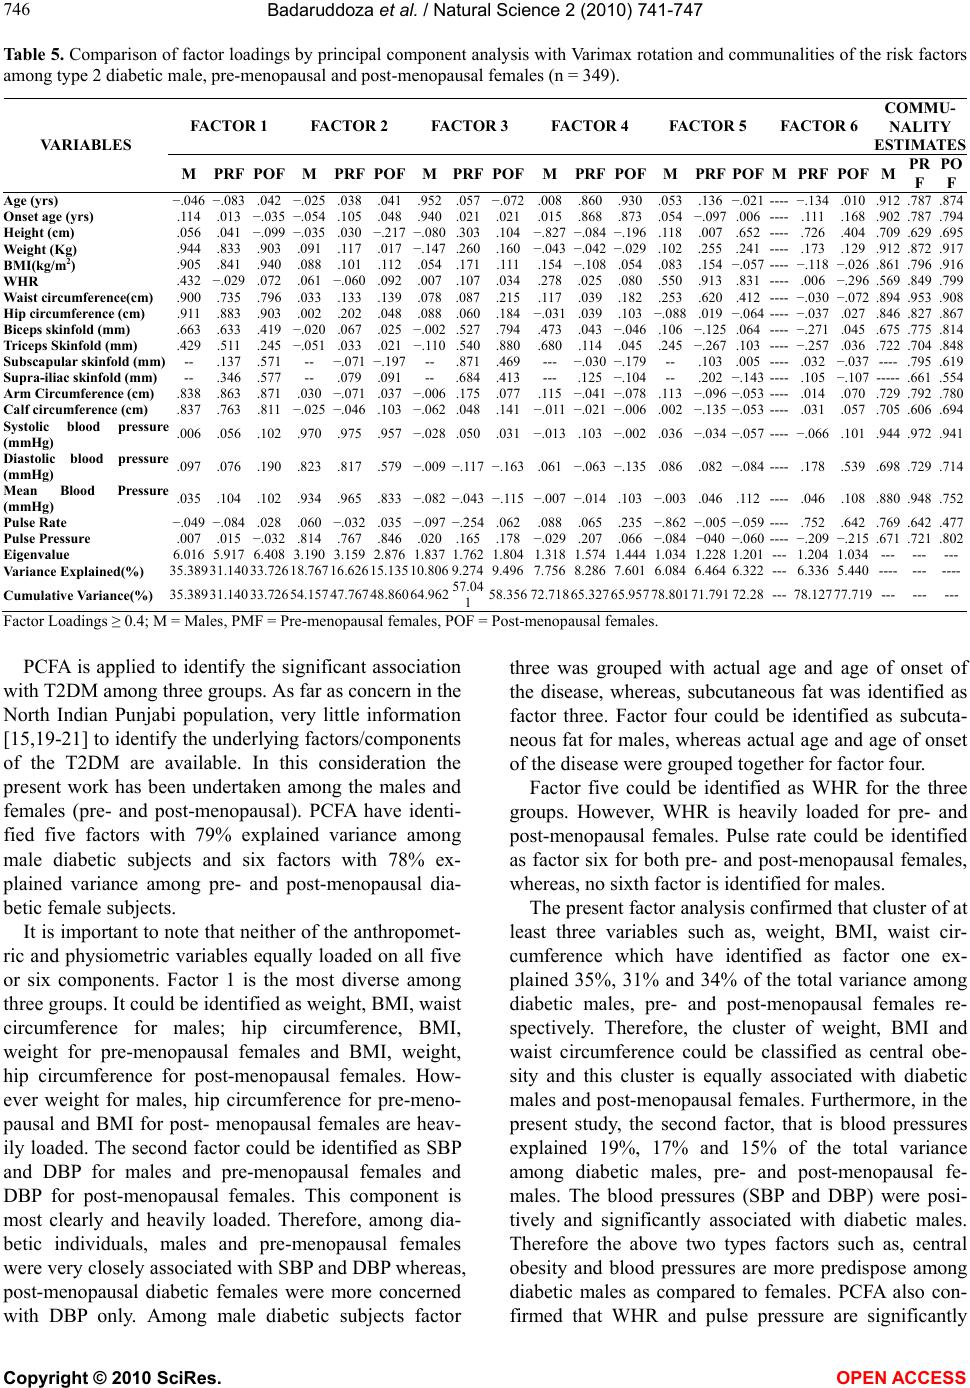 Badaruddoza et al. / Natural Science 2 (2010) 741-747 Copyright © 2010 SciRes. OPEN ACCESS 746 Table 5. Comparison of factor loadings by principal component analysis with Varimax rotation and communalities of the risk factors among type 2 diabetic male, pre-menopausal and post-menopausal females (n = 349). FACTOR 1 FACTOR 2 FACTOR 3 FACTOR 4 FACTOR 5 FACTOR 6 COMMU- NALITY ESTIMATES VARIABLES M PRF POF M PRF POFMPRF POFMPRF POFMPRFPOF M PRF POF MPR F PO F Age (yrs) −.046 −.083.042 −.025 .038 .041.952.057 −.072.008 .860 .930 .053 .136−.021 ---- −.134 .010 .912.787.874 Onset age (yrs) .114 .013−.035 −.054 .105 .048.940.021.021.015.868.873.054 −.097.006 ---- .111 .168 .902.787.794 Height (cm) .056 .041−.099 −.035 .030 −.217 −.080 .303.104−.827 −.084 −.196.118.007.652 ---- .726 .404 .709 .629 .695 Weight (Kg) .944 .833.903 .091 .117 .017−.147 .260.160−.043 −.042 −.029.102.255.241 ---- .173 .129 .912.872.917 BMI(kg/m2) .905 .841 .940 .088 .101 .112 .054.171 .111.154−.108.054 .083 .154−.057 ---- −.118 −.026 .861.796 .916 WHR .432 −.029.072 .061 −.060 .092.007.107.034.278 .025 .080 .550 .913.831 ---- .006 −.296 .569 .849.799 Waist circumference(cm) .900 .735 .796 .033 .133 .139.078 .087.215.117 .039 .182 .253.620.412 ---- −.030 −.072 .894 .953.908 Hip circumference (cm) .911 .883 .903 .002 .202 .048 .088.060 .184−.031 .039.103 −.088.019 −.064 ---- −.037 .027 .846.827.867 Biceps skinfold (mm) .663 .633.419 −.020 .067 .025 −.002 .527.794.473.043−.046 .106−.125 .064 ---- −.271 .045 .675.775.814 Triceps Skinfold (mm) .429 .511 .245 −.051 .033 .021 −.110.540 .880.680.114.045 .245−.267 .103 ---- −.257 .036 .722.704.848 Subscapular skinfold (mm) -- .137.571 -- −.071 −.197-- .871.469---−.030 −.179-- .103.005 ---- .032 −.037 ---- .795.619 Supra-iliac skinfold (mm) -- .346.577 -- .079 .091 -- .684.413 ---.125−.104-- .202−.143 ---- .105 −.107 ----- .661 .554 Arm Circumference (cm) .838 .863.871 .030 −.071 .037−.006 .175.077.115−.041 −.078 .113−.096 −.053 ---- .014 .070 .729.792.780 Calf circumference (cm) .837 .763.811 −.025 −.046 .103−.062 .048.141−.011−.021 −.006 .002−.135 −.053 ---- .031 .057 .705.606.694 Systolic blood pressure (mmHg) .006 .056.102 .970 .975 .957−.028 .050.031−.013 .103 −.002.036−.034 −.057 ---- −.066 .101 .944.972.941 Diastolic blood pressure (mmHg) .097 .076.190 .823 .817 .579−.009 −.117 −.163.061 −.063 −.135.086.082 −.084 ---- .178 .539 .698.729.714 Mean Blood Pressure (mmHg) .035 .104.102 .934 .965 .833−.082 −.043 −.115 −.007 −.014.103 −.003.046.112 ---- .046 .108 .880.948.752 Pulse Rate −.049 −.084.028 .060 −.032 .035 −.097 −.254 .062.088.065.235−.862 −.005 −.059 ---- .752 .642 .769.642.477 Pulse Pressure .007 .015−.032 .814 .767 .846.020.165.178−.029 .207.066−.084 −040 −.060 ---- −.209 −.215 .671 .721.802 Eigenvalue 6.016 5.917 6.408 3.190 3.159 2.876 1.8371.762 1.8041.318 1.574 1.444 1.034 1.2281.201 --- 1.204 1.034 --------- Variance Explained(%) 35.389 31.140 33.726 18.767 16.626 15.135 10.8069.2749.4967.7568.2867.601 6.0846.4646.322 --- 6.336 5.440 ----------- Cumulative Variance(%) 35.389 31.140 33.726 54.157 47.767 48.860 64.96257.04 1 58.35672.71865.32765.95778.80171.79172.28 --- 78.127 77.719 --------- Factor Loadings ≥ 0.4; M = Males, PMF = Pre-menopausal females, POF = Post-menopausal females. PCFA is applied to identify the significant association with T2DM among three groups. As far as concern in the North Indian Punjabi population, very little information [15,19-21] to identify the underlying factors/components of the T2DM are available. In this consideration the present work has been undertaken among the males and females (pre- and post-menopausal). PCFA have identi- fied five factors with 79% explained variance among male diabetic subjects and six factors with 78% ex- plained variance among pre- and post-menopausal dia- betic female subjects. It is important to note that neither of the anthropomet- ric and physiometric variables equally loaded on all five or six components. Factor 1 is the most diverse among three groups. It could be identified as weight, BMI, waist circumference for males; hip circumference, BMI, weight for pre-menopausal females and BMI, weight, hip circumference for post-menopausal females. How- ever weight for males, hip circumference for pre-meno- pausal and BMI for post- menopausal females are heav- ily loaded. The second factor could be identified as SBP and DBP for males and pre-menopausal females and DBP for post-menopausal females. This component is most clearly and heavily loaded. Therefore, among dia- betic individuals, males and pre-menopausal females were very closely associated with SBP and DBP whereas, post-menopausal diabetic females were more concerned with DBP only. Among male diabetic subjects factor three was grouped with actual age and age of onset of the disease, whereas, subcutaneous fat was identified as factor three. Factor four could be identified as subcuta- neous fat for males, whereas actual age and age of onset of the disease were grouped together for factor four. Factor five could be identified as WHR for the three groups. However, WHR is heavily loaded for pre- and post-menopausal females. Pulse rate could be identified as factor six for both pre- and post-menopausal females, whereas, no sixth factor is identified for males. The present factor analysis confirmed that cluster of at least three variables such as, weight, BMI, waist cir- cumference which have identified as factor one ex- plained 35%, 31% and 34% of the total variance among diabetic males, pre- and post-menopausal females re- spectively. Therefore, the cluster of weight, BMI and waist circumference could be classified as central obe- sity and this cluster is equally associated with diabetic males and post-menopausal females. Furthermore, in the present study, the second factor, that is blood pressures explained 19%, 17% and 15% of the total variance among diabetic males, pre- and post-menopausal fe- males. The blood pressures (SBP and DBP) were posi- tively and significantly associated with diabetic males. Therefore the above two types factors such as, central obesity and blood pressures are more predispose among diabetic males as compared to females. PCFA also con- firmed that WHR and pulse pressure are significantly 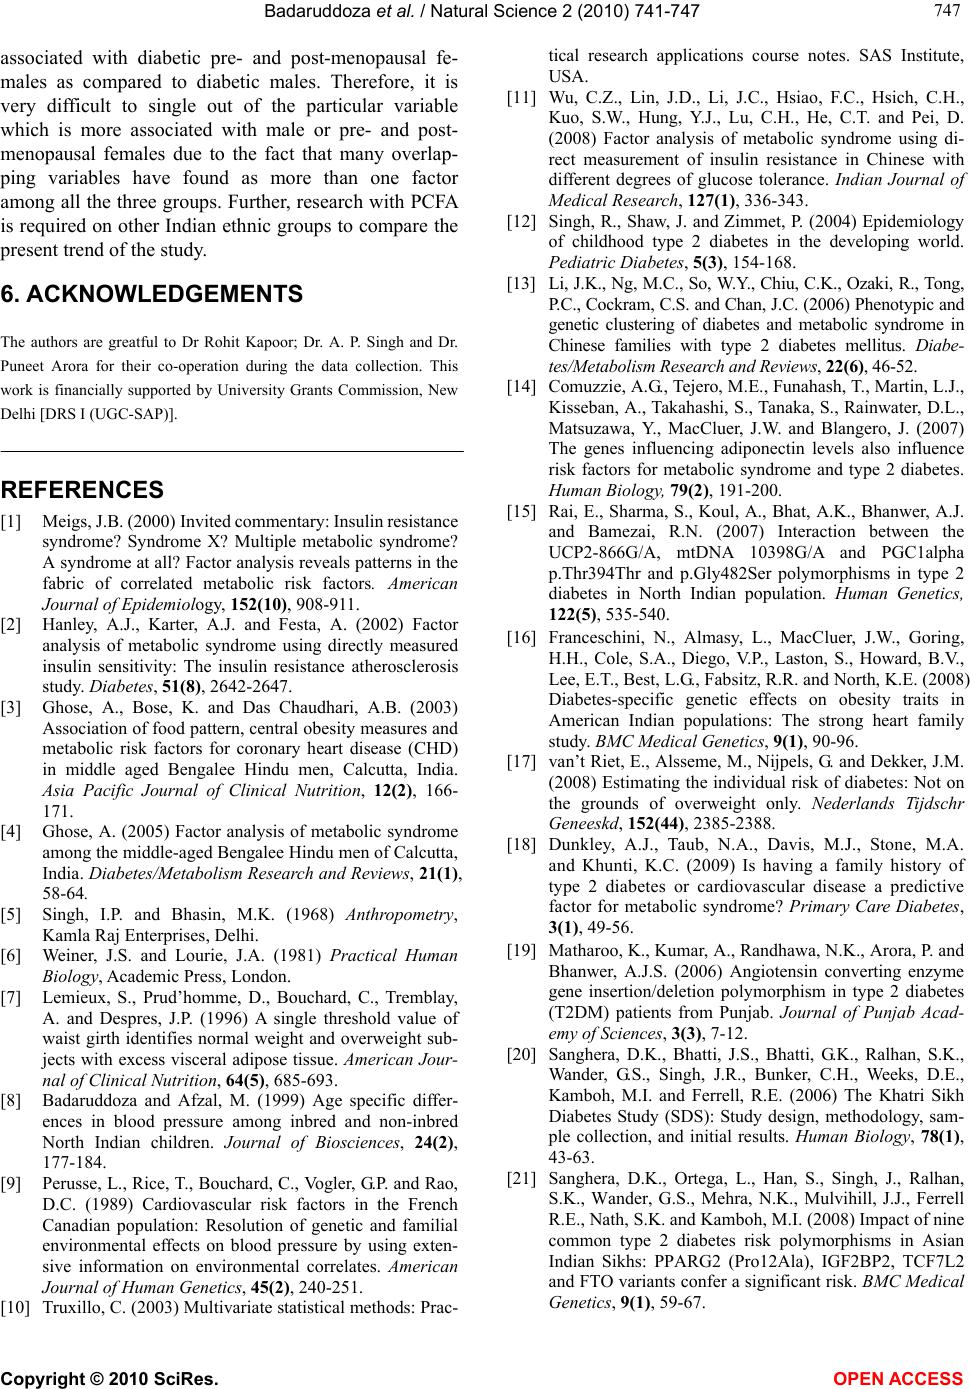 Badaruddoza et al. / Natural Science 2 (2010) 741-747 Copyright © 2010 SciRes. OPEN ACCESS 747 747 associated with diabetic pre- and post-menopausal fe- males as compared to diabetic males. Therefore, it is very difficult to single out of the particular variable which is more associated with male or pre- and post- menopausal females due to the fact that many overlap- ping variables have found as more than one factor among all the three groups. Further, research with PCFA is required on other Indian ethnic groups to compare the present trend of the study. 6. ACKNOWLEDGEMENTS The authors are greatful to Dr Rohit Kapoor; Dr. A. P. Singh and Dr. Puneet Arora for their co-operation during the data collection. This work is financially supported by University Grants Commission, New Delhi [DRS I (UGC-SAP)]. REFERENCES [1] Meigs, J.B. (2000) Invited commentary: Insulin resistance syndrome? Syndrome X? Multiple metabolic syndrome? A syndrome at all? Factor analysis reveals patterns in the fabric of correlated metabolic risk factors. American Journal of Epidemiology, 152(10), 908-911. [2] Hanley, A.J., Karter, A.J. and Festa, A. (2002) Factor analysis of metabolic syndrome using directly measured insulin sensitivity: The insulin resistance atherosclerosis study. Diabetes, 51(8), 2642-2647. [3] Ghose, A., Bose, K. and Das Chaudhari, A.B. (2003) Association of food pattern, central obesity measures and metabolic risk factors for coronary heart disease (CHD) in middle aged Bengalee Hindu men, Calcutta, India. Asia Pacific Journal of Clinical Nutrition, 12(2), 166- 171. [4] Ghose, A. (2005) Factor analysis of metabolic syndrome among the middle-aged Bengalee Hindu men of Calcutta, India. Diabetes/Metabolism Research and Reviews, 21(1), 58-64. [5] Singh, I.P. and Bhasin, M.K. (1968) Anthropometry, Kamla Raj Enterprises, Delhi. [6] Weiner, J.S. and Lourie, J.A. (1981) Practical Human Biology, Academic Press, London. [7] Lemieux, S., Prud’homme, D., Bouchard, C., Tremblay, A. and Despres, J.P. (1996) A single threshold value of waist girth identifies normal weight and overweight sub- jects with excess visceral adipose tissue. American Jour- nal of Clinical Nutrition, 64(5), 685-693. [8] Badaruddoza and Afzal, M. (1999) Age specific differ- ences in blood pressure among inbred and non-inbred North Indian children. Journal of Biosciences, 24(2), 177-184. [9] Perusse, L., Rice, T., Bouchard, C., Vogler, G.P. and Rao, D.C. (1989) Cardiovascular risk factors in the French Canadian population: Resolution of genetic and familial environmental effects on blood pressure by using exten- sive information on environmental correlates. American Journal of Human Genetics, 45(2), 240-251. [10] Truxillo, C. (2003) Multivariate statistical methods: Prac- tical research applications course notes. SAS Institute, USA. [11] Wu, C.Z., Lin, J.D., Li, J.C., Hsiao, F.C., Hsich, C.H., Kuo, S.W., Hung, Y.J., Lu, C.H., He, C.T. and Pei, D. (2008) Factor analysis of metabolic syndrome using di- rect measurement of insulin resistance in Chinese with different degrees of glucose tolerance. Indian Journal of Medical Research, 127(1), 336-343. [12] Singh, R., Shaw, J. and Zimmet, P. (2004) Epidemiology of childhood type 2 diabetes in the developing world. Pediatric Diabetes, 5(3), 154-168. [13] Li, J.K., Ng, M.C., So, W.Y., Chiu, C.K., Ozaki, R., Tong, P.C., Cockram, C.S. and Chan, J.C. (2006) Phenotypic and genetic clustering of diabetes and metabolic syndrome in Chinese families with type 2 diabetes mellitus. Diabe- tes/Metabolism Research and Reviews, 22(6), 46-52. [14] Comuzzie, A.G., Tejero, M.E., Funahash, T., Martin, L.J., Kisseban, A., Takahashi, S., Tanaka, S., Rainwater, D.L., Matsuzawa, Y., MacCluer, J.W. and Blangero, J. (2007) The genes influencing adiponectin levels also influence risk factors for metabolic syndrome and type 2 diabetes. Human Biology, 79(2), 191-200. [15] Rai, E., Sharma, S., Koul, A., Bhat, A.K., Bhanwer, A.J. and Bamezai, R.N. (2007) Interaction between the UCP2-866G/A, mtDNA 10398G/A and PGC1alpha p.Thr394Thr and p.Gly482Ser polymorphisms in type 2 diabetes in North Indian population. Human Genetics, 122(5), 535-540. [16] Franceschini, N., Almasy, L., MacCluer, J.W., Goring, H.H., Cole, S.A., Diego, V.P., Laston, S., Howard, B.V., Lee, E.T., Best, L.G., Fabsitz, R.R. and North, K.E. (2008) Diabetes-specific genetic effects on obesity traits in American Indian populations: The strong heart family study. BMC Medical Genetics, 9(1), 90-96. [17] van’t Riet, E., Alsseme, M., Nijpels, G. and Dekker, J.M. (2008) Estimating the individual risk of diabetes: Not on the grounds of overweight only. Nederlands Tijdschr Geneeskd, 152(44), 2385-2388. [18] Dunkley, A.J., Taub, N.A., Davis, M.J., Stone, M.A. and Khunti, K.C. (2009) Is having a family history of type 2 diabetes or cardiovascular disease a predictive factor for metabolic syndrome? Primary Care Diabetes, 3(1), 49-56. [19] Matharoo, K., Kumar, A., Randhawa, N.K., Arora, P. and Bhanwer, A.J.S. (2006) Angiotensin converting enzyme gene insertion/deletion polymorphism in type 2 diabetes (T2DM) patients from Punjab. Journal of Punjab Acad- emy of Sciences, 3(3), 7-12. [20] Sanghera, D.K., Bhatti, J.S., Bhatti, G.K., Ralhan, S.K., Wander, G.S., Singh, J.R., Bunker, C.H., Weeks, D.E., Kamboh, M.I. and Ferrell, R.E. (2006) The Khatri Sikh Diabetes Study (SDS): Study design, methodology, sam- ple collection, and initial results. Human Biology, 78(1), 43-63. [21] Sanghera, D.K., Ortega, L., Han, S., Singh, J., Ralhan, S.K., Wander, G.S., Mehra, N.K., Mulvihill, J.J., Ferrell R.E., Nath, S.K. and Kamboh, M.I. (2008) Impact of nine common type 2 diabetes risk polymorphisms in Asian Indian Sikhs: PPARG2 (Pro12Ala), IGF2BP2, TCF7L2 and FTO variants confer a significant risk. BMC Medical Genetics, 9(1), 59-67. |