

Paper Menu >>
Journal Menu >>
 Vol.2, No.7, 732-736 (2010) Natural Science http://dx.doi.org/10.4236/ns.2010.27091 Copyright © 2010 SciRes. OPEN ACCESS Familial aggregation and heritability for cardiovascular risk factors: a family based study in Punjab, India Raman Kumar, Badaruddoza* Department of Human Genetics, Guru Nanak Dev University, Amritsar, India; *Corresponding Author: [email protected] Received 19 March 2010; revised 15 April 2010; accepted 20 April 2010. ABSTRACT Background: It is well established that the peo- ple with elevated SBP, DBP, BMI and WHR are more prone to cardiovascular disease. However, very few studies have focused on the amount of familial aggregation and heritability of these cardiovascular risk factors in Indian population. Therefore, purpose of this study was to inves- tigate the familial aggregation of blood pres- sures with respect to certain anthropometric traits and to determine the relative roles of he- redity in the etiology of SBP and DBP in a sam- ple of families with three generations. Methods: The study has been conducted through house to house family study among three generations such as offspring, parent and grandparent in a scheduled caste community (Ramdasia) in Punjab. A total of 1400 individuals, constituting 380 families were surveyed for blood pressure, pulse rate, pulse pressure and anthropometric measurements to study familial aggregation and heritability for cardiovascular risk factors. The analysis represents a multivariate model which includes the each individual family data for es- timation of familial correlation and heritability. Results: All risk factors showed positive familial correlation but magnitudes are different in va- rious pairs of combination. Correlations gener- ally are higher among genetically close relatives such as brother-sisters or parent-offspring and are lower among spouses. The estimated heri- tabilities were 22% for systolic and 27% for dia- stolic blood pressure, 19% for BMI and 17% for WHR. Conclusions: These results indicate a strong familial aggregation of cardiovascular risk factors such as SBP and DBP in this popu- lation and also showed that this familial influ- ence can be detected from anthropometric mea- surements and genetic closeness. Almost all anthropometric variables were found to be sig- nificant with blood pressures among three ge- nerations. Keywords: Familial Aggregation; Heritability; Risk Factors; Ramdasia Population; Punjab 1. INTRODUCTION There is much epidemiological evidence that environ- mental cofactors and anthropometric characteristics are directly and consistently correlated with cardiovascular diseases in developing countries [1-7]. It has been re- ported that almost 30% of risk factors for cardiovascular diseases are accounted by genetic heritability and at least approximately 70% of risk factors are of familial in na- ture [8-13]. However, many authors have contradicted that what extent to which that observed familial aggre- gation on both systolic and diastolic is due to genetic or environmental reason. Some authors have argued that familial aggregation on diastolic blood pressure is more than systolic blood pressure or vice versa [14]. However, in India the pattern of risk factors for cardiovascular diseases are different to cut across the cultural patterns and geographic regions. Therefore, in Indian context the paucity of family based information and complex etiol- ogy of this disease made it difficult for understanding how these factors contribute to the cardiovascular dis- eases. Hence, the major purpose of this study was to investigate the familial aggregation of blood pressures with respect to certain anthropometric traits and to de- termine the relative roles of heredity in the etiology of SBP and DBP in a sample of families with three genera- tions such as offspring, parent and grandparent in Punjab, a north Indian state. Our working hypotheses were that there is familial aggregation of blood pressure in the studied families and the association of blood pressure in first degree relatives is more than spouse pairs. 2. MATERIALS AND METHODS For the present study the population included 1400 indi-  R. Kumar et al. / Natural Science 2 (2010) 732-736 Copyright © 2010 SciRes. OPEN ACCESS 733 733 viduals constituting 380 families with three generations. Individuals in the parental generation (N = 780) range in age from 30.5 to 60.7 years. The age of offspring (N = 456) range from 9.5 to 26.7 years. The age of the grand- parent generation (N = 164) range from 52.8 to 85.6 years. All families were recruited from Ramdasia com- munity (Ramdasia community is socially and education- ally backward from the rest of the population in Punjab) to reduce the confounding effect ethnically determined genetic differences. For recruitment of the subjects fam- ily history of heart disease was not the criteria, however, randomly selected families exhibiting a broad cross se- lection of cardiovascular risk factor levels. 2.1. Phenotypes Measurements This study was approved by the Ethics Review Commit- tee of Guru Nanak Dev University, Amritsar, India and written consent was obtained from all the participants. Comprehensive and elaborated questionnaires related health, life style, demographic features, socio-economic status and family history were completed by the partici- pants before physical measurement. Blood pressure was measure on the right arm of the subjects in a sitting posi- tion after 10 minutes of rest using a mercury sphygmo- manometer and a stethoscope with an accuracy of 2 mm Hg by following the recommendations of American Heart Association [15]. On the basis of circumference of the participants arm, a regular adult or large or medium cuff has been chosen. Systolic and diastolic blood pres- sures were defined at the first and fifth phases of Korot- koff sounds respectively. The pulse rate was measured for 60 seconds. The average of two measurements was used as the estimates of SBP and DBP in the present analysis. Mean arterial blood pressure (MBP) was cal- culated as DBP + (SBP-DBP)/3 [16]. The pulse pressure was calculated as SBP-DBP. The other anthropometric measurements were taken from each individual include height, weight, five cir- cumferences (chest, waist, hip, arm and calf) and biceps and triceps skinfolds. All measurements were taken with standard anthropometric techniques [17-18]. Body mass index (BMI) and waist to hip ratio were defined as weight/height2 (kg/m2) and waist circumference divided by hip circumferences respectively. 2.2. Statistical Methods All statistical analyses were performed using SPSS software. The p < 0.05 level was selected as the criterion of statistical significance. Heritability estimation was done from regression of offspring on parents. 3. RESULTS Table 1 shows the summary of data for offspring, parent and grandparent generations with both sexes. The mean ages and standard deviations for different generations are: 18.00 ± 5.12 (male offspring), 17.63 ± 4.95 (female off- spring), 41.19 ± 9.12 (male parents), 38.05 ± 9.16 (fe- male parents), 67.52 ± 9.10 (male grandparents) and 62.46 ± 8.72 (female grandparents). In general, maxi- mum mean values of anthropometric measurements such as height, weight and calf circumference for male parent generation; BMI, chest, hip and arm circumferences, biceps and triceps skinfolds for female parent generation; waist circumference, WHR for female grandparent gen- eration have been observed in the present analysis. The maximum SBP, DBP, MBP, pulse rate and pressure have been found in female grandparent generation. On aver- age, offspring generations have lower mean values of almost all measured phenotypes. As shown in the Table 2 all the means of the measured variables have signifi- cant differences (p < 0.001) between different intra-gen- erations for all measured variables. However, age, DBP, calf and hip circumferences, and WHR have found max- imum intra-generational differences. Estimates of familial correlations among household members and estimated sample size are presented in Table 3. All correlations are positive and maximum fa- milial correlations for almost all the traits were found in close genetically related brother-sister combination. The lowest familial correlations for all the traits were found in spouses. The familial correlations for SBP and DBP are also significantly higher between father-male off- spring combination. However, the stronger correlations were found in various traits among different combina- tions such as for biceps skinfold, chest circumference, pulse pressure between father-male offspring; for arm circumference between father-female offspring; for BMI, WHR and pulse rate between mother-female offspring. Therefore, these risk factors showed the patterns of fa- milial correlation which were stronger among more ge- netic control relationship and lower in spouse. Table 4 shows estimated genetic component of vari- ance and heritability for cardiovascular risk factors in this population. The genetic variance included only the additive genetic variance and these are significantly greater than zero for all the risk factors. The genetic ef- fect of these risk factors may be assumed from the square root of these variances. For SBP the genetic effect is 10.56 mm Hg and it contributes 22% (heritability) of the variation in systolic blood pressure. For diastolic blood pressure the genetic effects is 7.28 mmHg and it contributes 27% of the variation in this population. However, the contributions of genetic effects of other variables such as pulse rate, pulse pressure, body mass index (BMI), waist to hip ratio (WHR), biceps and tri- ceps skinfolds, arm and calf circumferences are 10.03 minutes (heritability 10%), 8.75 mm (heritability 30%), 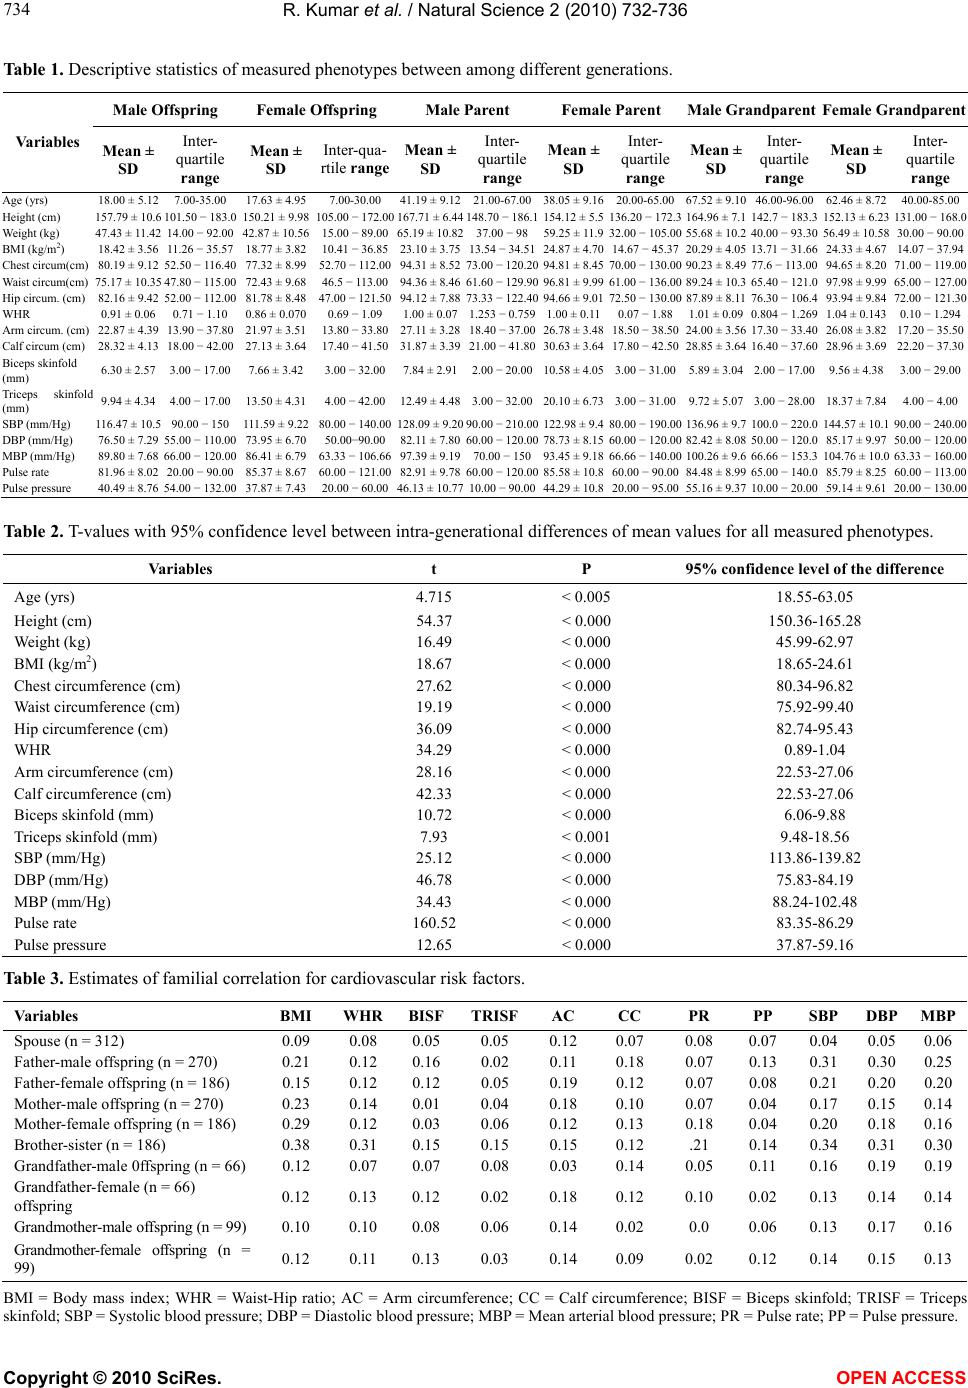 R. Kumar et al. / Natural Science 2 (2010) 732-736 Copyright © 2010 SciRes. OPEN ACCESS 734 Table 1. Descriptive statistics of measured phenotypes between among different generations. Male Offspring Female Offspring Male Parent Female Parent Male Grandparent Female Grandparent Variables Mean ± SD Inter- quartile range Mean ± SD Inter-qua- rtile range Mean ± SD Inter- quartile range Mean ± SD Inter- quartile range Mean ± SD Inter- quartile range Mean ± SD Inter- quartile range Age (yrs) 18.00 ± 5.12 7.00-35.00 17.63 ± 4.95 7.00-30.00 41.19 ± 9.1221.00-67.0038.05 ± 9.1620.00-65.0067.52 ± 9.10 46.00-96.00 62.46 ± 8.7240.00-85.00 Height (cm) 157.79 ± 10.6 101.50 − 183.0 150.21 ± 9.98 105.00 − 172.00 167.71 ± 6.44148.70 − 186.1154.12 ± 5.5136.20 − 172.3164.96 ± 7.1 142.7 − 183.3 152.13 ± 6.23131.00 − 168.0 Weight (kg) 47.43 ± 11.42 14.00 − 92.00 42.87 ± 10.56 15.00 − 89.0065.19 ± 10.8237.00 − 9859.25 ± 11.932.00 − 105.0055.68 ± 10.2 40.00 − 93.30 56.49 ± 10.5830.00 − 90.00 BMI (kg/m2) 18.42 ± 3.56 11.26 − 35.57 18.77 ± 3.82 10.41 − 36.8523.10 ± 3.7513.54 − 34.5124.87 ± 4.7014.67 − 45.3720.29 ± 4.05 13.71 − 31.66 24.33 ± 4.6714.07 − 37.94 Chest circum(cm) 80.19 ± 9.12 52.50 − 116.40 77.32 ± 8.99 52.70 − 112.0094.31 ± 8.5273.00 − 120.2094.81 ± 8.4570.00 − 130.0090.23 ± 8.49 77.6 − 113.00 94.65 ± 8.2071.00 − 119.00 Waist circum(cm) 75.17 ± 10.35 47.80 − 115.00 72.43 ± 9.68 46.5 − 113.0094.36 ± 8.4661.60 − 129.9096.81 ± 9.9961.00 − 136.0089.24 ± 10.3 65.40 − 121.0 97.98 ± 9.9965.00 − 127.00 Hip circum. (cm) 82.16 ± 9.42 52.00 − 112.00 81.78 ± 8.48 47.00 − 121.5094.12 ± 7.8873.33 − 122.4094.66 ± 9.0172.50 − 130.0087.89 ± 8.11 76.30 − 106.4 93.94 ± 9.8472.00 − 121.30 WHR 0.91 ± 0.06 0.71 − 1.10 0.86 ± 0.070 0.69 − 1.09 1.00 ± 0.071.253 − 0.7591.00 ± 0.110.07 − 1.881.01 ± 0.09 0.804 − 1.269 1.04 ± 0.1430.10 − 1.294 Arm circum. (cm) 22.87 ± 4.39 13.90 − 37.80 21.97 ± 3.51 13.80 − 33.8027.11 ± 3.2818.40 − 37.0026.78 ± 3.4818.50 − 38.5024.00 ± 3.56 17.30 − 33.40 26.08 ± 3.8217.20 − 35.50 Calf circum (cm) 28.32 ± 4.13 18.00 − 42.00 27.13 ± 3.64 17.40 − 41.5031.87 ± 3.3921.00 − 41.8030.63 ± 3.6417.80 − 42.5028.85 ± 3.64 16.40 − 37.60 28.96 ± 3.6922.20 − 37.30 Biceps skinfold (mm) 6.30 ± 2.57 3.00 − 17.00 7.66 ± 3.42 3.00 − 32.007.84 ± 2.912.00 − 20.0010.58 ± 4.053.00 − 31.005.89 ± 3.04 2.00 − 17.00 9.56 ± 4.383.00 − 29.00 Triceps skinfold (mm) 9.94 ± 4.34 4.00 − 17.00 13.50 ± 4.31 4.00 − 42.0012.49 ± 4.483.00 − 32.0020.10 ± 6.733.00 − 31.009.72 ± 5.07 3.00 − 28.00 18.37 ± 7.844.00 − 4.00 SBP (mm/Hg) 116.47 ± 10.5 90.00 − 150 111.59 ± 9.22 80.00 − 140.00128.09 ± 9.2090.00 − 210.00122.98 ± 9.480.00 − 190.00136.96 ± 9.7 100.0 − 220.0 144.57 ± 10.190.00 − 240.00 DBP (mm/Hg) 76.50 ± 7.29 55.00 − 110.00 73.95 ± 6.70 50.00−90.0082.11 ± 7.8060.00 − 120.0078.73 ± 8.1560.00 − 120.0082.42 ± 8.08 50.00 − 120.0 85.17 ± 9.9750.00 − 120.00 MBP (mm/Hg) 89.80 ± 7.68 66.00 − 120.00 86.41 ± 6.79 63.33 − 106.6697.39 ± 9.1970.00 − 15093.45 ± 9.1866.66 − 140.00100.26 ± 9.6 66.66 − 153.3 104.76 ± 10.063.33 − 160.00 Pulse rate 81.96 ± 8.02 20.00 − 90.00 85.37 ± 8.67 60.00 − 121.0082.91 ± 9.7860.00 − 120.0085.58 ± 10.860.00 − 90.0084.48 ± 8.99 65.00 − 140.0 85.79 ± 8.2560.00 − 113.00 Pulse pressure 40.49 ± 8.76 54.00 − 132.00 37.87 ± 7.43 20.00 − 60.0046.13 ± 10.7710.00 − 90.0044.29 ± 10.820.00 − 95.0055.16 ± 9.37 10.00 − 20.00 59.14 ± 9.6120.00 − 130.00 Table 2. T-values with 95% confidence level between intra-generational differences of mean values for all measured phenotypes. Variables t P 95% confidence level of the difference Age (yrs) 4.715 < 0.005 18.55-63.05 Height (cm) 54.37 < 0.000 150.36-165.28 Weight (kg) 16.49 < 0.000 45.99-62.97 BMI (kg/m2) 18.67 < 0.000 18.65-24.61 Chest circumference (cm) 27.62 < 0.000 80.34-96.82 Waist circumference (cm) 19.19 < 0.000 75.92-99.40 Hip circumference (cm) 36.09 < 0.000 82.74-95.43 WHR 34.29 < 0.000 0.89-1.04 Arm circumference (cm) 28.16 < 0.000 22.53-27.06 Calf circumference (cm) 42.33 < 0.000 22.53-27.06 Biceps skinfold (mm) 10.72 < 0.000 6.06-9.88 Triceps skinfold (mm) 7.93 < 0.001 9.48-18.56 SBP (mm/Hg) 25.12 < 0.000 113.86-139.82 DBP (mm/Hg) 46.78 < 0.000 75.83-84.19 MBP (mm/Hg) 34.43 < 0.000 88.24-102.48 Pulse rate 160.52 < 0.000 83.35-86.29 Pulse pressure 12.65 < 0.000 37.87-59.16 Table 3. Estimates of familial correlation for cardiovascular risk factors. Variables BMI WHRBISFTRISFAC CC PR PP SBP DBPMBP Spouse (n = 312) 0.09 0.08 0.05 0.05 0.12 0.07 0.08 0.07 0.04 0.050.06 Father-male offspring (n = 270) 0.21 0.12 0.16 0.02 0.11 0.18 0.07 0.13 0.31 0.300.25 Father-female offspring (n = 186) 0.15 0.12 0.12 0.05 0.19 0.12 0.07 0.08 0.21 0.200.20 Mother-male offspring (n = 270) 0.23 0.14 0.01 0.04 0.18 0.10 0.07 0.04 0.17 0.150.14 Mother-female offspring (n = 186) 0.29 0.12 0.03 0.06 0.12 0.13 0.18 0.04 0.20 0.180.16 Brother-sister (n = 186) 0.38 0.31 0.15 0.15 0.15 0.12 .21 0.14 0.34 0.310.30 Grandfather-male 0ffspring (n = 66)0.12 0.07 0.07 0.08 0.03 0.14 0.05 0.11 0.16 0.190.19 Grandfather-female (n = 66) offspring 0.12 0.13 0.12 0.02 0.18 0.12 0.10 0.02 0.13 0.140.14 Grandmother-male offspring (n = 99)0.10 0.10 0.08 0.06 0.14 0.02 0.0 0.06 0.13 0.170.16 Grandmother-female offspring (n = 99) 0.12 0.11 0.13 0.03 0.14 0.09 0.02 0.12 0.14 0.150.13 BMI = Body mass index; WHR = Waist-Hip ratio; AC = Arm circumference; CC = Calf circumference; BISF = Biceps skinfold; TRISF = Triceps skinfold; SBP = Systolic blood pressure; DBP = Diastolic blood pressure; MBP = Mean arterial blood pressure; PR = Pulse rate; PP = Pulse pressure. 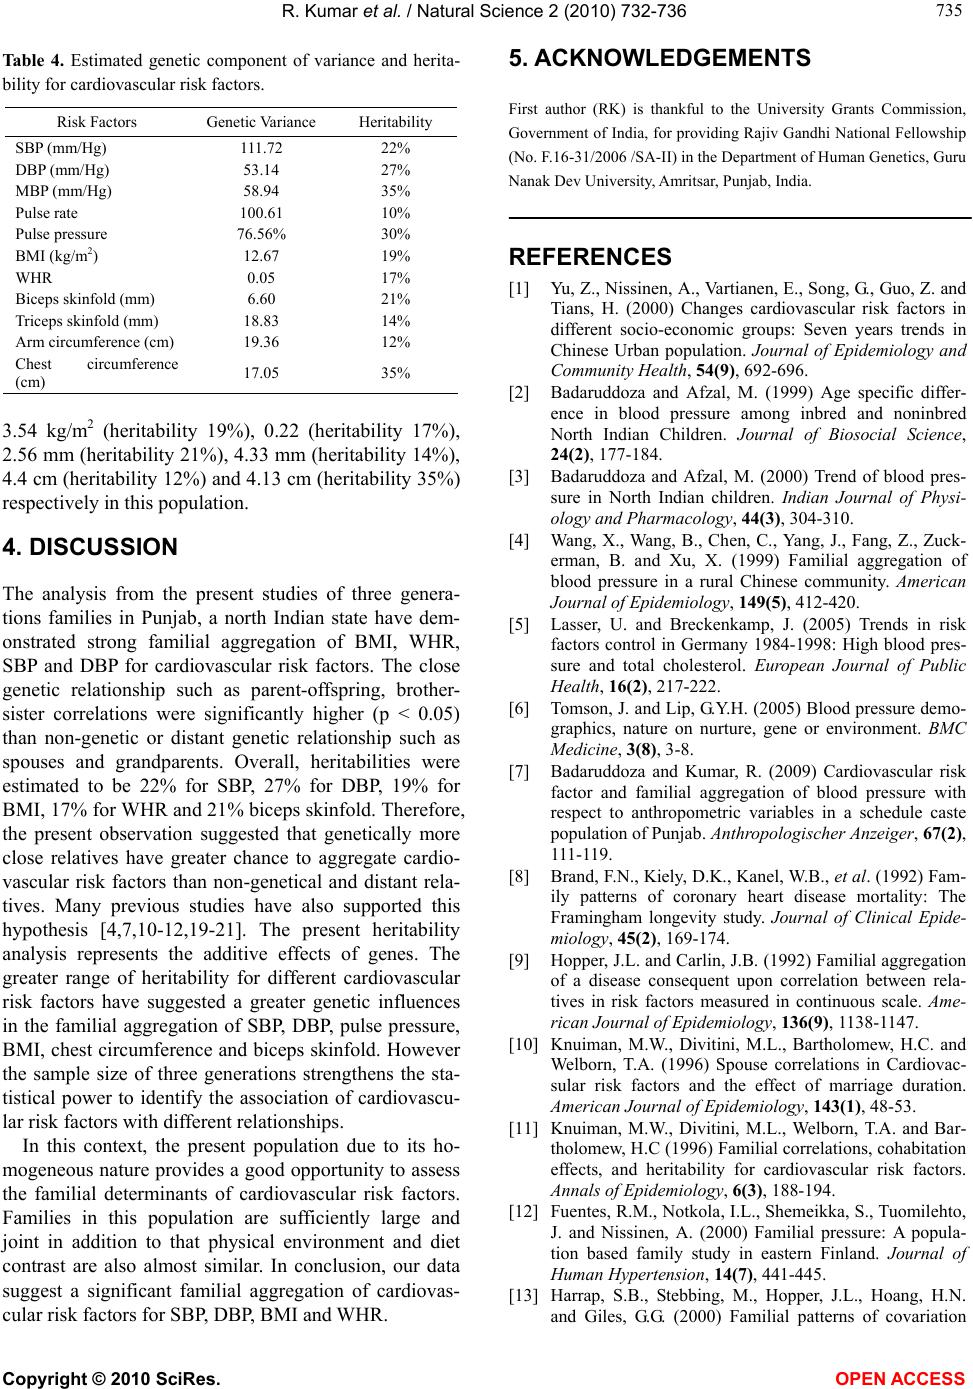 R. Kumar et al. / Natural Science 2 (2010) 732-736 Copyright © 2010 SciRes. OPEN ACCESS 735 735 Table 4. Estimated genetic component of variance and herita- bility for cardiovascular risk factors. Risk Factors Genetic Variance Heritability SBP (mm/Hg) 111.72 22% DBP (mm/Hg) 53.14 27% MBP (mm/Hg) 58.94 35% Pulse rate 100.61 10% Pulse pressure 76.56% 30% BMI (kg/m2) 12.67 19% WHR 0.05 17% Biceps skinfold (mm) 6.60 21% Triceps skinfold (mm) 18.83 14% Arm circumference (cm) 19.36 12% Chest circumference (cm) 17.05 35% 3.54 kg/m2 (heritability 19%), 0.22 (heritability 17%), 2.56 mm (heritability 21%), 4.33 mm (heritability 14%), 4.4 cm (heritability 12%) and 4.13 cm (heritability 35%) respectively in this population. 4. DISCUSSION The analysis from the present studies of three genera- tions families in Punjab, a north Indian state have dem- onstrated strong familial aggregation of BMI, WHR, SBP and DBP for cardiovascular risk factors. The close genetic relationship such as parent-offspring, brother- sister correlations were significantly higher (p < 0.05) than non-genetic or distant genetic relationship such as spouses and grandparents. Overall, heritabilities were estimated to be 22% for SBP, 27% for DBP, 19% for BMI, 17% for WHR and 21% biceps skinfold. Therefore, the present observation suggested that genetically more close relatives have greater chance to aggregate cardio- vascular risk factors than non-genetical and distant rela- tives. Many previous studies have also supported this hypothesis [4,7,10-12,19-21]. The present heritability analysis represents the additive effects of genes. The greater range of heritability for different cardiovascular risk factors have suggested a greater genetic influences in the familial aggregation of SBP, DBP, pulse pressure, BMI, chest circumference and biceps skinfold. However the sample size of three generations strengthens the sta- tistical power to identify the association of cardiovascu- lar risk factors with different relationships. In this context, the present population due to its ho- mogeneous nature provides a good opportunity to assess the familial determinants of cardiovascular risk factors. Families in this population are sufficiently large and joint in addition to that physical environment and diet contrast are also almost similar. In conclusion, our data suggest a significant familial aggregation of cardiovas- cular risk factors for SBP, DBP, BMI and WHR. 5. ACKNOWLEDGEMENTS First author (RK) is thankful to the University Grants Commission, Government of India, for providing Rajiv Gandhi National Fellowship (No. F.16-31/2006 /SA-II) in the Department of Human Genetics, Guru Nanak Dev University, Amritsar, Punjab, India. REFERENCES [1] Yu, Z., Nissinen, A., Vartianen, E., Song, G., Guo, Z. and Tians, H. (2000) Changes cardiovascular risk factors in different socio-economic groups: Seven years trends in Chinese Urban population. Journal of Epidemiology and Community Health, 54(9), 692-696. [2] Badaruddoza and Afzal, M. (1999) Age specific differ- ence in blood pressure among inbred and noninbred North Indian Children. Journal of Biosocial Science, 24(2), 177-184. [3] Badaruddoza and Afzal, M. (2000) Trend of blood pres- sure in North Indian children. Indian Journal of Physi- ology and Pharmacology, 44(3), 304-310. [4] Wang, X., Wang, B., Chen, C., Yang, J., Fang, Z., Zuck- erman, B. and Xu, X. (1999) Familial aggregation of blood pressure in a rural Chinese community. American Journal of Epidemiology, 149(5), 412-420. [5] Lasser, U. and Breckenkamp, J. (2005) Trends in risk factors control in Germany 1984-1998: High blood pres- sure and total cholesterol. European Journal of Public Health, 16(2), 217-222. [6] Tomson, J. and Lip, G.Y.H. (2005) Blood pressure demo- graphics, nature on nurture, gene or environment. BMC Medicine, 3(8), 3-8. [7] Badaruddoza and Kumar, R. (2009) Cardiovascular risk factor and familial aggregation of blood pressure with respect to anthropometric variables in a schedule caste population of Punjab. Anthropologischer Anzeiger, 67(2), 111-119. [8] Brand, F.N., Kiely, D.K., Kanel, W.B., et al. (1992) Fam- ily patterns of coronary heart disease mortality: The Framingham longevity study. Journal of Clinical Epide- miology, 45(2), 169-174. [9] Hopper, J.L. and Carlin, J.B. (1992) Familial aggregation of a disease consequent upon correlation between rela- tives in risk factors measured in continuous scale. Ame- rican Journal of Epidemiology, 136(9), 1138-1147. [10] Knuiman, M.W., Divitini, M.L., Bartholomew, H.C. and Welborn, T.A. (1996) Spouse correlations in Cardiovac- sular risk factors and the effect of marriage duration. American Journal of Epidemiology, 143(1), 48-53. [11] Knuiman, M.W., Divitini, M.L., Welborn, T.A. and Bar- tholomew, H.C (1996) Familial correlations, cohabitation effects, and heritability for cardiovascular risk factors. Annals of Epidemiology, 6(3), 188-194. [12] Fuentes, R.M., Notkola, I.L., Shemeikka, S., Tuomilehto, J. and Nissinen, A. (2000) Familial pressure: A popula- tion based family study in eastern Finland. Journal of Human Hypertension, 14(7), 441-445. [13] Harrap, S.B., Stebbing, M., Hopper, J.L., Hoang, H.N. and Giles, G.G. (2000) Familial patterns of covariation  R. Kumar et al. / Natural Science 2 (2010) 732-736 Copyright © 2010 SciRes. OPEN ACCESS 736 for cardiovascular risk factors in adults: The Victorian family heart study. American Journal of Epidemiology, 152(8), 704-715. [14] Knuiman, M.W., Jamrozik, K., Welborn, T.A., Divitini, M.L. and Whittal, D.E. (1995) Age and secular trends in risk factors for cardiovascular disease in Busselton. Aus- tralian Journal of Public Health, 19(4), 375-385. [15] American Heart Association, (1981) Report of subcom- mittee of postgraduate education committee recommen- dations for human blood pressure determination of sphygmomanometer. Circulation, 64, 510A-599B. [16] Pérusse, L., Rice, T., Bouchard, C., Vogler, G.P. and Roa, D.C. (1989) Cardiovascular risk factors in the French Canadian population. Resolution of genetic and familial environmental effects on blood pressure by using exten- sive information on environmental correlates. American Journal of Human Genetics, 45(2), 240-251. [17] Singh, I.P. and Bhasin, M.K. (1968) Anthropometry, Kamla Raj Enterprises, Delhi. [18] Weiner, J.S. and Lourie, J.A. (1981) Practical Human Biology, Academic Press, London. [19] Tambs, K., Moum, T., Holmen, J., Eaves, J.L., Neale, M.C., Lund-Larsen, P.J. and Næss, S. (1992) Genetic and environmental effects on blood pressure in a Norwegian sample. Genetic Epidemiology, 9(1), 11-26. [20] Rice, T., Rao, R., Pérusse, L., Bouchard, C. and Rao, D.C. (2000) Tracking of familial resemblance for resting blood pressure over time in the Quebec family study. Human Biology, 72(3), 415-431. [21] Jee, S.H., Suh, I., Won, S.Y. and Kim, M. (2002) Familial correlation and heritability for cardiovascular risk factors. Yonsei Medical Journal, 43(2), 160-164. |