

Paper Menu >>
Journal Menu >>
 iBusiness, 2012, 4, 193-197 http://dx.doi.org/10.4236/ib.2012.43024 Published Online September 2012 (http://www.SciRP.org/journal/ib) 193 Evolutionary Gaming Analysis of Path Dependence in Green Construction Technology Change Xian-Feng Zhang, Chuan-Min Shuai, Pei-Song Gong, Han Sun School of Engineering & Management, China University of Geosciences, Wuhan, China. Email: [email protected] Received April 22nd, 2012; revised May 15th, 2012; accepted June 4th, 2012 ABSTRACT In the context of instigating green construction technology by changing current technology practices, evolutionary game theory is used to solve path dependence problems that yield stable equilibrium. Replicating dynamic gaming shows that in inducing technological change some problems concerning multiple equilibrium definitely exist and that profit is the prime motivation to use or supply new technology. The model also shows that a lock-in of a current technology can be broken as a consequence of players’ studies. Keywords: Green Construction Technology; Path Dependent; Evolutionary Game 1. Introduction 1.1. Green Construction Technology Construction is a process of building in which materials are transformed into products, such as buildings, airports and highways, which unfortunately by its nature leads inevitably to some level of environmental pollution, ex- travagant energy consumption and resource depletion. The process is outlined in Figure 1. Because construc- tion is a necessary activity, the question arises as to how to minimize its detrimental effects; green construction technology (GCT) incorporates the right choices to achieve this goal. GCT refers to a kind of sustainable development technology enabling consumption of less resource, less energy and to bring lighter environmental pollution during the entire construction cycle [1]. Despite its green credentials, GCT promotion has not however been satisfactory. It has been rejected by many builders simply because giving up old technologies is not to their liking, perhaps due to the expense, inconvenience or dis- ruption to business. In this paper, the problem confront- ing construction builders given their technology options is investigated using evolutionary game theory to analyze the path dependence to stable equilibrium. 1.2. Brief View of Path Dependence Research Research using path dependence analysis covers a rich variety of fields. In 1975, Paul A. David of Stanford University developed the concept of path dependence within the context of technological change [2]. David, along with colleague W. Brian Arthur [3-6], systematized this idea of path dependence, establishing it as one of the more valuable theories finding a rapid development within modern economics. They considered that techno- logical change was a system which was influenced by a “positive feedback mechanism”, and that change has several characteristics, which are itemized as follows: 1) Multiple equilibrium—that is to say, the result of a de- veloping system is not singular but has more than one outcome; 2) Close-down—this refers to one technology which, once adopted, employs income-increasing mecha- nisms preventing it from being displaced by other tech- nologies; 3) Non-efficient possibility—those locked-in technologies having a strangle-hold within the market are no longer the best choices; and 4) Path dependence—the path of an evolutionary system is dependent on the sys- tem’s original state and trajectory. Leibowitz and Mar- golis (1990,1994) [7,8] thought that there were two methods which can break this path dependence: either by predicting the results from the different choices present or by provided more communication on options before choices are made. Unless the subject of economics is unwilling to change, path dependence is inevitable. 2. The Asymmetric Replication Dynamic Game Model of Technological Change on GCT Evolutionary gaming is based on several hypotheses summarized as follows: 1) Players who adopted higher revenue strategies will repeat their strategy more readily, and therefore in the long run, the fraction of players who adopt lower revenue strategies will decrease; 2) Players Copyright © 2012 SciRes. IB 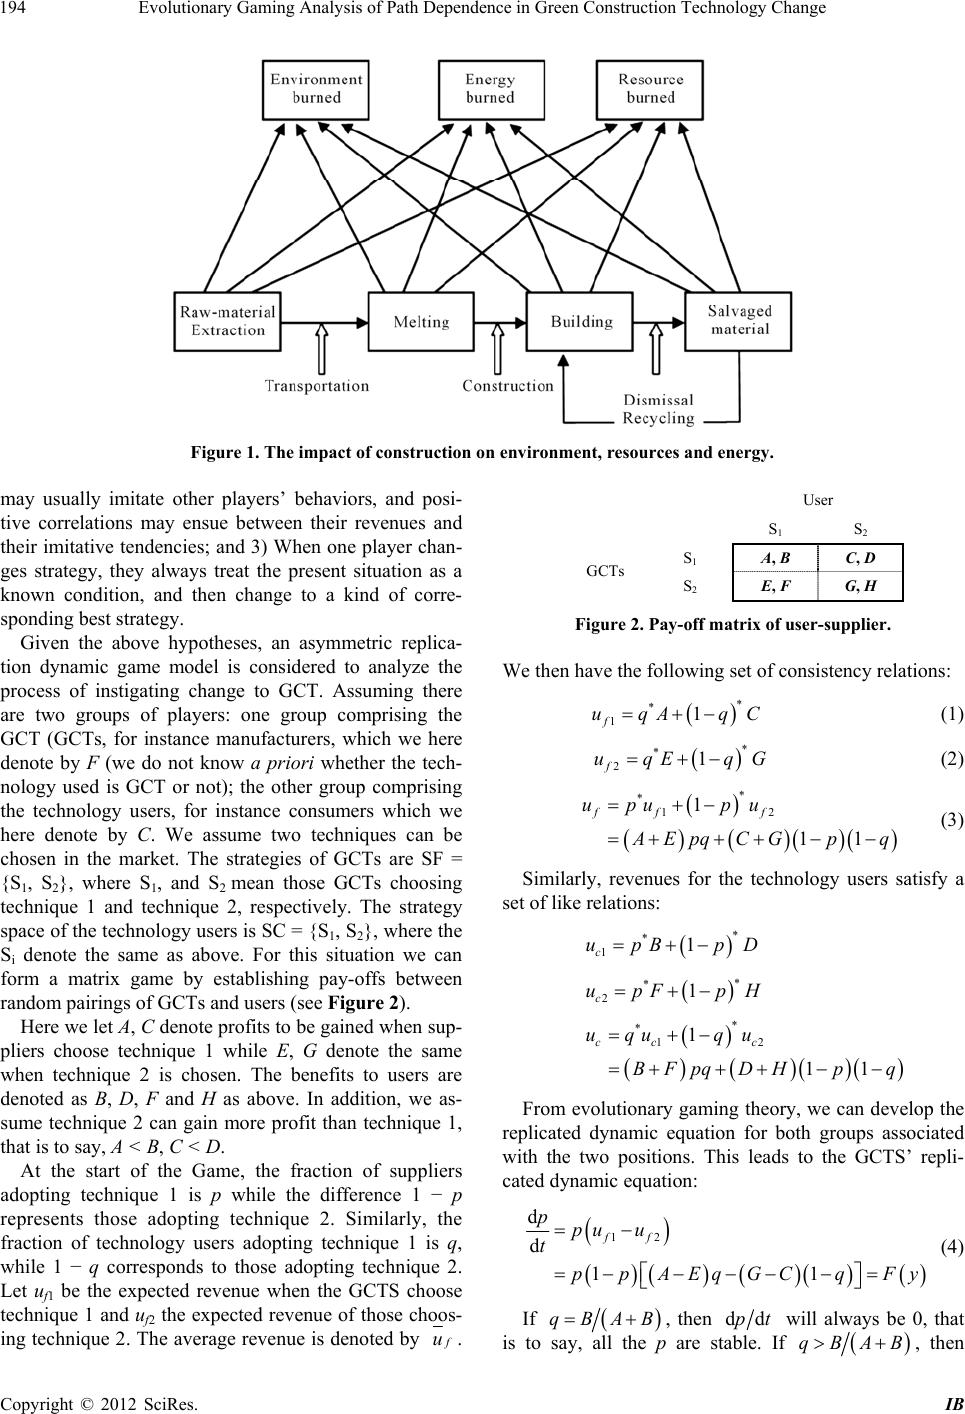 Evolutionary Gaming Analysis of Path Dependence in Green Construction Technology Change 194 Figure 1. The impact of construction on environment, resources and energy. may usually imitate other players’ behaviors, and posi- tive correlations may ensue between their revenues and their imitative tendencies; and 3) When one player chan- ges strategy, they always treat the present situation as a known condition, and then change to a kind of corre- sponding best strategy. Given the above hypotheses, an asymmetric replica- tion dynamic game model is considered to analyze the process of instigating change to GCT. Assuming there are two groups of players: one group comprising the GCT (GCTs, for instance manufacturers, which we here denote by F (we do not know a priori whether the tech- nology used is GCT or not); the other group comprising the technology users, for instance consumers which we here denote by C. We assume two techniques can be chosen in the market. The strategies of GCTs are SF = {S1, S2}, where S1, and S2 mean those GCTs choosing technique 1 and technique 2, respectively. The strategy space of the technology users is SC = {S1, S2}, where the Si denote the same as above. For this situation we can form a matrix game by establishing pay-offs between random pairings of GCTs and users (see Figure 2). Here we let A, C denote profits to be gained when sup- pliers choose technique 1 while E, G denote the same when technique 2 is chosen. The benefits to users are denoted as B, D, F and H as above. In addition, we as- sume technique 2 can gain more profit than technique 1, that is to say, A < B, C < D. At the start of the Game, the fraction of suppliers adopting technique 1 is p while the difference 1 − p represents those adopting technique 2. Similarly, the fraction of technology users adopting technique 1 is q, while 1 − q corresponds to those adopting technique 2. Let uf1 be the expected revenue when the GCTS choose technique 1 and uf2 the expected revenue of those choos- ing technique 2. The average revenue is denoted by f u. User S 1 S 2 S1 A, B C, D GCTs S2 E, F G, H Figure 2. Pay-off matrix of user-supplier. We then have the following set of consistency relations: * * 11 f uqA qC G (1) * * 21 f uqE q (2) * * 12 1 11 ff f upu pu A EpqC Gpq (3) Similarly, revenues for the technology users satisfy a set of like relations: * * 11 c upB pD * 21 c upF pH * * 12 1 11 cc c uqu qu BFpq DHpq From evolutionary gaming theory, we can develop the replicated dynamic equation for both groups associated with the two positions. This leads to the GCTS’ repli- cated dynamic equation: 12 d d 11 ff ppu u t ppAEqGC qFy (4) If qBAB , then ddpt will always be 0, that is to say, all the p are stable. If qBAB, then Copyright © 2012 SciRes. IB 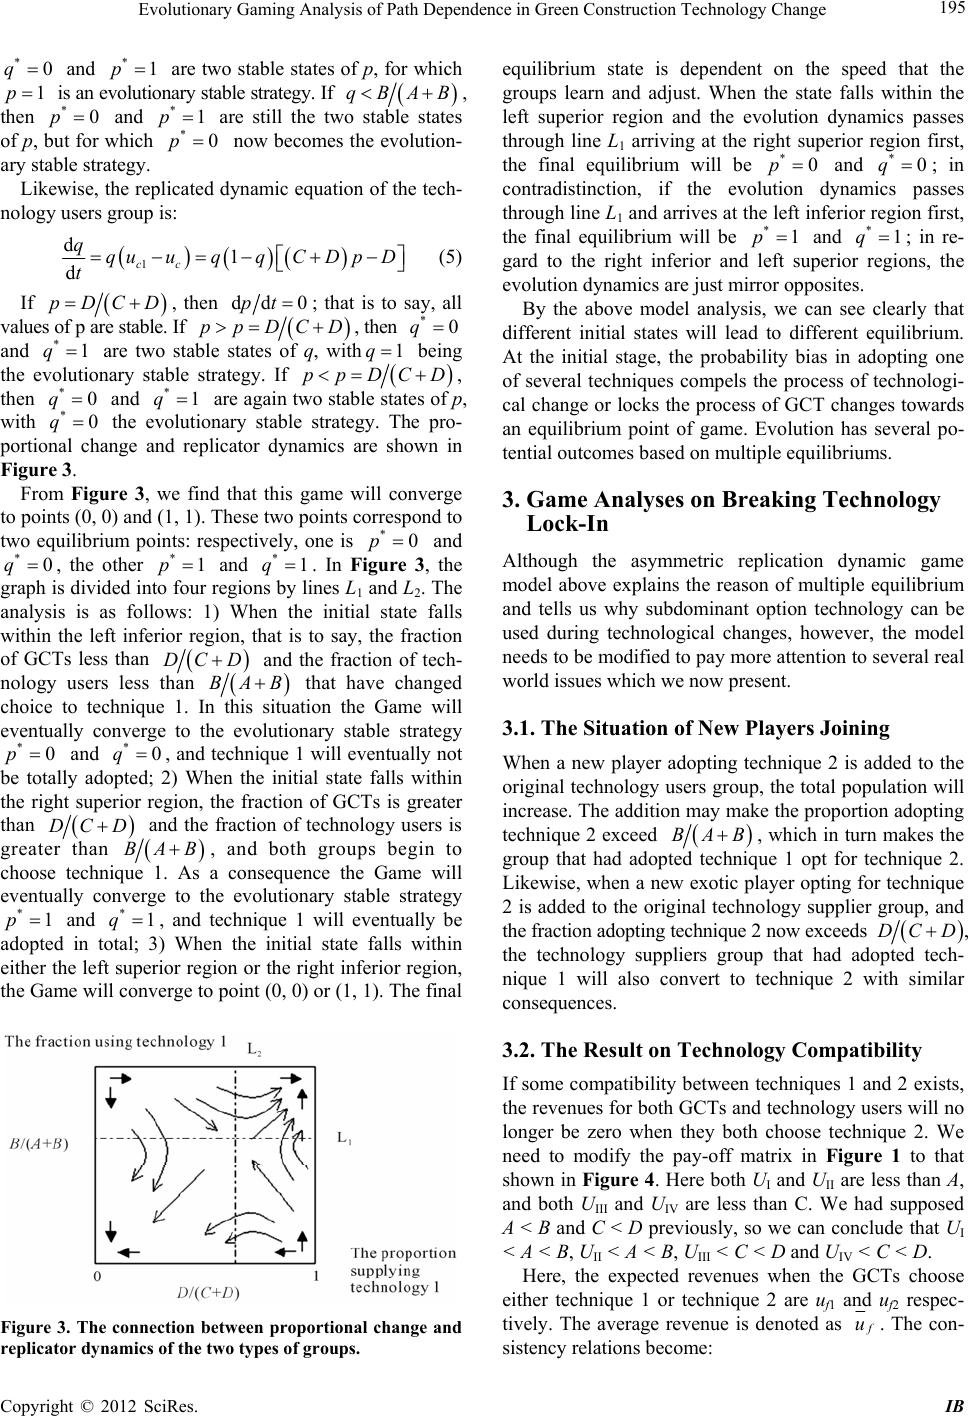 Evolutionary Gaming Analysis of Path Dependence in Green Construction Technology Change 195 *0q 1p and are two stable states of p, for which is an evolutionary stable strategy. If *1p qBAB, then and are still the two stable states of p, but for which now becomes the evolution- ary stable strategy. *0p*1 *0p p Likewise, the replicated dynamic equation of the tech- nology users group is: cc u d1 d qqCDp D t 1 qu q (5) If pDCD , then dd 0pt; that is to say, all values of p are stable. If ppDCD , then *0q and are two stable states of q, with * q11q being the evolutionary stable strategy. If ppD CD, then and are again two stable states of p, with the evolutionary stable strategy. The pro- portional change and replicator dynamics are shown in Figure 3. * q q0 *0 * q1 From Figure 3, we find that this game will converge to points (0, 0) and (1, 1). These two points correspond to two equilibrium points: respectively, one is *0p and , the other and . In Figure 3, the graph is divided into four regions by lines L1 and L2. The analysis is as follows: 1) When the initial state falls within the left inferior region, that is to say, the fraction of GCTs less than *0q*1 p*1q DC D and the fraction of tech- nology users less than BAB that have changed choice to technique 1. In this situation the Game will eventually converge to the evolutionary stable strategy and , and technique 1 will eventually not be totally adopted; 2) When the initial state falls within the right superior region, the fraction of GCTs is greater than *0p*0q DC D and the fraction of technology users is greater than BAB, and both groups begin to choose technique 1. As a consequence the Game will eventually converge to the evolutionary stable strategy and q, and technique 1 will eventually be adopted in total; 3) When the initial state falls within either the left superior region or the right inferior region, the Game will converge to point (0, 0) or (1, 1). The final *1p*1 Figure 3. The connection between proportional change and replicator dynamics of the two types of groups. equilibrium state is dependent on the speed that the groups learn and adjust. When the state falls within the left superior region and the evolution dynamics passes through line L1 arriving at the right superior region first, the final equilibrium will be and *0p*0q ; in contradistinction, if the evolution dynamics passes through line L1 and arrives at the left inferior region first, the final equilibrium will be and *1p*1q ; in re- gard to the right inferior and left superior regions, the evolution dynamics are just mirror opposites. By the above model analysis, we can see clearly that different initial states will lead to different equilibrium. At the initial stage, the probability bias in adopting one of several techniques compels the process of technologi- cal change or locks the process of GCT changes towards an equilibrium point of game. Evolution has several po- tential outcomes based on multiple equilibriums. 3. Game Analyses on Breaking Technology Lock-In Although the asymmetric replication dynamic game model above explains the reason of multiple equilibrium and tells us why subdominant option technology can be used during technological changes, however, the model needs to be modified to pay more attention to several real world issues which we now present. 3.1. The Situation of New Players Joining When a new player adopting technique 2 is added to the original technology users group, the total population will increase. The addition may make the proportion adopting technique 2 exceed BAB, which in turn makes the group that had adopted technique 1 opt for technique 2. Likewise, when a new exotic player opting for technique 2 is added to the original technology supplier group, and the fraction adopting technique 2 now exceeds DC D , the technology suppliers group that had adopted tech- nique 1 will also convert to technique 2 with similar consequences. 3.2. The Result on Technology Compatibility If some compatibility between techniques 1 and 2 exists, the revenues for both GCTs and technology users will no longer be zero when they both choose technique 2. We need to modify the pay-off matrix in Figure 1 to that shown in Figure 4. Here both UI and UII are less than A, and both UIII and UIV are less than C. We had supposed A < B and C < D previously, so we can conclude that UI < A < B, UII < A < B, UIII < C < D and UIV < C < D. Here, the expected revenues when the GCTs choose either technique 1 or technique 2 are uf1 and uf2 respec- tively. The average revenue is denoted as f u. The con- sistency relations become: Copyright © 2012 SciRes. IB 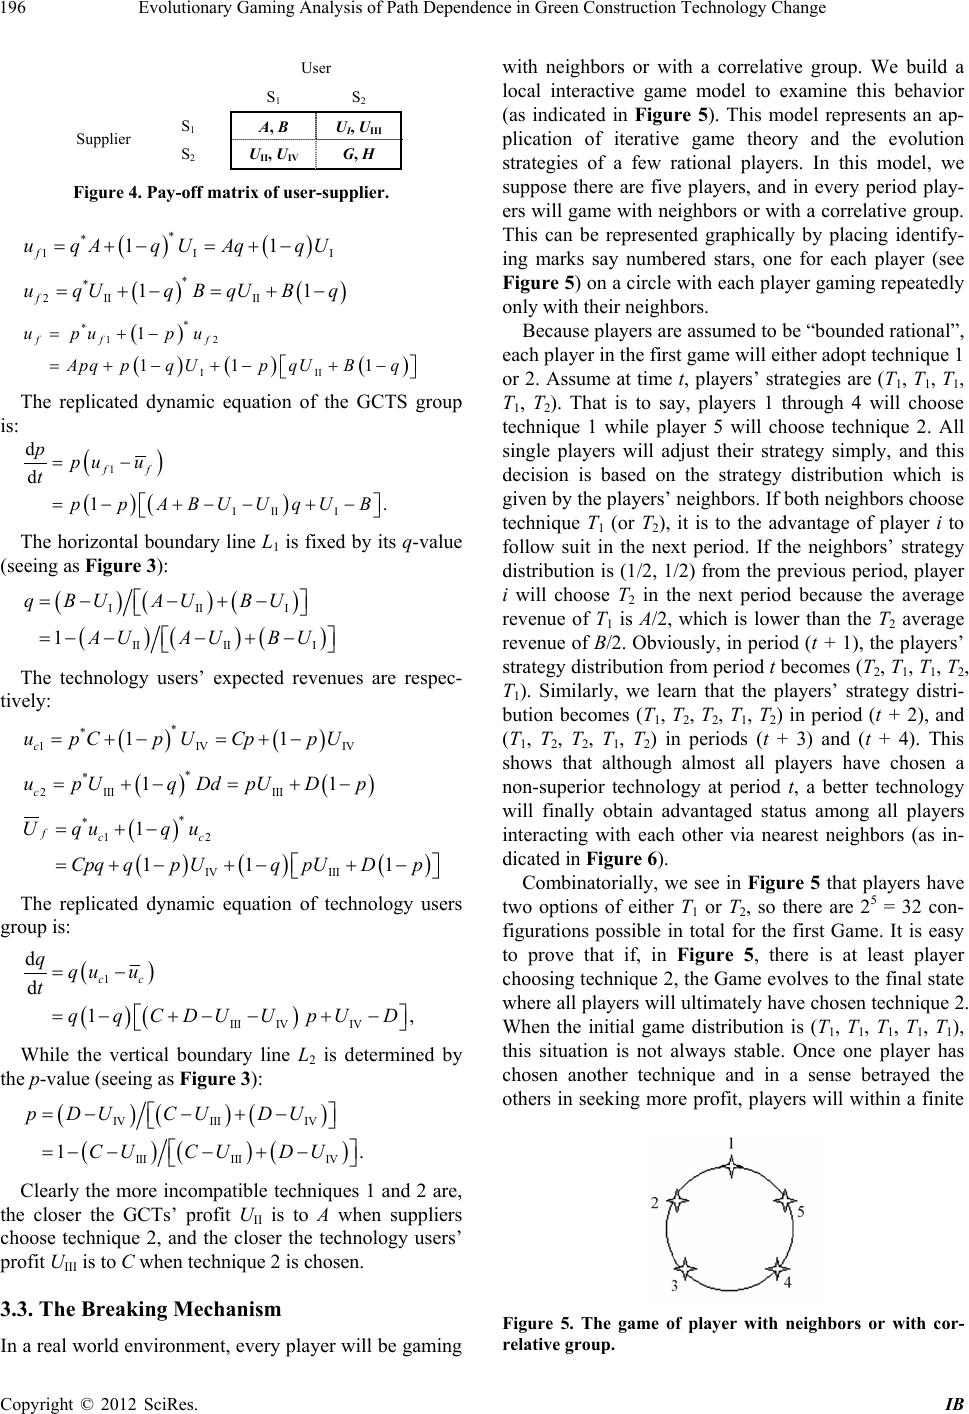 Evolutionary Gaming Analysis of Path Dependence in Green Construction Technology Change 196 User S 1 S 2 S1 A, B UI, UIII Supplier S2 UII, UIV G, H Figure 4. Pay-off matrix of user-supplier. * * 1I 11 f uqA qUAqqU I * * 2II II 11 f uqU qBqUBq * * 12 III 1 11 1 ff f upu pu A pqpq UpqUBq The replicated dynamic equation of the GCTS group is: 1 IIII d d 1 ff ppu u t . p pABUUqUB The horizontal boundary line L1 is fixed by its q-value (seeing as Figure 3): IIII IIII I 1 qBU AU BU AUAU BU The technology users’ expected revenues are respec- tively: * * 1IV 11 c upCpUCp pUIV 1 * * 2 IIIIII 1 c upU qDdpUDp * * 12 IV III 1 11 1 fcc Uqu qu Cpqq pUqpUDp The replicated dynamic equation of technology users group is: 1 III IVIV d d 1 cc qqu u t qqCDUUpUD , While the vertical boundary line L2 is determined by the p-value (seeing as Figure 3): IVIII IV III III IV 1. pDUCU DU CUCU DU Clearly the more incompatible techniques 1 and 2 are, the closer the GCTs’ profit UII is to A when suppliers choose technique 2, and the closer the technology users’ profit UIII is to C when technique 2 is chosen. 3.3. The Breaking Mechanism In a real world environment, every player will be gaming with neighbors or with a correlative group. We build a local interactive game model to examine this behavior (as indicated in Figure 5). This model represents an ap- plication of iterative game theory and the evolution strategies of a few rational players. In this model, we suppose there are five players, and in every period play- ers will game with neighbors or with a correlative group. This can be represented graphically by placing identify- ing marks say numbered stars, one for each player (see Figure 5) on a circle with each player gaming repeatedly only with their neighbors. Because players are assumed to be “bounded rational”, each player in the first game will either adopt technique 1 or 2. Assume at time t, players’ strategies are (T1, T1, T1, T1, T2). That is to say, players 1 through 4 will choose technique 1 while player 5 will choose technique 2. All single players will adjust their strategy simply, and this decision is based on the strategy distribution which is given by the players’ neighbors. If both neighbors choose technique T1 (or T2), it is to the advantage of player i to follow suit in the next period. If the neighbors’ strategy distribution is (1/2, 1/2) from the previous period, player i will choose T2 in the next period because the average revenue of T1 is A/2, which is lower than the T2 average revenue of B/2. Obviously, in period (t + 1), the players’ strategy distribution from period t becomes (T2, T1, T1, T2, T1). Similarly, we learn that the players’ strategy distri- bution becomes (T1, T2, T2, T1, T2) in period (t + 2), and (T1, T2, T2, T1, T2) in periods (t + 3) and (t + 4). This shows that although almost all players have chosen a non-superior technology at period t, a better technology will finally obtain advantaged status among all players interacting with each other via nearest neighbors (as in- dicated in Figure 6). Combinatorially, we see in Figure 5 that players have two options of either T1 or T2, so there are 25 = 32 con- figurations possible in total for the first Game. It is easy to prove that if, in Figure 5, there is at least player choosing technique 2, the Game evolves to the final state where all players will ultimately have chosen technique 2. When the initial game distribution is (T1, T1, T1, T1, T1), this situation is not always stable. Once one player has chosen another technique and in a sense betrayed the others in seeking more profit, players will within a finite Figure 5. The game of player with neighbors or with cor- relative group. Copyright © 2012 SciRes. IB 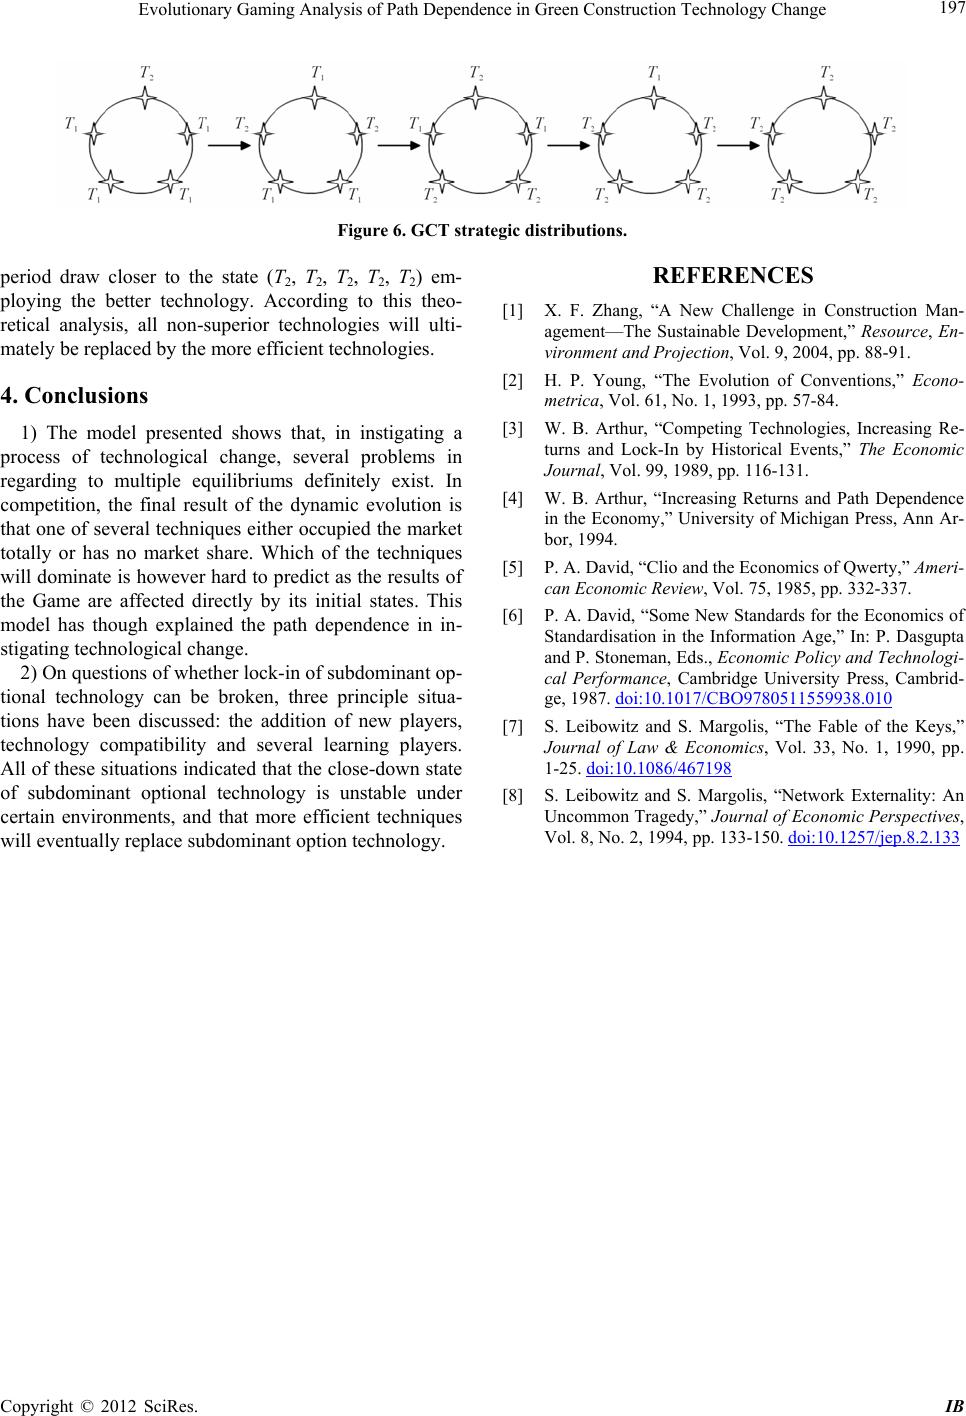 Evolutionary Gaming Analysis of Path Dependence in Green Construction Technology Change Copyright © 2012 SciRes. IB 197 Figure 6. GCT strategic distributions. REFERENCES period draw closer to the state (T2, T2, T2, T2, T2) em- ploying the better technology. According to this theo- retical analysis, all non-superior technologies will ulti- mately be replaced by the more efficient technologies. [1] X. F. Zhang, “A New Challenge in Construction Man- agement—The Sustainable Development,” Resource, En- vironment and Projection, Vol. 9, 2004, pp. 88-91. [2] H. P. Young, “The Evolution of Conventions,” Econo- metrica, Vol. 61, No. 1, 1993, pp. 57-84. 4. Conclusions [3] W. B. Arthur, “Competing Technologies, Increasing Re- turns and Lock-In by Historical Events,” The Economic Journal, Vol. 99, 1989, pp. 116-131. 1) The model presented shows that, in instigating a process of technological change, several problems in regarding to multiple equilibriums definitely exist. In competition, the final result of the dynamic evolution is that one of several techniques either occupied the market totally or has no market share. Which of the techniques will dominate is however hard to predict as the results of the Game are affected directly by its initial states. This model has though explained the path dependence in in- stigating technological change. [4] W. B. Arthur, “Increasing Returns and Path Dependence in the Economy,” University of Michigan Press, Ann Ar- bor, 1994. [5] P. A. David, “Clio and the Economics of Qwerty,” Ameri- can Economic Review, Vol. 75, 1985, pp. 332-337. [6] P. A. David, “Some New Standards for the Economics of Standardisation in the Information Age,” In: P. Dasgupta and P. Stoneman, Eds., Economic Policy and Technologi- cal Performance, Cambridge University Press, Cambrid- ge, 1987. doi:10.1017/CBO9780511559938.010 2) On questions of whether lock-in of subdominant op- tional technology can be broken, three principle situa- tions have been discussed: the addition of new players, technology compatibility and several learning players. All of these situations indicated that the close-down state of subdominant optional technology is unstable under certain environments, and that more efficient techniques will eventually replace subdominant option technology. [7] S. Leibowitz and S. Margolis, “The Fable of the Keys,” Journal of Law & Economics, Vol. 33, No. 1, 1990, pp. 1-25. doi:10.1086/467198 [8] S. Leibowitz and S. Margolis, “Network Externality: An Uncommon Tragedy,” Journal of Economic Perspectives, Vol. 8, No. 2, 1994, pp. 133-150. doi:10.1257/jep.8.2.133 |