

Paper Menu >>
Journal Menu >>
 Vol.2, No.7, 681-687 (2010) Natural Science http://dx.doi.org/10.4236/ns.2010.27084 Copyright © 2010 SciRes. OPEN ACCESS Impacts of oasis on the atmospheric hydrological cycle over the nearby desert Qiang Zhang1,2,3*, Yuhe Nan2, Sheng Wang1,3 1Key Laboratory of Arid Climatic Changes and Disaster Reduction of Gansu Province, Institute of Arid Meteorology, China Meteorological Administration, Lan Zhou, China; *Corresponding Author: [email protected] 2College of Atmospheric Science, Lan Zhou University, Lan Zhou, China 3Meteorological Bureau of Gansu Province, Lan Zhou, China Received 22 February 2010; revised 23 April 2010; accepted 28 April 2010. ABSTRACT Using the data of “A field experiment on land- atmosphere interaction over arid region in Northwest China” carried out in Dunhuang of Gansu Province from May to June 2000; Char- acteristics of the atmospheric humidity over desert and Gobi near oasis in the Northwest China Arid Region are analyzed. According to the difference of the characteristics in different wind directions, the impacts of oasis on at- mospheric hydrological cycle over desert and Gobi near it are revealed. The relation of at- mosphere inverse humidity and negative water vapor flux to wind direction and atmospheric stability is studied. It shows that distribution of the atmosphere inverse humidity is inconsistent with that of the negative water vapor flux; some- times 1-hour-average value demonstrates the characteristic of counter-gradient transfer. And the diurnal variation of distribution of the coun- ter-gradient transfer and the effect of atmos- pheric stability on the counter-gradient transfer are also given. Keywords: Desert or Gobi; Hydrologic Cycle; Atmospheric Inverse Humidity; Negative Water Vapor Flux; Counter-Gradient Transfer 1. INTRODUCTION Oasis is one of the underlying heterogeneous factors. It directly affects the pattern of the atmospheric energy and hydrology transfer over grid points in the region in a model [1-3]. The interaction of the oasis system and the desert system is relative to the maintenance and degen- eration processes of oasis ecology system. The special microclimate characteristics and the hydrological cycle mechanism formed under the condition of the interaction are two of the important natural factors (except the fac- tor of water resource) which maintain the oasis system [4-6]. Some special interaction processes between oasis and desert have been found in some experiments and studies carried out in the Northwest China Arid Region [4-12]. However, how the oasis impacts on the water vapor and energy transfer over desert or Gobi near it is still un- known. Most of the former field experiments were car- ried out in the arid climate region where annual precipi- tation is about 150 mm, but experiments in arider cli- mate regions where annual precipitation is blow 50 mm, such as Dunhuang, are scarce. Through analysis and study the data of “The Dun- huang Experiment”, the special physical rule of the land- surface under the interaction between oasis and desert near it as well as the ecological maintenance mechanism of oasis will be discussed in the following passages. 2. OBSERVATION DATA AND ANALYTICAL METHOD The data analyzed in this paper is from a 20-day inten- sive observation experiment in Dunhuang Gobi micro- meteorological central station from May 25 to June 17, 2000 (briefly, “The Dunhuang Experiment”), which is a part of “Land-atmosphere Interactive Field Experiment over Arid Region of Northwest China”. The station is located at 40°10′ N, 94°31′ E. Its surface elevation is 1150 meters above sea level. It lies in the flat Shuang- dunzi Gobi west to Dunhuang oasis, about 7 km to the edge of the oasis. Annual precipitation is about 40 mm and annual potential evaporation is about 3400 mm. Its main wind direction is east, generally occurring with the frequency of more than 50 percent, so the oasis strongly affects the atmosphere over the observation field. The data include the gradients of wind, temperature and hu- 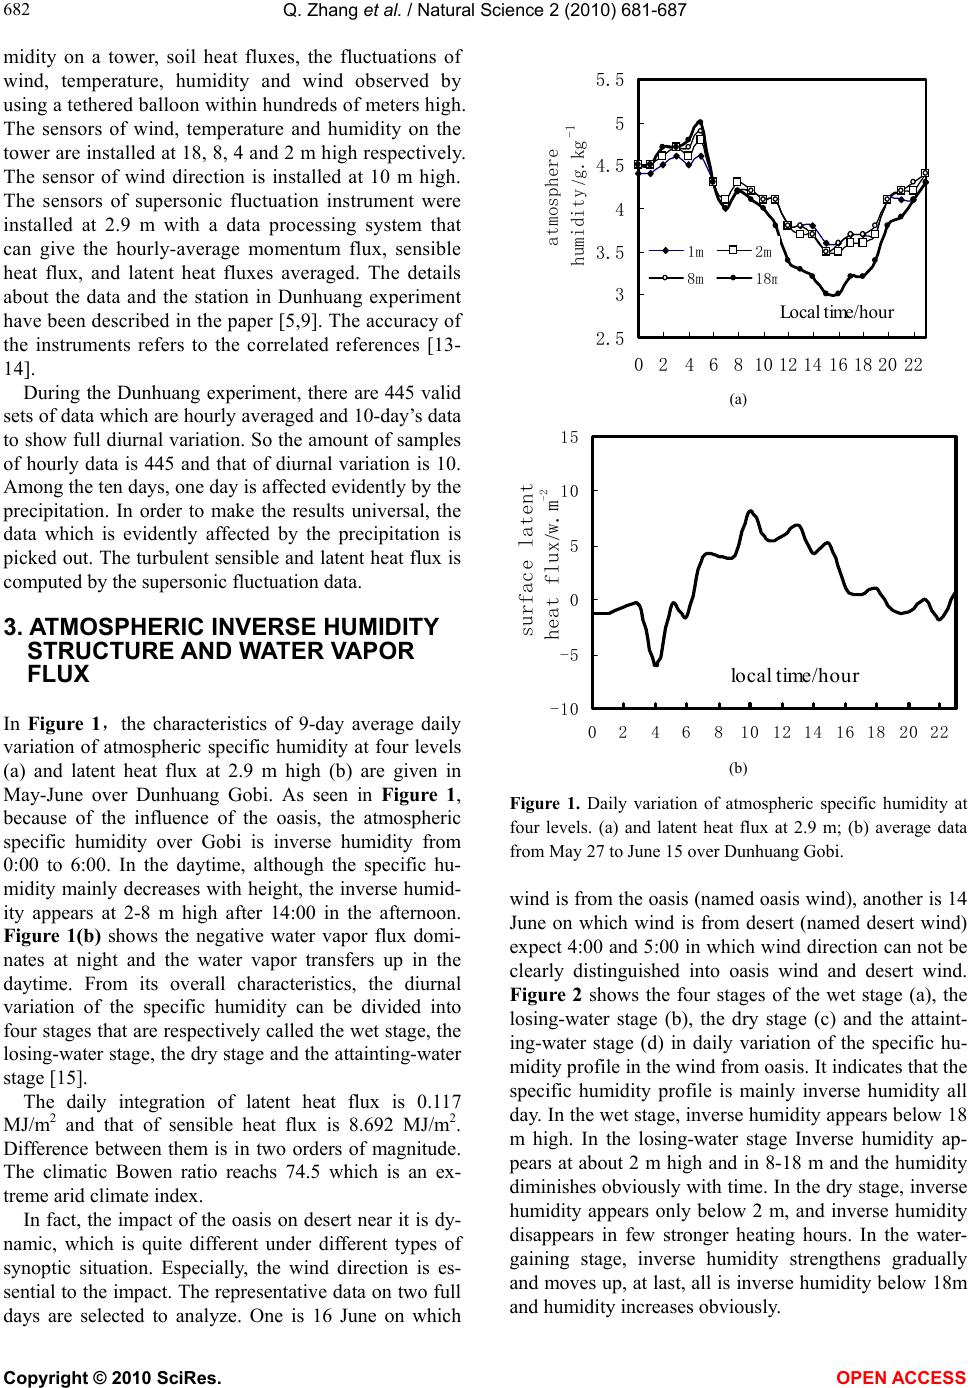 Q. Zhang et al. / Natural Science 2 (2010) 681-687 Copyright © 2010 SciRes. OPEN ACCESS 682 midity on a tower, soil heat fluxes, the fluctuations of wind, temperature, humidity and wind observed by using a tethered balloon within hundreds of meters high. The sensors of wind, temperature and humidity on the tower are installed at 18, 8, 4 and 2 m high respectively. The sensor of wind direction is installed at 10 m high. The sensors of supersonic fluctuation instrument were installed at 2.9 m with a data processing system that can give the hourly-average momentum flux, sensible heat flux, and latent heat fluxes averaged. The details about the data and the station in Dunhuang experiment have been described in the paper [5,9]. The accuracy of the instruments refers to the correlated references [13- 14]. During the Dunhuang experiment, there are 445 valid sets of data which are hourly averaged and 10-day’s data to show full diurnal variation. So the amount of samples of hourly data is 445 and that of diurnal variation is 10. Among the ten days, one day is affected evidently by the precipitation. In order to make the results universal, the data which is evidently affected by the precipitation is picked out. The turbulent sensible and latent heat flux is computed by the supersonic fluctuation data. 3. ATMOSPHERIC INVERSE HUMIDITY STRUCTURE AND WATER VAPOR FLUX In Figure 1,the characteristics of 9-day average daily variation of atmospheric specific humidity at four levels (a) and latent heat flux at 2.9 m high (b) are given in May-June over Dunhuang Gobi. As seen in Figure 1, because of the influence of the oasis, the atmospheric specific humidity over Gobi is inverse humidity from 0:00 to 6:00. In the daytime, although the specific hu- midity mainly decreases with height, the inverse humid- ity appears at 2-8 m high after 14:00 in the afternoon. Figure 1(b) shows the negative water vapor flux domi- nates at night and the water vapor transfers up in the daytime. From its overall characteristics, the diurnal variation of the specific humidity can be divided into four stages that are respectively called the wet stage, the losing-water stage, the dry stage and the attainting-water stage [15]. The daily integration of latent heat flux is 0.117 MJ/m2 and that of sensible heat flux is 8.692 MJ/m2. Difference between them is in two orders of magnitude. The climatic Bowen ratio reachs 74.5 which is an ex- treme arid climate index. In fact, the impact of the oasis on desert near it is dy- namic, which is quite different under different types of synoptic situation. Especially, the wind direction is es- sential to the impact. The representative data on two full days are selected to analyze. One is 16 June on which (a) 2.5 3 3.5 4 4.5 5 5.5 0 24 6 810121416182022 Local time/hour atmosphere humidity /g.kg-1 1m 2m 8m 18 m (a) (b) Figure 1. Daily variation of atmospheric specific humidity at four levels. (a) and latent heat flux at 2.9 m; (b) average data from May 27 to June 15 over Dunhuang Gobi. wind is from the oasis (named oasis wind), another is 14 June on which wind is from desert (named desert wind) expect 4:00 and 5:00 in which wind direction can not be clearly distinguished into oasis wind and desert wind. Figure 2 shows the four stages of the wet stage (a), the losing-water stage (b), the dry stage (c) and the attaint- ing-water stage (d) in daily variation of the specific hu- midity profile in the wind from oasis. It indicates that the specific humidity profile is mainly inverse humidity all day. In the wet stage, inverse humidity appears below 18 m high. In the losing-water stage Inverse humidity ap- pears at about 2 m high and in 8-18 m and the humidity diminishes obviously with time. In the dry stage, inverse humidity appears only below 2 m, and inverse humidity disappears in few stronger heating hours. In the water- gaining stage, inverse humidity strengthens gradually and moves up, at last, all is inverse humidity below 18m and humidity increases obviously. (b) -10 -5 0 5 10 15 0246810121416182022 local time/hour surface latent heat flux/w.m-2 m-2 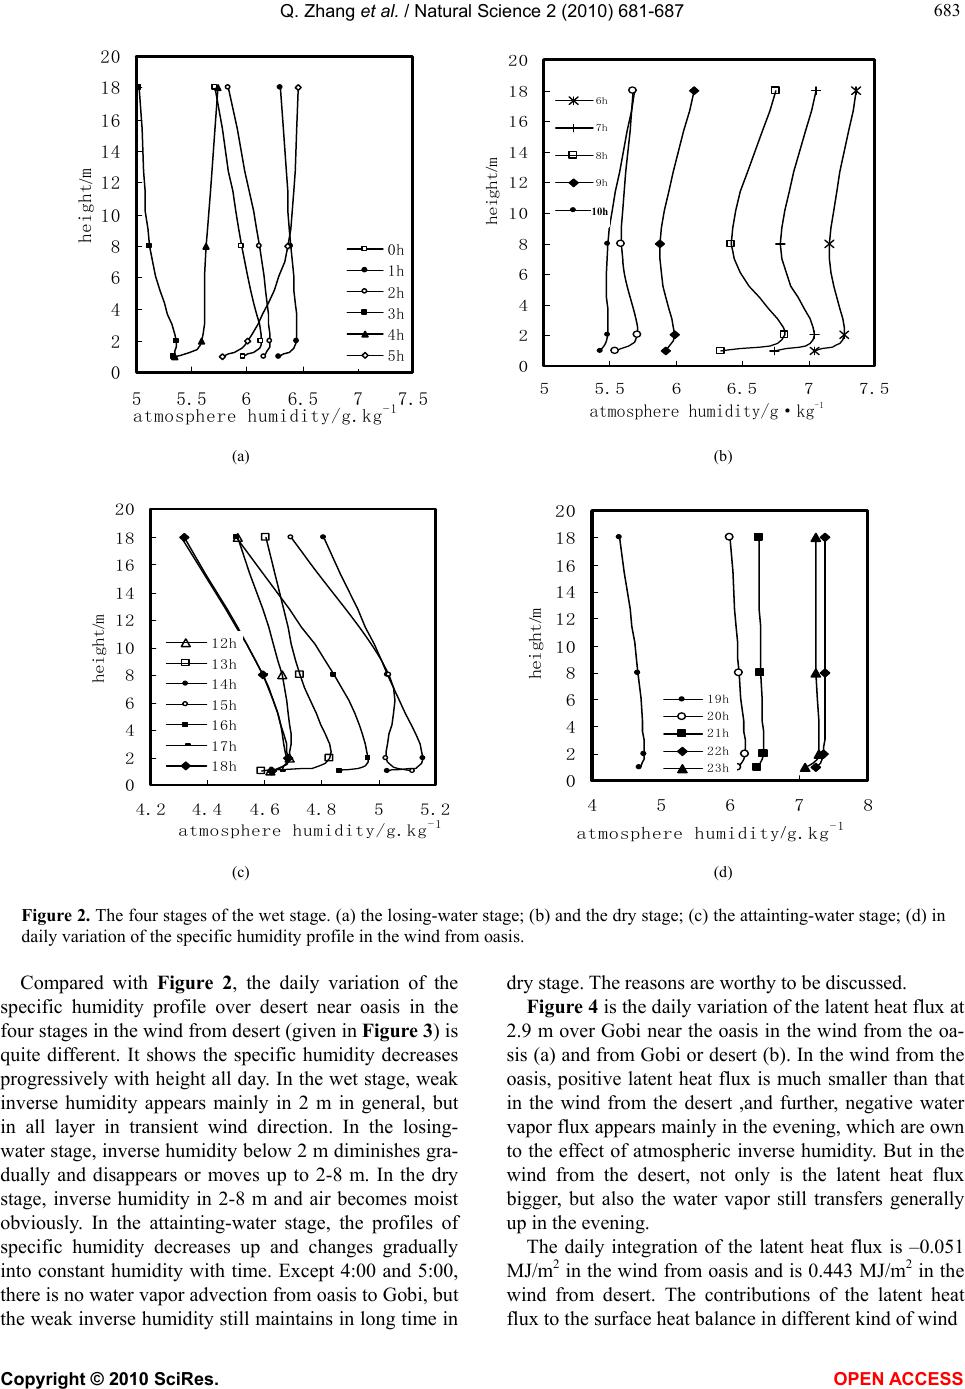 Q. Zhang et al. / Natural Science 2 (2010) 681-687 Copyright © 2010 SciRes. OPEN ACCESS 683 683 (a) 0 2 4 6 8 10 12 14 16 18 20 5 5.5 66.5 7 7.5 atmosphere humidity/g.kg -1 height/m 0h 1h 2h 3h 4h 5h (a) (b) (c) 0 2 4 6 8 10 12 14 16 18 20 4.2 4.44.6 4.855.2 atmosphere humidity/g.kg -1 height/m 12h 13h 14h 15h 16h 17h 18h (d) 0 2 4 6 8 10 12 14 16 18 20 45678 atmosphere humidity/g.kg -1 height/m 19h 20h 21h 22h 23h (c) (d) Figure 2. The four stages of the wet stage. (a) the losing-water stage; (b) and the dry stage; (c) the attainting-water stage; (d) in daily variation of the specific humidity profile in the wind from oasis. Compared with Figure 2, the daily variation of the specific humidity profile over desert near oasis in the four stages in the wind from desert (given in Figure 3) is quite different. It shows the specific humidity decreases progressively with height all day. In the wet stage, weak inverse humidity appears mainly in 2 m in general, but in all layer in transient wind direction. In the losing- water stage, inverse humidity below 2 m diminishes gra- dually and disappears or moves up to 2-8 m. In the dry stage, inverse humidity in 2-8 m and air becomes moist obviously. In the attainting-water stage, the profiles of specific humidity decreases up and changes gradually into constant humidity with time. Except 4:00 and 5:00, there is no water vapor advection from oasis to Gobi, but the weak inverse humidity still maintains in long time in dry stage. The reasons are worthy to be discussed. Figure 4 is the daily variation of the latent heat flux at 2.9 m over Gobi near the oasis in the wind from the oa- sis (a) and from Gobi or desert (b). In the wind from the oasis, positive latent heat flux is much smaller than that in the wind from the desert ,and further, negative water vapor flux appears mainly in the evening, which are own to the effect of atmospheric inverse humidity. But in the wind from the desert, not only is the latent heat flux bigger, but also the water vapor still transfers generally up in the evening. The daily integration of the latent heat flux is –0.051 MJ/m2 in the wind from oasis and is 0.443 MJ/m2 in the wind from desert. The contributions of the latent heat flux to the surface heat balance in different kind of wind (b) 0 2 4 6 8 10 12 14 16 18 20 5 5.56 6.57 7.5 atmosphere humidity/g. kg-1 height/m 6h 7h 8h 9h 10 h 10h atmosphere humidity/g·kg-1  Q. Zhang et al. / Natural Science 2 (2010) 681-687 Copyright © 2010 SciRes. OPEN ACCESS 684 (a) 0 2 4 6 8 10 12 14 16 18 20 55.566.577.5 atmosphere humidity/g.kg -1 height/m 0h 1h 2h 3h 4h 5h (b) 0 2 4 6 8 10 12 14 16 18 20 5 5.5 6 6.577.5 atmosphere humidity/g. kg-1 height/m 6h 7h 8h 9h 10h 11h atmos phere humidity/g·kg -1 (a) (b) (d) 0 2 4 6 8 10 12 14 16 18 20 45678 atmosphere humidity/g.kg -1 height/m 19h 20h 21h 22h 23h (c) (d) Figure 3. The four stages of the wet stage. (a) the losing-water stage; (b) the dry stage; (c) the attainting-water stage; (d) in daily variation of the specific humidity profile in the wind from desert. directions are completely different. When the latent heat flux is converted to the water vapor flux, its daily inte- gration is –0.0155 mm in the wind from the oasis and is 0.1355 mm in the wind from desert. In the common synoptic background annual evaporation over desert and Gobi is bigger than the climatic mean value without the infect of the oasis. This result means that it is the effect of the oasis makes the climatic state and the vegtation ecological type better in the desert region near the oasis than that in dersert or Gobi. It can be called the clmatic effect of inverse humidity. Dunhuang Oasis is smaller, so maybe its climatic effect isn’t more evidient than that of bigger or more prosperous oasis. The point isn’t found in former relative studies on arid region. -15 -10 -5 0 5 10 15 20 0246810 12 14 16 18 20 22 local time/hour surface latent flux/w.m -2 desert wind oasis wind Figure 4. (a) Characteristics of daily variation of the latent heat flux at 2.9 m over Gobi in the wind from oasis; (b) and from Gobi or desert. (c) 0 2 4 6 8 10 12 14 16 18 20 2 2.5 3 3.5 atmosphere humidity/g.kg-1 height/m 12h 13h 14h 15h 16h 17h 18h atmosphere humidity/g·kg-1 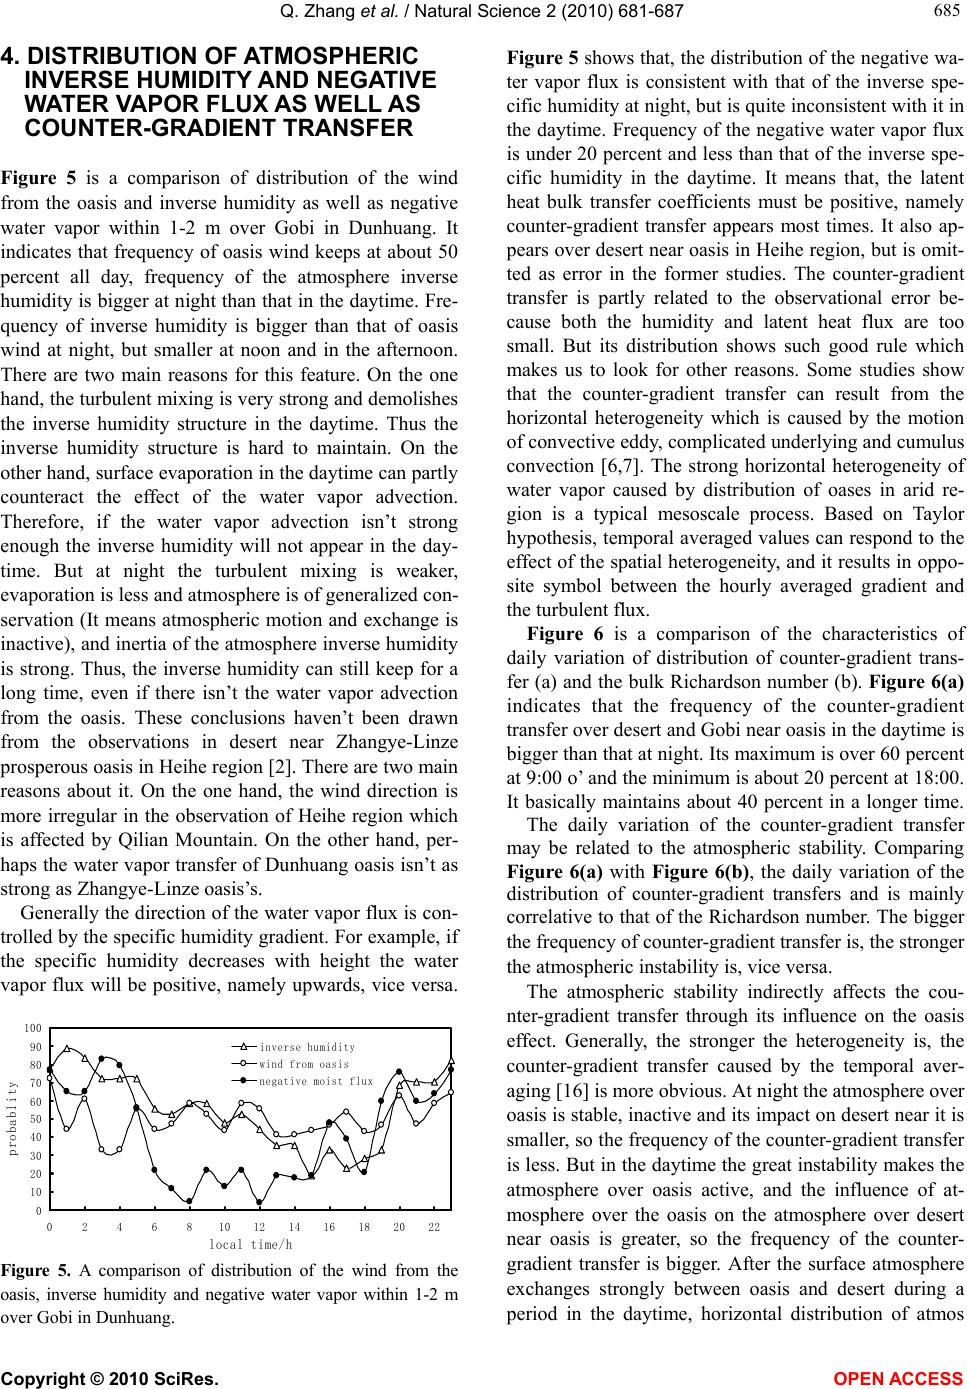 Q. Zhang et al. / Natural Science 2 (2010) 681-687 Copyright © 2010 SciRes. OPEN ACCESS 685 685 4. DISTRIBUTION OF ATMOSPHERIC INVERSE HUMIDITY AND NEGATIVE WATER VAPOR FLUX AS WELL AS COUNTER-GRADIENT TRANSFER Figure 5 is a comparison of distribution of the wind from the oasis and inverse humidity as well as negative water vapor within 1-2 m over Gobi in Dunhuang. It indicates that frequency of oasis wind keeps at about 50 percent all day, frequency of the atmosphere inverse humidity is bigger at night than that in the daytime. Fre- quency of inverse humidity is bigger than that of oasis wind at night, but smaller at noon and in the afternoon. There are two main reasons for this feature. On the one hand, the turbulent mixing is very strong and demolishes the inverse humidity structure in the daytime. Thus the inverse humidity structure is hard to maintain. On the other hand, surface evaporation in the daytime can partly counteract the effect of the water vapor advection. Therefore, if the water vapor advection isn’t strong enough the inverse humidity will not appear in the day- time. But at night the turbulent mixing is weaker, evaporation is less and atmosphere is of generalized con- servation (It means atmospheric motion and exchange is inactive), and inertia of the atmosphere inverse humidity is strong. Thus, the inverse humidity can still keep for a long time, even if there isn’t the water vapor advection from the oasis. These conclusions haven’t been drawn from the observations in desert near Zhangye-Linze prosperous oasis in Heihe region [2]. There are two main reasons about it. On the one hand, the wind direction is more irregular in the observation of Heihe region which is affected by Qilian Mountain. On the other hand, per- haps the water vapor transfer of Dunhuang oasis isn’t as strong as Zhangye-Linze oasis’s. Generally the direction of the water vapor flux is con- trolled by the specific humidity gradient. For example, if the specific humidity decreases with height the water vapor flux will be positive, namely upwards, vice versa. 0 10 20 30 40 50 60 70 80 90 100 0 2 4 6 810121416182022 local time/h probablity inverse humidity wind from oasis ne g ative moist flux Figure 5. A comparison of distribution of the wind from the oasis, inverse humidity and negative water vapor within 1-2 m over Gobi in Dunhuang. Figure 5 shows that, the distribution of the negative wa- ter vapor flux is consistent with that of the inverse spe- cific humidity at night, but is quite inconsistent with it in the daytime. Frequency of the negative water vapor flux is under 20 percent and less than that of the inverse spe- cific humidity in the daytime. It means that, the latent heat bulk transfer coefficients must be positive, namely counter-gradient transfer appears most times. It also ap- pears over desert near oasis in Heihe region, but is omit- ted as error in the former studies. The counter-gradient transfer is partly related to the observational error be- cause both the humidity and latent heat flux are too small. But its distribution shows such good rule which makes us to look for other reasons. Some studies show that the counter-gradient transfer can result from the horizontal heterogeneity which is caused by the motion of convective eddy, complicated underlying and cumulus convection [6,7]. The strong horizontal heterogeneity of water vapor caused by distribution of oases in arid re- gion is a typical mesoscale process. Based on Taylor hypothesis, temporal averaged values can respond to the effect of the spatial heterogeneity, and it results in oppo- site symbol between the hourly averaged gradient and the turbulent flux. Figure 6 is a comparison of the characteristics of daily variation of distribution of counter-gradient trans- fer (a) and the bulk Richardson number (b). Figure 6(a) indicates that the frequency of the counter-gradient transfer over desert and Gobi near oasis in the daytime is bigger than that at night. Its maximum is over 60 percent at 9:00 o’ and the minimum is about 20 percent at 18:00. It basically maintains about 40 percent in a longer time. The daily variation of the counter-gradient transfer may be related to the atmospheric stability. Comparing Figure 6(a) with Figure 6(b), the daily variation of the distribution of counter-gradient transfers and is mainly correlative to that of the Richardson number. The bigger the frequency of counter-gradient transfer is, the stronger the atmospheric instability is, vice versa. The atmospheric stability indirectly affects the cou- nter-gradient transfer through its influence on the oasis effect. Generally, the stronger the heterogeneity is, the counter-gradient transfer caused by the temporal aver- aging [16] is more obvious. At night the atmosphere over oasis is stable, inactive and its impact on desert near it is smaller, so the frequency of the counter-gradient transfer is less. But in the daytime the great instability makes the atmosphere over oasis active, and the influence of at- mosphere over the oasis on the atmosphere over desert near oasis is greater, so the frequency of the counter- gradient transfer is bigger. After the surface atmosphere exchanges strongly between oasis and desert during a period in the daytime, horizontal distribution of atmos 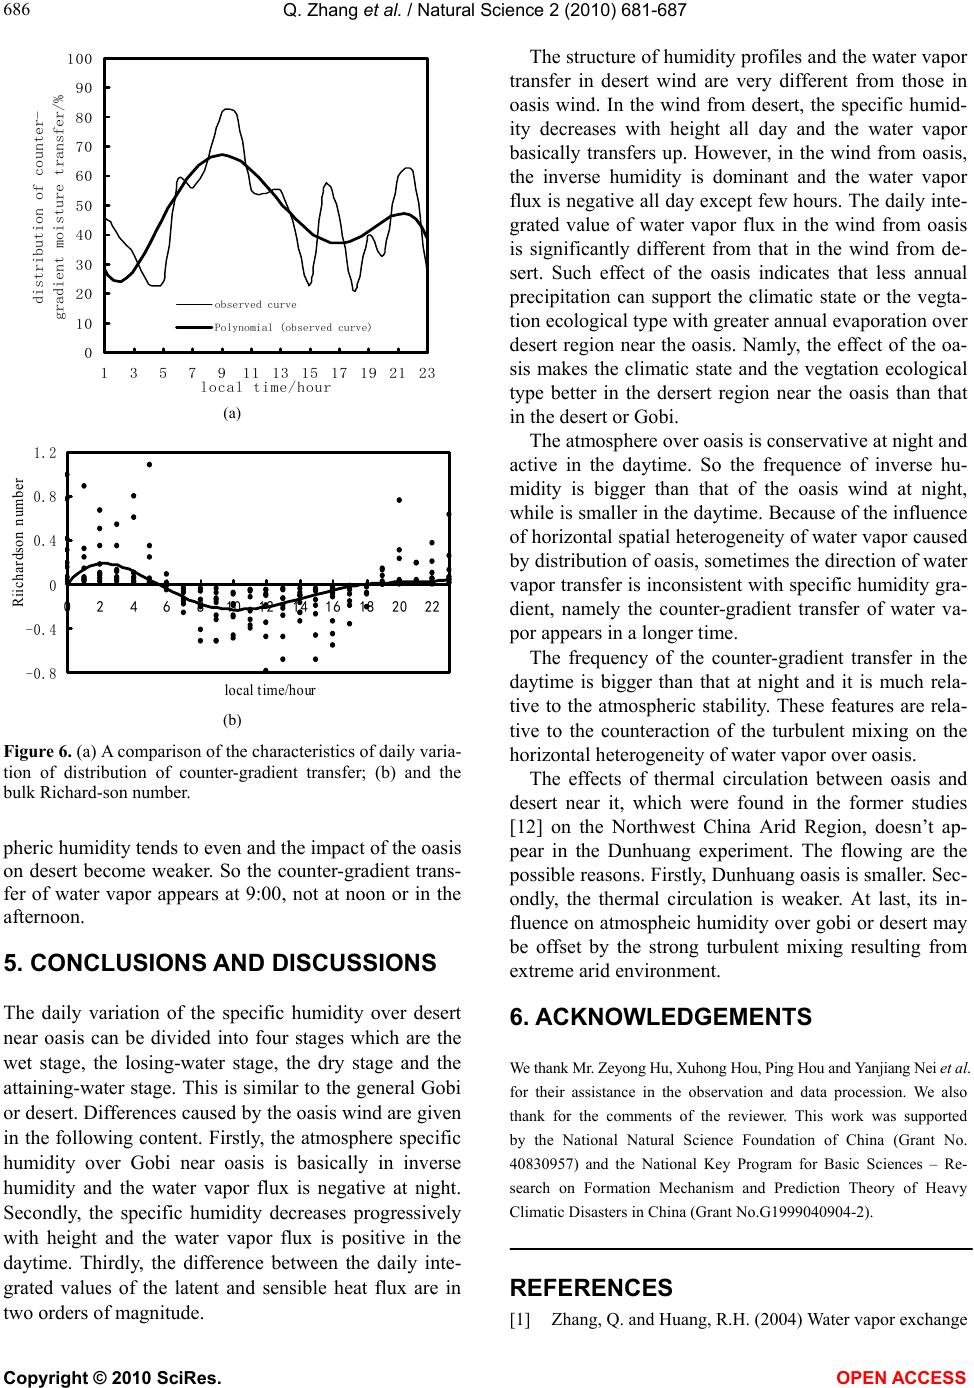 Q. Zhang et al. / Natural Science 2 (2010) 681-687 Copyright © 2010 SciRes. OPEN ACCESS 686 (a) 0 10 20 30 40 50 60 70 80 90 100 1357911 13 1517192123 local time/hour distribution of counter- gradient moisture transfer/% observed curve Polynomial (observed curve) (a) (b) -0.8 -0.4 0 0.4 0.8 1.2 0 246810121416182022 local time/hour Riichardson number (b) Figure 6. (a) A comparison of the characteristics of daily varia- tion of distribution of counter-gradient transfer; (b) and the bulk Richard-son number. pheric humidity tends to even and the impact of the oasis on desert become weaker. So the counter-gradient trans- fer of water vapor appears at 9:00, not at noon or in the afternoon. 5. CONCLUSIONS AND DISCUSSIONS The daily variation of the specific humidity over desert near oasis can be divided into four stages which are the wet stage, the losing-water stage, the dry stage and the attaining-water stage. This is similar to the general Gobi or desert. Differences caused by the oasis wind are given in the following content. Firstly, the atmosphere specific humidity over Gobi near oasis is basically in inverse humidity and the water vapor flux is negative at night. Secondly, the specific humidity decreases progressively with height and the water vapor flux is positive in the daytime. Thirdly, the difference between the daily inte- grated values of the latent and sensible heat flux are in two orders of magnitude. The structure of humidity profiles and the water vapor transfer in desert wind are very different from those in oasis wind. In the wind from desert, the specific humid- ity decreases with height all day and the water vapor basically transfers up. However, in the wind from oasis, the inverse humidity is dominant and the water vapor flux is negative all day except few hours. The daily inte- grated value of water vapor flux in the wind from oasis is significantly different from that in the wind from de- sert. Such effect of the oasis indicates that less annual precipitation can support the climatic state or the vegta- tion ecological type with greater annual evaporation over desert region near the oasis. Namly, the effect of the oa- sis makes the climatic state and the vegtation ecological type better in the dersert region near the oasis than that in the desert or Gobi. The atmosphere over oasis is conservative at night and active in the daytime. So the frequence of inverse hu- midity is bigger than that of the oasis wind at night, while is smaller in the daytime. Because of the influence of horizontal spatial heterogeneity of water vapor caused by distribution of oasis, sometimes the direction of water vapor transfer is inconsistent with specific humidity gra- dient, namely the counter-gradient transfer of water va- por appears in a longer time. The frequency of the counter-gradient transfer in the daytime is bigger than that at night and it is much rela- tive to the atmospheric stability. These features are rela- tive to the counteraction of the turbulent mixing on the horizontal heterogeneity of water vapor over oasis. The effects of thermal circulation between oasis and desert near it, which were found in the former studies [12] on the Northwest China Arid Region, doesn’t ap- pear in the Dunhuang experiment. The flowing are the possible reasons. Firstly, Dunhuang oasis is smaller. Sec- ondly, the thermal circulation is weaker. At last, its in- fluence on atmospheic humidity over gobi or desert may be offset by the strong turbulent mixing resulting from extreme arid environment. 6. ACKNOWLEDGEMENTS We thank Mr. Zeyong Hu, Xuhong Hou, Ping Hou and Yanjiang Nei et al. for their assistance in the observation and data procession. We also thank for the comments of the reviewer. This work was supported by the National Natural Science Foundation of China (Grant No. 40830957) and the National Key Program for Basic Sciences – Re- search on Formation Mechanism and Prediction Theory of Heavy Climatic Disasters in China (Grant No.G1999040904-2). REFERENCES [1] Zhang, Q. and Huang, R.H. (2004) Water vapor exchange 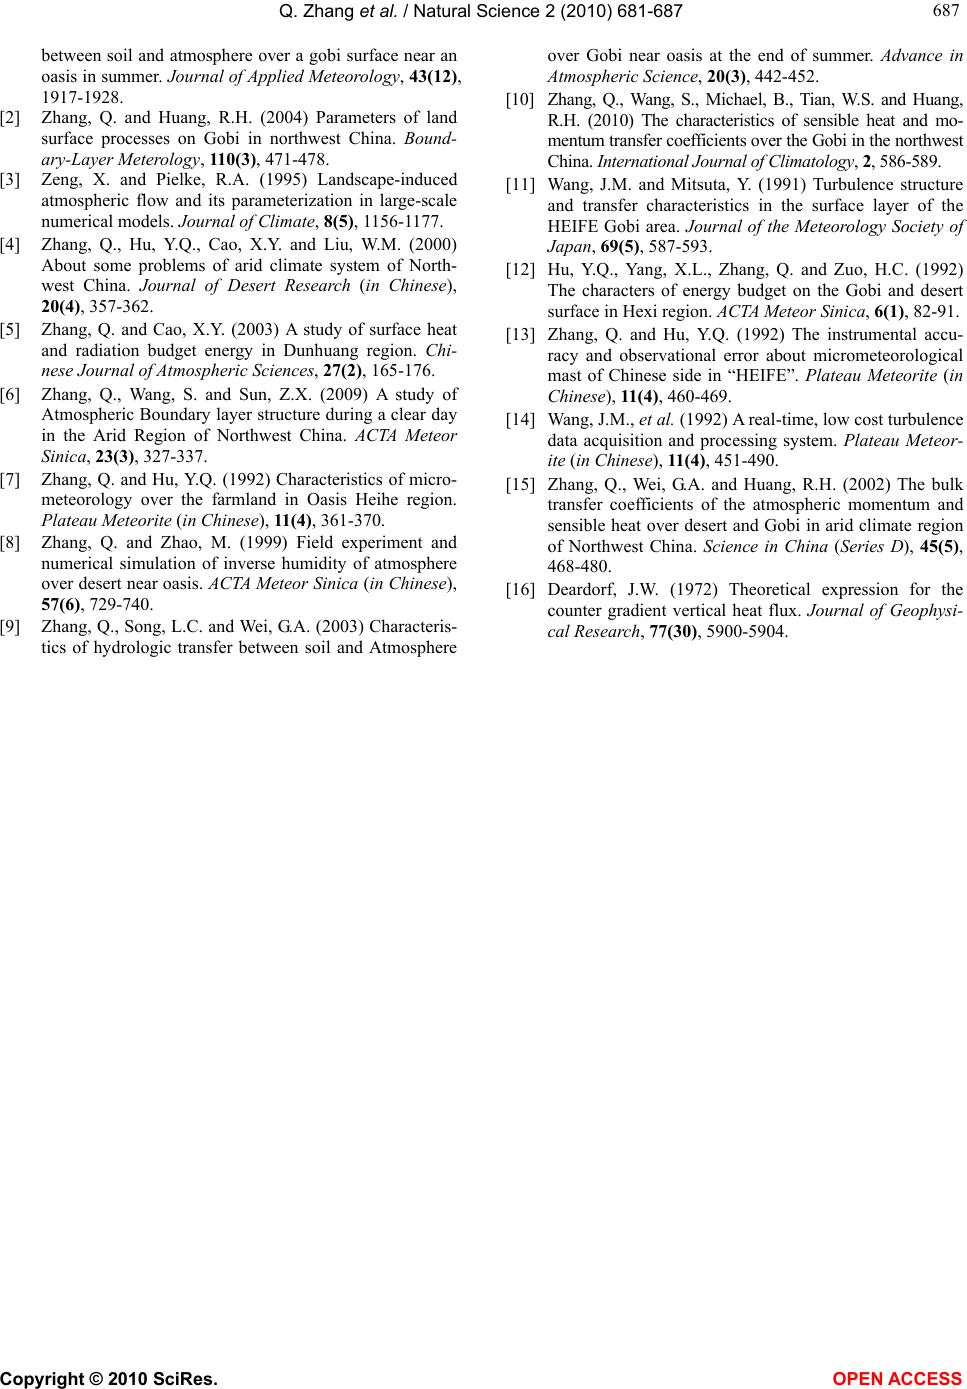 Q. Zhang et al. / Natural Science 2 (2010) 681-687 Copyright © 2010 SciRes. OPEN ACCESS 687 687 between soil and atmosphere over a gobi surface near an oasis in summer. Journal of Applied Meteorology, 43(12), 1917-1928. [2] Zhang, Q. and Huang, R.H. (2004) Parameters of land surface processes on Gobi in northwest China. Bound- ary-Layer Meterology, 110(3), 471-478. [3] Zeng, X. and Pielke, R.A. (1995) Landscape-induced atmospheric flow and its parameterization in large-scale numerical models. Journal of Climate, 8(5), 1156-1177. [4] Zhang, Q., Hu, Y.Q., Cao, X.Y. and Liu, W.M. (2000) About some problems of arid climate system of North- west China. Journal of Desert Research (in Chinese), 20(4), 357-362. [5] Zhang, Q. and Cao, X.Y. (2003) A study of surface heat and radiation budget energy in Dunhuang region. Chi- nese Journal of Atmospheric Sciences, 27(2), 165-176. [6] Zhang, Q., Wang, S. and Sun, Z.X. (2009) A study of Atmospheric Boundary layer structure during a clear day in the Arid Region of Northwest China. ACTA Meteor Sinica, 23(3), 327-337. [7] Zhang, Q. and Hu, Y.Q. (1992) Characteristics of micro- meteorology over the farmland in Oasis Heihe region. Plateau Meteorite (in Chinese), 11(4 ), 361-370. [8] Zhang, Q. and Zhao, M. (1999) Field experiment and numerical simulation of inverse humidity of atmosphere over desert near oasis. ACTA Meteor Sinica (in Chinese), 57(6), 729-740. [9] Zhang, Q., Song, L.C. and Wei, G.A. (2003) Characteris- tics of hydrologic transfer between soil and Atmosphere over Gobi near oasis at the end of summer. Advance in Atmospheric Science, 20(3), 442-452. [10] Zhang, Q., Wang, S., Michael, B., Tian, W.S. and Huang, R.H. (2010) The characteristics of sensible heat and mo- mentum transfer coefficients over the Gobi in the northwest China. International Journal of Climatology, 2, 586-589. [11] Wang, J.M. and Mitsuta, Y. (1991) Turbulence structure and transfer characteristics in the surface layer of the HEIFE Gobi area. Journal of the Meteorology Society of Japan, 69(5), 587-593. [12] Hu, Y.Q., Yang, X.L., Zhang, Q. and Zuo, H.C. (1992) The characters of energy budget on the Gobi and desert surface in Hexi region. ACTA Meteor Sinica, 6(1), 82-91. [13] Zhang, Q. and Hu, Y.Q. (1992) The instrumental accu- racy and observational error about micrometeorological mast of Chinese side in “HEIFE”. Plateau Meteorite (in Chinese), 11(4), 460-469. [14] Wang, J.M., et al. (1992) A real-time, low cost turbulence data acquisition and processing system. Plateau Meteor- ite (in Chinese), 11(4), 451-490. [15] Zhang, Q., Wei, G.A. and Huang, R.H. (2002) The bulk transfer coefficients of the atmospheric momentum and sensible heat over desert and Gobi in arid climate region of Northwest China. Science in China (Series D), 45(5), 468-480. [16] Deardorf, J.W. (1972) Theoretical expression for the counter gradient vertical heat flux. Journal of Geophysi- cal Research, 77(30), 5900-5904. |