

Paper Menu >>
Journal Menu >>
 Open Journal of Pediatrics, 2012, 2, 197-213 OJPed http://dx.doi.org/10.4236/ojped.2012.23033 Published Online September 2012 (http://www.SciRP.org/journal/ojped/) The effects of perfluorocarbon dosing strategy on cerebral blood flow when starting partial liquid ventilation: A randomised, controlled, experimental study Mark W. Davies1,2,3, Kimble R. Dunster1,4,5, John F. Fraser2,5, Paul B. Colditz3 1Grantley Stable Neonatal Unit, Royal Brisbane and Women’s Hospital, Brisbane, Australia 2Department of Paediatrics & Child Health, The University of Queensland, Brisbane, Australia 3Perinatal Research Centre, The University of Queensland, Royal Brisbane and Women’s Hospital, Brisbane, Australia 4Medical Engineering Research Facility, Queensland University of Technology, Brisbane, Australia 5Critical Care Research Group, The Prince Charles Hospital, Brisbane, Australia Email: [email protected] Received 14 May 2012; revised 16 July 2012; accepted 25 July 2012 ABSTRACT Introduction: Partial liquid ventilation may benefit the lung disease in preterm neonates but intratracheal instillation of perfluorocarbon increases cerebral blood flow and may cause brain injury. We aimed to deter- mine if the effects of perfluorocarbon administration on cerebral blood flow vary by dose-volume, rate of administration, endotracheal tube portal of entry, or closely targeting PaCO2. Methods: Forty-two dosing events (in eleven rabbits) were randomised to different dosing strategies, including a sham (i.e., placebo/con- trol) dose of air over 20 min, 20 mL/kg of perfluoro- carbon slowly over 20 min, 10 mL/kg of perfluoro- carbon slowly over 20 min, 10 mL/kg of perfluoro- carbon moderately fast over 10 min, 10 mL/kg of per- fluorocarbon rapidly over 5 min, 10 mL/kg of per- fluorocarbon slowly over 20 min via the endotracheal tube tip lumen (as opposed to the proximal end of the tube used in all other groups), or 10 mL/kg of per- fluorocarbon slowly over 20 min whilst targeting a PaCO2 of 45 - 50 mmHg. Blood gases, haemo- dynamics, cortical cerebral blood flow and carotid flow were recorded continuously for 30 minutes from the start of each dose. Results: Carotid flow increased with 20 mL/kg perfluorocarbon and cortical cerebral blood flow was significantly more variable. Carotid and cortical cerebral blood flow increased using 10 mL/kg or 20 mL/kg with no difference between the two dose-volumes. There was no difference in cerebral blood flow by rate of administration, but carotid blood flow was more variable during slow administration. There were no differences in the increase in cerebral blood flow by portal of entry. If PaCO2 was main- tained between 45 - 50 mmHg there was no increase in cerebral blood flow and there was less variable carotid flow. Conclusions: Cerebral blood flow in- creases with perfluorocarbon dosing. This occurs regardless of the dose-volume of perfluorocarbon. These effects were mitigated by closely targeting PaCO2. Keywords: Cerebral Blood Flow; Fluorocarbons; Infant; Newborn Preterm; Partial Liquid Ventilation 1. INTRODUCTION Preterm infants, especially those born extremely preterm, require a great deal of support ex utero. They are often severely ill and their chances of survival are greatly reduced [1]. Many die because of general immaturity; as multiple organ systems, including the lungs, cannot adapt to extrauterine life. Many die of overt lung disease [1]. However, the positive pressure ventilation which they require to survive is often a cause of significant and persistent lung injury [2]. Partial liquid ventilation has been touted as an alter- native form of respiratory support for extremely immature lungs and severe lung disease: not only to provide a more effective form of respiratory support but to provide that support with much less lung injury [3]. A recent exper- imental study has renewed the promise that partial liquid ventilation has significant potential to alter the course of neonatal lung disease and reduce respiratory morbidity [4]. Extremely preterm infants are also prone to specific forms of brain injury such as intraventricular haemorrhage, periventricular leucomalacia and other types of white matter injury [5]. Rapid changes or disturbance of ven- tilation can lead to fluctuations in cerebral blood flow which have been shown to substantially increase the risk of brain injury [6,7]. OPEN ACCESS  M. W. Davies et al. / Open Journal of Pediatrics 2 (2012) 197-213 198 In a previous study we have shown that preterm lambs receiving a 30 mL/kg dose of tracheal perfluorocarbon liquid, given over 20 minutes at the start of partial liquid ventilation, had an increased cortical cerebral blood flow [8]. This did not seem to be due to any general haemo- dynamic disturbance, although the lambs that had tracheal perfluorocarbon did have a small, non-significant increase in arterial carbon dioxide [8]. The increase in cortical cerebral blood flow did not differ with varying doses of tracheal perfluorocarbon (20, 30 or 40 mL/kg given over 20 minutes) [9]. As with any treatment, the benefits of partial liquid ventilation will need to be weighed against any harm. It is known that increases in cerebral blood flow put very preterm infants at greater risk of intraventricular haemor- rhage and brain injury [6,7]. Any gains in using partial liquid ventilation to improve gas exchange should not be at the expense of a higher risk of brain injury. It may be that smaller doses of perfluorocarbon will allow adequate treatment of lung disease with minimal effects on cerebral blood flow. Also, regardless of the dose used, it may be that perfluorocarbon dosing can be optimised to minimise any effects on cerebral blood flow. Before its use in human preterm neonates, the effects on cerebral blood flow of partial liquid ventilation need to be determined in a relevant animal model. It has not been established whether different methods of giving the initial dose of perfluorocarbon affect the degree and duration of any changes in cerebral blood flow. We hypothesised that a 20 mL/kg dose of perfluo- rocarbon administered when starting partial liquid ven- tilation would disturb cerebral blood flow. Liquid ven- tilation starts when the perfluorocarbon liquid is intro- duced into the lungs. We also hypothesised that the degree and duration of changes in cerebral blood flow would vary with: the dose of perfluorocarbon administered; the duration over which the dose is given (5, 10 or 20 minutes); the portal of entry of the perfluorocarbon into the ETT (side-port on the ETT manifold versus an auxi- liary lumen further down the ETT); and whether, during pressure-controlled ventilation, the peak inspiratory pressure is adjusted to maintain PaCO2 or not. Our aims were to: 1) confirm in a rabbit model (with no lung disease) that administration of a dose of 20 mL/kg of perfluorocarbon during commencement of partial liquid ventilation increased cerebral blood flow and its variability; 2) investigate the effects of a lower initial dose (10 mL/kg versus 20 mL/kg) of perfluorocarbon on cerebral blood flow and its variability; 3) investigate the effects of different rates of ad- ministration of the initial dose of perfluorocarbon (10 mL/kg over 5, 10 or 20 minutes) on cerebral blood flow and its variability; 4) investigate the effects of the ETT portal of entry of the initial dose of perfluorocarbon on cerebral blood flow and its variability; 5) investigate the effects of adjusting the peak inspir- atory pressure to maintain the arterial carbon dioxide between 45 and 50 mmHg during the initial dose of perfluorocarbon on cerebral blood flow and its variability. 2. MATERIALS AND METHODS To study the effects of different dosing strategies of perfluorocarbon, we used the adult New Zealand white rabbit which is in the human neonatal weight-range (similar to the preterm lambs previously studied [8,9]). The necessary procedures and monitoring are readily performed in rabbits of this size. The use of an adult rabbit with no lung disease allows repeated study over many hours. 2.1. Animal Preparation Anaesthesia was induced in each rabbit with intra- muscular atropine (0.1 mg/kg) followed by intra-muscular Zoletil (tiletamine and zolazepam, 10 mg/kg) and xylazine (2 mg/kg). An intra-venous line (22 - 24 gauge Insyte catheter) was inserted into an ear vein and anaesthesia maintained with an infusion of propofol (0.5 mL/kg/hr). An intravenous infusion of 3 mL/kg/hr of 10% dextrose was given throughout. The rabbits were then intubated via a tracheostomy with a 3.0 HI-LO Jet multi-lumen endotracheal tube (MuLETT) [Mallinckrodt Inc, Argyle, New York, USA] with a ligature around the trachea (to prevent leakage). Mechanical ventilation was commenced as described below. Respiratory function was monitored with a VenTrak neonatal pneumotachograph and respir- atory mechanics monitor (Model 1550, Novametrix Medical Systems, Wallingford, Connecticut, USA). A NeoTrend catheter (Diametrics Medical, High Wycombe, UK), calibrated as per the manufacturer’s instructions, was then inserted into the descending aorta via the femoral artery. This allowed continuous mea- surement of intra-arterial oxygen tension (PaO2), carbon dioxide tension (PaCO2), pH, temperature, bicarbonate, base excess and oxygen saturation. The right common carotid artery was exposed and a 2 mm ultrasonic flow probe (Transonic 2SB) was placed around the right carotid artery and connected to the T206 Transonic Flowmeter (Transonic Systems Inc., Ithaca, New York, USA). Cerebral cortical blood flow was monitored using a laser Doppler probe (Oxford Array, Oxford Optronix, Oxford, UK) inserted into the parietal cortex (through a Copyright © 2012 SciRes. OPEN ACCESS  M. W. Davies et al. / Open Journal of Pediatrics 2 (2012) 197-213 199 burr hole half-way between a line joining the outer corner of the eye and top of the ear insertion, and the top of skull) and the probe was held in place as previously described [10]. Standard physiological monitoring included heart rate (ECG), oxygen saturation (peripheral pulse oximetry) and continuous arterial blood pressure. After completion of all dosing events the rabbit was killed with 5 mL pentobarbitone sodium (Lethabarb, 325 mg/mL). The mean (SD) duration from anaesthesia in- duction to pentobarbitone injection was 7.7 (0.74) hours. 2.2. Mechanical Ventilation The rabbits were ventilated with a neonatal ventilator (Bear Cub, Bear Medical Systems, Riverside, California) at 30 breaths per minute, peak inspiratory pressure (PIP) 12 cmH2O, positive end expiratory pressure (PEEP) 5 cmH2O, and inspiratory time of 0.75 seconds. The frac- tion of inspired oxygen (FiO2) was initially 0.21, in- creased as necessary to maintain pulse oximetry oxygen saturations between 94% and 97%. PIP was adjusted to maintain PaCO2 between 40 - 45 mmHg until the com- mencement of each dosing strategy phase. No further adjustment of ventilation, with the exception of FiO2, were allowed except during the PLV10-slow-proxi- mal-PC-adjust PIP dosing strategy (see below). 2.3. Perfluorocarbon Dose Volume The perfluorocarbon dose volumes were chosen to en- able comparisons with earlier studies in preterm lambs. We chose 20 mL/kg, as used in our earlier preterm lamb studies [9], in order to confirm similar effects of per- fluorocarbon dosing on cerebral blood flow. We then chose 10 mL/kg as the comparison dose as it was more easily removed from the lungs between dosing events and yet was in the range of doses with demonstrated ef- ficacy in animal studies. Dose-dependent improvement in lung function has been demonstrated during partial liquid ventilation but the majority of improvement in lung function has occurred with relatively small doses (up to ~10 mL/kg) [11,12]. In rabbits 9 - 12 mL/kg has been shown to improve lung function [12-14]. In animal models with no lung disease 10 mL/kg has been shown to disturb gas exchange less than 30 mL/kg and thus pro- vide a more stable model to study haemodynamic ef- fects [15]. 2.4. Group Allocation Each rabbit was allocated to multiple dosing strategies to reduce the number of animals used. Following pre- paration, each rabbit was randomly allocated a perfluo- rocarbon dosing strategy and then monitored for one minute before and 30 minutes after the start of each dosing event. After each dosing event (and washout period) each rabbit was randomly allocated to another perfluorocarbon dosing strategy. Eleven rabbits (mean SD weight of 4.0 0.59 kg) were randomised to up to six of the seven following dosing strategies: 1) A CONTROL-PC group which was given a sham (i.e., placebo/control) dose of air (10 mL/kg) over 20 min via the wye-piece at the proximal end of the ETT (see Figure 1) on pressure-controlled ventilation; 2) A PLV20-slow-proximal-PC group which was given 20 mL/kg of FC-77 slowly over 20 min via the wye- piece at the proximal end of the ETT on pressure-con- trolled ventilation; 3) A PLV10-slow-proximal-PC group which was given 10 mL/kg of FC-77 slowly over 20 min (0.5 mL/kg/min) via the wye-piece at the proximal end of the ETT on pressure-controlled ventilation; 4) A PLV10-faster-proximal-PC group which was given 10 mL/kg of FC-77 moderately fast over 10 min (1.0 mL/kg/min) via the wye-piece at the proximal end of the ETT on pressure-controlled ventilation; 5) A PLV10-rapid-proximal-PC group which was given 10 mL/kg of FC-77 rapidly over 5 min (2.0 mL/ kg/min) via the wye-piece at the proximal end of the ETT on pressure-controlled ventilation; 6) A PLV10-slow-tip-PC group which was given 10 mL/kg of FC-77 slowly over 20 min via ETT tip lumen (see Figure 1) on pressure-controlled ventilation; 7) A PLV10-slow-proximal-PC-adjust PIP group which was given 10 mL/kg of FC-77 slowly over 20 min via the wye-piece at the proximal end of the ETT with the PIP adjusted to maintain the PaCO2 between 45 and 50 mmHg on pressure-controlled ventilation. In groups 1 to 6 above no further adjustment of venti- lation (with the exception of FiO2) was allowed after the commencement of each dosing event studied. Portal of Entry The dose of perfluorocarbon is usually given through a sideport wye-piece on the ETT-connector at the proximal end of the endotracheal tube. In this study doses of per- fluorocarbon were given via one of two portals, either through a wye-piece at the proximal end of the ETT or through the ETT tip lumen (Figure 1). The use of a wye-piece was necessary to allow the pneumotachograph to be fitted between the ETT-circuit manifold and the ETT connector and prevent reflux of perfluorocarbon into the pneumotachograph during instillation. 2.5. Washout Each dosing event was monitored for 30 minutes from the start of perfluorocarbon dosing. After each dosing Copyright © 2012 SciRes. OPEN ACCESS 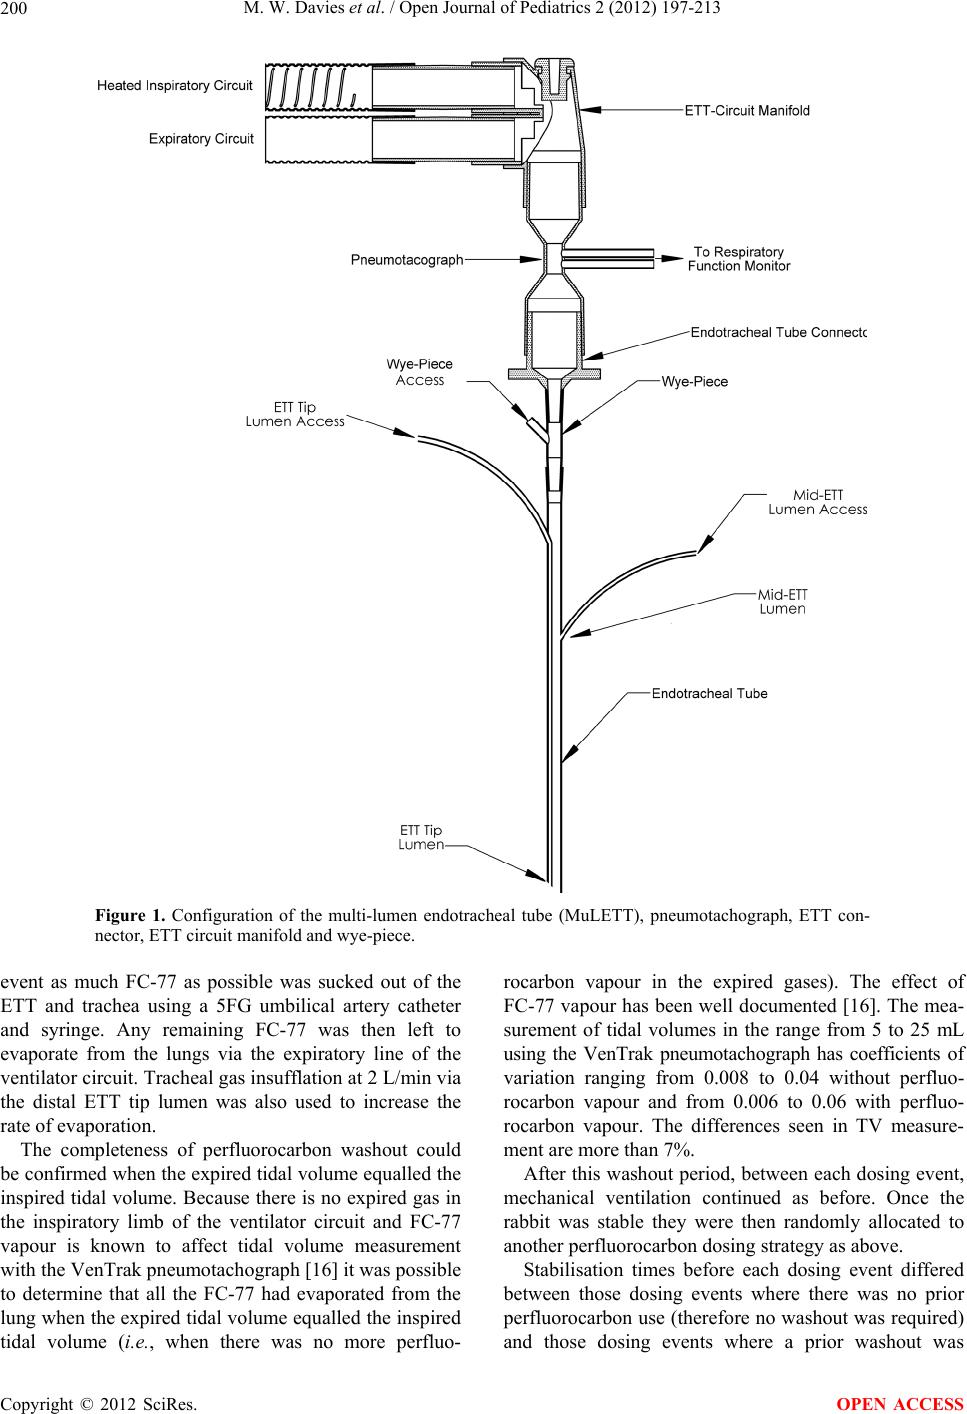 M. W. Davies et al. / Open Journal of Pediatrics 2 (2012) 197-213 Copyright © 2012 SciRes. 200 Figure 1. Configuration of the multi-lumen endotracheal tube (MuLETT), pneumotachograph, ETT con- nector, ETT circuit manifold and wye-piece. event as much FC-77 as possible was sucked out of the ETT and trachea using a 5FG umbilical artery catheter and syringe. Any remaining FC-77 was then left to evaporate from the lungs via the expiratory line of the ventilator circuit. Tracheal gas insufflation at 2 L/min via the distal ETT tip lumen was also used to increase the rate of evaporation. The completeness of perfluorocarbon washout could be confirmed when the expired tidal volume equalled the inspired tidal volume. Because there is no expired gas in the inspiratory limb of the ventilator circuit and FC-77 vapour is known to affect tidal volume measurement with the VenTrak pneumotachograph [16] it was possible to determine that all the FC-77 had evaporated from the lung when the expired tidal volume equalled the inspired tidal volume (i.e., when there was no more perfluo- rocarbon vapour in the expired gases). The effect of FC-77 vapour has been well documented [16]. The mea- surement of tidal volumes in the range from 5 to 25 mL using the VenTrak pneumotachograph has coefficients of variation ranging from 0.008 to 0.04 without perfluo- rocarbon vapour and from 0.006 to 0.06 with perfluo- rocarbon vapour. The differences seen in TV measure- ment are more than 7%. After this washout period, between each dosing event, mechanical ventilation continued as before. Once the rabbit was stable they were then randomly allocated to another perfluorocarbon dosing strategy as above. Stabilisation times before each dosing event differed between those dosing events where there was no prior perfluorocarbon use (therefore no washout was required) and those dosing events where a prior washout was OPEN ACCESS  M. W. Davies et al. / Open Journal of Pediatrics 2 (2012) 197-213 201 required. The mean (SD) stabilisation time for the former was 15.4 (6.96) minutes and for the latter was 64.9 (14.26) minutes. 2.6. Measurements Two methods of assessing cerebral blood flow were used, both recorded continuously: cerebral cortical blood flow (laser Doppler flowmetry), as used in the previous pre- term lamb studies; and right carotid blood flow (Tran- sonic Flowmeter). Carotid flow was used to assess more global brain blood flow to ensure that previous effects seen were not restricted to the cerebral cortex. The coef- ficient of variation (CV) for these two measurements were calculated to assess their variability. The following were all recorded continuously: heart rate, blood pressure, peripheral oxygen saturation (pulse oximetry), PaO2, PaCO2, pH, bicarbonate, base excess, arterial oxygen saturation, temperature, dynamic com- pliance, peak inspiratory pressure, and tidal volume. FiO2 was recorded at the start of each dosing event and the timing of any changes recorded thereafter. 2.7. Sample Size Sample size calculation was based on carotid blood flow data from Takeuchi et al. [17] where mean (SD) carotid blood flow was 13.8 (3.39) mL/min. Therefore a sample size of six in each group is required to show an absolute difference of 6.1 mL/min between groups ( = 0.05, power of 80% – = 0.2). 2.8. Data Analysis 2.8.1. Data Display For each dosing event mean values for continuously measured variables and calculated variables were calcu- lated at baseline (the average during the minute immedi- ately prior to perfluorocarbon or air dosing) and every minute for the 30 minute observation period. For each 1-min period means were calculated from all measure- ments made over the one minute period. For the six dos- ing events for each dosing strategy the mean (SD) was calculated at baseline and every minute to 30 minutes and these data were then displayed graphically over time. For laser Doppler flow and carotid blood flow the per- cent change from baseline was calculated for each datum and then for each dosing event the data were averaged for each one minute period. Calculations and graphs were produced using Microsoft Excel 2002 (Microsoft Corporation, Redmond, Washington, USA). To assess the variability of laser Doppler flow and ca- rotid flow, the coefficient of variation was calculated for each one minute period for each dosing event. The coef- ficient of variation is calculated by dividing the standard deviation by the mean for each one minute period. 2.8.2. Statistical Analysis To determine if there were any statistically significant differences between the dosing strategy groups, the data were compared at two time points: at the end of the dos- ing period (i.e., at 5, 10 or 20 min) and at the point of maximal difference between groups. These time points were chosen as the most clinically relevant points for between group comparisons. For the purpose of these statistical tests the data were converted to change from baseline—this controlled for any differences between dosing strategy groups at baseline. If the data were nor- mally distributed and the variances were equal the groups were compared using Student’s t-test or one-way ANOVA. If the data were not normally distributed or the variances were not equal the groups were compared us- ing the Mann-Whitney test or Kruskal-Wallis test. The distribution of data were tested using the Kolmo- gorov-Smirnov normality test with Dallal-Wilkinson- Lillie for P value. The F test was used to compare vari- ances. These data analyses were done using GraphPad Prism version 4.03 (GraphPad Software Inc., San Diego, CA). A p value of <0.05 was considered to be statistic- cally significant. 2.9. Ethics Approval Ethical approval was obtained from the University of Queensland Animal Experimentation and Ethics Com- mittee. All of the experimental procedures were per- formed in accordance with the guidelines established by the National Health and Medical Research Council of Australia in its Australian Code of Practice for the Care and Use of Animals for Scientific Purposes [18]. 3. RESULTS Figures 2 and 3 show the relative changes (% change from baseline) for both carotid flow and cortical cerebral blood flow for each perfluorocarbon dosing strategy. In each figure the vertical scales are identical for ease of comparison. Tables 1 and 2 summarise the maximum variations in flow for the two cerebral blood flow vari- ables by dosing strategy. 3.1. Does 20 mL/kg of Perfluorocarbon Disturb Cerebral Blood Flow? We compared the CONTROL-PC group with the PLV20-slow-proximal-PC group. Carotid blood flow was increased relative to baseline during the initial 20 minute dose of 20 mL/kg perfluoro- carbon when starting partial liquid ventilation compared with continuing on pressure-controlled conventional mechanical ventilation—Mann-Whitney test p = 0.04 at the end of the dose and p = 0.04 at the time of maximum difference (21 min). The highest mean increase in Copyright © 2012 SciRes. OPEN ACCESS  M. W. Davies et al. / Open Journal of Pediatrics 2 (2012) 197-213 Copyright © 2012 SciRes. 202 -40 -20 0 20 40 60 80 100 120 pre12 3 45 6 7 89101112131415161718192021222324252627282930 time (minutes) % change in carotid flow CONTROL-PC -40 -20 0 20 40 60 80 100 120 pre12 3 45 6 7 89101112131415161718192021222324252627282930 time (minutes) % change in carotid flow CONTROL-PC CONTROL-PC (a) -40 -20 0 20 40 60 80 100 120 pre123456789101112131415161718192021222324252627282930 time (minutes) % change in carotid flow PLV20-slow-proximal-PC FC-77 dose -40 -20 0 20 40 60 80 100 120 pre123456789101112131415161718192021222324252627282930 time (minutes) % change in carotid flow PLV20-slow-proximal-PC FC-77 dose PLV20-slow-proximal-PC FC-77 dose (b) -40 -20 0 20 40 60 80 100 120 pre123456789101112131415161718192021222324252627282930 time ( minutes ) % change in c arotid flow PLV10-slow-proximal-PC FC-77 dose -40 -20 0 20 40 60 80 100 120 pre123456789101112131415161718192021222324252627282930 time ( minutes ) % change in c arotid flow PLV10-slow-proximal-PC FC-77 dose PLV10-slow-proximal-PC FC-77 dose (c) OPEN ACCESS  M. W. Davies et al. / Open Journal of Pediatrics 2 (2012) 197-213 203 -40 -20 0 20 40 60 80 100 120 pre123456789101112131415161718192021222324252627282930 time ( minutes ) % change in carotid flow PLV10-faster-proxim al-P C FC-77 dose -40 -20 0 20 40 60 80 100 120 pre123456789101112131415161718192021222324252627282930 time ( minutes ) % change in carotid flow PLV10-faster-proxim al-P C FC-77 dose PLV10-faster-proximal-PC FC-77 dose (d) -40 -20 0 20 40 60 80 100 120 pre12345678910 1112 13 1415 16 17 1819 202122 23 24 2526 27 2829 30 time (minutes) % change in carotid flow PLV10-rapid-proximal-PC FC-77 dose -40 -20 0 20 40 60 80 100 120 pre12345678910 1112 13 1415 16 17 1819 202122 23 24 2526 27 2829 30 time (minutes) % change in carotid flow PLV10-rapid-proximal-PC FC-77 dose PLV10-rapid-proximal-PC FC-77 dose (e) -40 -20 0 20 40 60 80 100 120 pre123456789101112131415161718192021222324252627282930 time (minutes) % change in carotid flow PLV10-s low-tip-PC FC-77 dose -40 -20 0 20 40 60 80 100 120 pre123456789101112131415161718192021222324252627282930 time (minutes) % change in carotid flow PLV10-s low-tip-PC FC-77 dose PLV10-slow-tip-PC FC-77 dose (f) Copyright © 2012 SciRes. OPEN ACCESS  M. W. Davies et al. / Open Journal of Pediatrics 2 (2012) 197-213 204 -40 -20 0 20 40 60 80 100 120 pre123456789101112131415161718192021222324252627282930 time ( minutes ) % change in carotid flow PLV10-slow-proximal-PC-adjust PIP FC-77 dose -40 -20 0 20 40 60 80 100 120 pre123456789101112131415161718192021222324252627282930 time ( minutes ) % change in carotid flow PLV10-slow-proximal-PC-adjust PIP FC-77 dose PLV10-slow-proximal-PC-adjust PIP FC-77 dose (g) Figure 2. Relative changes (% change from baseline) of carotid blood flow for each perfluorocarbon dosing strategy. All vertical scales are identical for ease of comparison. -20 0 20 40 60 80 100 pre123456789101112131415161718192021222324252627282930 time (minutes) % change in LDF CONTROL-PC -20 0 20 40 60 80 100 pre123456789101112131415161718192021222324252627282930 time (minutes) % change in LDF CONTROL-PC CONTROL-PC (a) -20 0 20 40 60 80 100 pre12345678910 11 12 1314 15 161718 19 2021 22 23 2425 26 2728 29 30 time (minutes) % change in LDF PLV20-slow-proximal-PC FC-77 dose -20 0 20 40 60 80 100 pre12345678910 11 12 1314 15 161718 19 2021 22 23 2425 26 2728 29 30 time (minutes) % change in LDF PLV20-slow-proximal-PC -20 0 20 40 60 80 100 pre12345678910 11 12 1314 15 161718 19 2021 22 23 2425 26 2728 29 30 time (minutes) % change in LDF PLV20-slow-proximal-PC FC-77 dose PLV20-slow-proximal-PC FC-77 dose (b) Copyright © 2012 SciRes. OPEN ACCESS  M. W. Davies et al. / Open Journal of Pediatrics 2 (2012) 197-213 205 -20 0 20 40 60 80 100 pre123456789101112131415161718192021222324252627282930 time (minutes) % change in LD F PLV10-sl ow-pro ximal-PC FC-77 dose -20 0 20 40 60 80 100 pre123456789101112131415161718192021222324252627282930 time (minutes) % change in LD F PLV10-sl ow-pro ximal-PC FC-77 dose PLV10-slow-proximal-PC FC-77 dose (c) -20 0 20 40 60 80 100 pre12 345 67 89101112131415161718192021222324252627282930 time (minutes) % change in LDF PLV 1 0-fas ter-pro ximal-P C FC-77 dose -20 0 20 40 60 80 100 pre12 345 67 89101112131415161718192021222324252627282930 time (minutes) % change in LDF PLV 1 0-fas ter-pro ximal-P C FC-77 dose PLV10-faster-proximal-PC FC-77 dose (d) -20 0 20 40 60 80 100 pre12345678910 1112 13 1415 16 17 181920 2122 23 24 2526 27 2829 30 time (minutes) % change in LD F PLV10-ra pid-pro ximal-PC FC-77 dose -20 0 20 40 60 80 100 pre12345678910 1112 13 1415 16 17 181920 2122 23 24 2526 27 2829 30 time (minutes) % change in LD F PLV10-ra pid-pro ximal-PC FC-77 dose PLV10-rapid-proximal-PC FC-77 dose (e) Copyright © 2012 SciRes. OPEN ACCESS  M. W. Davies et al. / Open Journal of Pediatrics 2 (2012) 197-213 206 -20 0 20 40 60 80 100 pre12 3 456 7 89101112131415161718192021222324252627282930 time (minutes) % change in LD F PLV 10-slow-tip-P C FC-77 dose -20 0 20 40 60 80 100 pre12 3 456 7 89101112131415161718192021222324252627282930 time (minutes) % change in LD F PLV 10-slow-tip-P C FC-77 dose PLV10-slow-tip-PC FC-77 dose (f) -20 0 20 40 60 80 100 pre1 2 3 45 6 7 89101112131415161718192021222324252627282930 time ( minutes ) % change in LD F PLV10-slow-proximal-PC-adjust PIP FC-77 dose -20 0 20 40 60 80 100 pre1 2 3 45 6 7 89101112131415161718192021222324252627282930 time ( minutes ) % change in LD F PLV10-slow-proximal-PC-adjust PIP FC-77 dose PLV10-slow-proximal-PC-adjust PIP FC-77 dose (g) Figure 3. Relative changes (% change from baseline) of cortical cerebral blood flow for each perfluorocarbon dosing strategy. All vertical scales are identical for ease of comparison. Table 1. The extent of the relative changes of carotid blood flow. Group PFC dose duration % increase at end of dose Maximum % increase (at time) Minimum % decrease (at time) CONTROL-PC did not get PFC did not get PFC 4 (19 min) 4 (7 min) PLV20-slow-proximal-PC 20 min 50 52 (27 min) 3 (2 min) PLV10-slow-proximal-PC 20 min 95 105 (22 min) no decrease PLV10-faster-proximal-PC 10 min 39 50 (12 min) no decrease PLV10-rapid-proximal-PC 5 min 1 11 (11 min) 6 (3 min) PLV10-slow-tip-PC 20 min 57 62 (17 min) no decrease PLV10-slow-proximal-PC-adjust PIP20 min –10 no increase 14 (14 min) PFC—perfluorocarbon. Copyright © 2012 SciRes. OPEN ACCESS  M. W. Davies et al. / Open Journal of Pediatrics 2 (2012) 197-213 Copyright © 2012 SciRes. 207 OPEN ACCESS Table 2. The extent of the relative changes of cortical cerebral blood flow. Group PFC dose duration % increase at end of dose Maximum % increase (at time) Minimum % decrease (at time) CONTROL-PC did not get PFC did not get PFC 17 (30 min) 1 (1 min) PLV20-slow-proximal-PC 20 min 46 51 (26 min) 1 (2 min) PLV10-slow-proximal-PC 20 min 24 29 (24 min) no decrease PLV10-faster-proximal-PC 10 min 14 18 (11 min) 1 (1 min) PLV10-rapid-proximal-PC 5 min 6 14 (7 min) 3 (29 min) PLV10-slow-tip-PC 20 min 47 47 (20 min) no decrease PLV10-slow-proximal-PC-adjust PIP 20 min –2 2 (2 min) 7 (23 min) carotid blood flow was around 50% in the PLV20-slow- proximal-PC (Figures 2(a) and (b)). In the CON- TROL-PC dosing event group the carotid blood flow remained with 5% of baseline throughout the 30 min. A similar increase in cortical cerebral blood flow was seen in the PLV20-slow-proximal-PC group (Figure 3(b)). In the CONTROL-PC dosing event group the laser Doppler flow increased slightly up to a maximum increase of around 18% whereas in the PLV20-slow- proximal-PC group the laser Doppler flow increased to a maximum of about 50%. The differences between groups was not statistically significant—Mann-Whitney test p = 0.31 at the end of the dose and p = 0.24 at the time of maximum difference (26 min). During perfluorocarbon dosing there was more vari- ability in carotid blood flow but this difference did not reach statistical significance—Mann-Whitney test p = 0.065 at the end of the dose and Student’s t test Mann-Whitney test p = 0.18 at the time of maximum difference (30 min). There was significantly more vari- ability in cortical cerebral blood flow during perfluoro- carbon dosing—Mann-Whitney test p = 0.0043 at the end of the dose and Mann-Whitney test p = 0.041 at the time of maximum difference (25 min). See additional data file, pp. 3-5. See additional data file (pp. 6-17) for the results of haemodynamics, vital signs and respiratory function. 3.2. Does a Lower Dose of Perfluorocarbon Disturb Cerebral Blood Flow? We compared the PLV10-slow-proximal-PC group with the PLV20-slow-proximal-PC group. Carotid blood flow increased over the 30 minute ob- servation period in both groups (Figures 2(b) and (c)) but there was no difference between groups—Mann-Whitney test p = 0.82 at the end of the dose and Mann-Whitney test p = 0.82 at the time of maximum difference (24 min). The highest mean increase in carotid blood flow was around 105% in the PLV10-slow-proximal-PC group and around 50% in the PLV20-slow-proximal-PC group. Whilst cortical cerebral blood flow increased in both groups (Figures 3(b) and (c)) there was no statistically significant difference between groups—Student’s t test p = 0.48 at the end of the dose and Mann-Whitney test p = 0.59 at the time of maximum difference (27 min). During perfluorocarbon dosing there was considerable variability in both carotid blood flow and cortical cere- bral blood flow (see additional data file, pp. 18-20) but there were no statistically significant differences between groups. For the variability of carotid flow the Mann- Whitney test p = 0.065 at the end of the dose and Stu- dent’s t test p = 0.058 at the time of maximum difference (3 min). For variability of cortical cerebral blood flow the Student’s t test p = 0.48 at the end of the dose and Mann-Whitney test p = 0.59 at the time of maximum difference (27 min). See additional data file (pp. 21-32) for the results of haemodynamics, vital signs and respiratory function. 3.3. Do Different Rates of Administration Affect Cerebral Blood Flow? We compared the PLV10-slow-proximal-PC group, the PLV10-faster-proximal-PC group and the PLV10-rapid- proximal-PC group. Carotid blood flow increased during the initial dose of 10 mL/kg perfluorocarbon when starting partial liquid ventilation in both the PLV10-slow-proximal-PC and PLV10-faster-proximal-PC groups (Figures 2(c) and (d)). In the PLV10-rapid-proximal-PC group the increase in carotid blood flow was much less pronounced (Figure 2(e)). The extent of the changes of carotid blood flow are shown in Table 1. The relative increase in carotid blood flow was greatest when the dose of perfluorocarbon was given slowly and least when the dose was given rapidly. However, there were no statistically significant dif- ferences between groups for carotid blood flow— Kruskal-Wallis test p = 0.26 at the end of the dose and Kruskal-Wallis test p = 0.29 at the time of maximum difference (23 min). Cortical cerebral blood flow increased in all three groups (Figures 3(c)-(e)). The pattern of changes were different between all three groups and the extent of the  M. W. Davies et al. / Open Journal of Pediatrics 2 (2012) 197-213 208 changes of cortical cerebral blood flow are shown in Ta- ble 2. The relative increase in cortical cerebral blood flow was greatest when the dose of perfluorocarbon was given slowly (Figure 3(c)) and least when the dose was given rapidly (Figure 3(e)). Importantly when the dose was given rapidly (over 5 minutes) the cortical cerebral blood flow increased quickly but decreased back to around baseline by about 12 minutes. When the dose of perfluorocarbon is given over 10 or 20 minutes cortical cerebral blood flow remained increased throughout the 30 minute observation period. However, there were no statistically significant differences between groups— one-way ANOVA p = 0.40 at the end of the dose and one-way ANOVA p = 0.12 at the time of maximum dif- ference (25 min). During perfluorocarbon dosing there was a statistically significant difference between groups for variability in carotid blood flow—Kruskal-Wallis test p = 0.16 at the end of the dose and one-way ANOVA p = 0.02 at the time of maximum difference (18 min). There was no statistically significant difference between groups for variability in cortical cerebral blood flow—Kruskal- Wallis test p = 0.22 at the end of the dose and Kruskal- Wallis test p = 0.87 at the time of maximum difference (1 min). See additional data file, pp. 33-35. See additional data file (pp. 36-47) for the results of haemodynamics, vital signs and respiratory function. 3.4. Does the Portal of Entry of the Dose of Perfluorocarbon Affect Cerebral Blood Flow? We compared the PLV10-slow-proximal-PC group with the PLV10-slow-tip-PC group. The PLV10-slow-pro- ximal-PC group had a dose of FC-77 (10 mL/kg) given over 20 min via the wye-piece at the proximal end of the ETT (Figure 1) whilst on pressure-controlled ventilation. The PLV10-slow-tip-PC group had 10 mL/kg of FC-77 given over 20 min via the ETT tip lumen (Figure 1) whilst on pressure-controlled ventilation. Carotid blood flow increased over the 30 minute ob- servation period in both groups (Figures 2(c) and (f)). The differences were not statistically significant—Mann- Whitney test p = 0.39 at the end of the dose and Mann- Whitney test p = 0.48 at the time of maximum difference (24 min). The highest mean increase in carotid blood flow was around 110% in the PLV10-slow-proximal- PC group and around 60% in the PLV10-slow-tip-PC group. Cortical cerebral blood flow increased in both groups (Figures 3(c) and (f)). The differences were not statistic- cally significant—Mann-Whitney test p = 0.94 at the end of the dose and Student’s t test Mann-Whitney test p = 0.94 at the time of maximum difference (15 min). The highest mean increase in cortical cerebral blood flow was around 47% in the PLV10-slow-tip-PC group and around 29% in the PLV10-slow-proximal-PC group. During perfluorocarbon dosing there were no statistic- cally significant difference between the two groups for carotid blood flow variability—Mann-Whitney test p = 0.24 at the end of the dose and Mann-Whitney test p = 0.13 at the time of maximum difference (3 min). There was a little more variability in cortical cerebral blood flow in the PLV10-slow-proximal-PC group. The dif- ferences were not statistically significant—Mann-Whitney test p = 0.80 at the end of the dose and Mann-Whitney test p = 0.093 at the time of maximum difference (2 min). See additional data file (pp. 48-50). See additional data file (pp. 51-62) for the results of haemodynamics, vital signs and respiratory function. 3.5. Does Tight Control of Arterial Carbon Dioxide during Perfluorocarbon Mitigate the Effects on Cerebral Blood Flow? We compared the PLV10-slow-proximal-PC group with the PLV10-slow-proximal-PC-adjust PIP group. The relative change in carotid blood flow (Figure 2(c)) showed a significant increase in the PLV10-slow- proximal-PC group compared with the PLV10-slow- proximal-PC-adjust PIP group which had a slight de- crease (Figure 2(g)). These differences were statistically significant—Mann-Whitney test p = 0.015 at the end of the dose and Mann-Whitney test p = 0.015 at the time of maximum difference (24 min). The highest increase in mean carotid blood flow was around 105% in the PLV10-slow-proximal-PC group and the lowest de- crease was around 14% in the PLV10-slow-proximal- PC-adjust PIP group. Cortical cerebral blood flow showed a significant in- crease in the PLV10-slow-proximal-PC group (Figure 3(c)) compared with the PLV10-slow-proximal-PC- adjust PIP group (Figure 3(g)) which had a slight de- crease - Mann-Whitney test p = 0.041 at the end of the dose and Mann-Whitney test p = 0.065 at the time of maximum difference (23 min). The highest increase in mean cortical cerebral blood flow was around 29% in the PLV10-slow-proximal-PC group and the lowest de- crease was around 7% in the PLV10-slow-proximal- PC-adjust PIP group. During perfluorocarbon dosing there was less variabil- ity in carotid blood flow in the PLV10-slow-proximal- PC-adjust PIP group—Student’s t test p = 0.019 at the end of the dose and Mann-Whitney test p = 0.065 at the time of maximum difference (5 min). There was no dif- ference between groups for the variability of cortical cerebral blood flow—Student’s t test p = 0.94 at the end of the dose and Mann-Whitney test p = 0.39 at the time of maximum difference (2 min). See additional data file (pp. 63-65). Copyright © 2012 SciRes. OPEN ACCESS 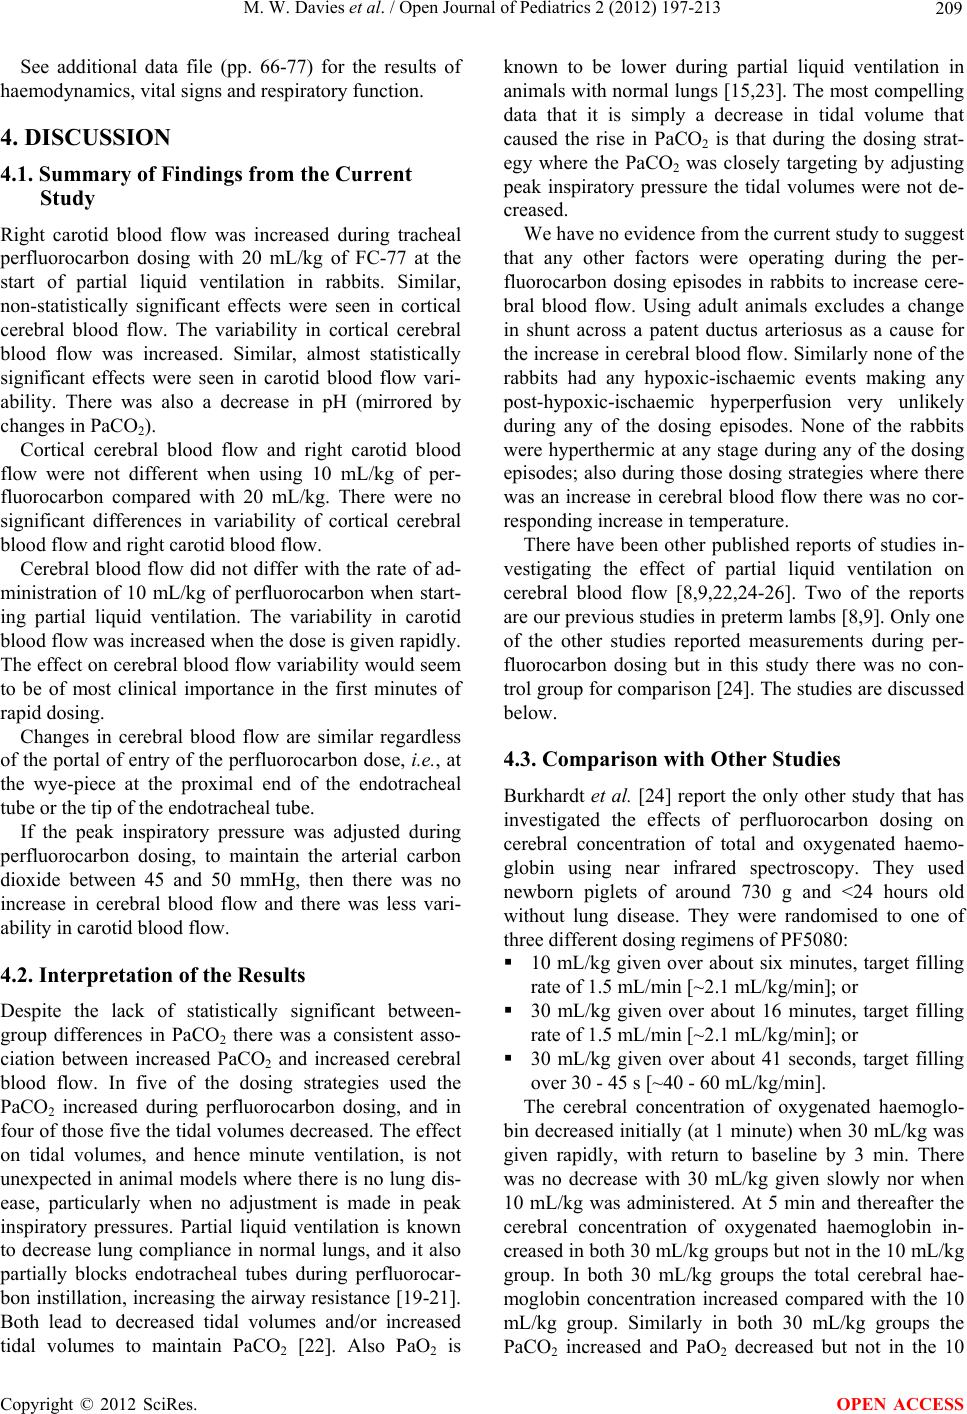 M. W. Davies et al. / Open Journal of Pediatrics 2 (2012) 197-213 209 See additional data file (pp. 66-77) for the results of haemodynamics, vital signs and respiratory function. 4. DISCUSSION 4.1. Summary of Findings from the Current Study Right carotid blood flow was increased during tracheal perfluorocarbon dosing with 20 mL/kg of FC-77 at the start of partial liquid ventilation in rabbits. Similar, non-statistically significant effects were seen in cortical cerebral blood flow. The variability in cortical cerebral blood flow was increased. Similar, almost statistically significant effects were seen in carotid blood flow vari- ability. There was also a decrease in pH (mirrored by changes in PaCO2). Cortical cerebral blood flow and right carotid blood flow were not different when using 10 mL/kg of per- fluorocarbon compared with 20 mL/kg. There were no significant differences in variability of cortical cerebral blood flow and right carotid blood flow. Cerebral blood flow did not differ with the rate of ad- ministration of 10 mL/kg of perfluorocarbon when start- ing partial liquid ventilation. The variability in carotid blood flow was increased when the dose is given rapidly. The effect on cerebral blood flow variability would seem to be of most clinical importance in the first minutes of rapid dosing. Changes in cerebral blood flow are similar regardless of the portal of entry of the perfluorocarbon dose, i.e., at the wye-piece at the proximal end of the endotracheal tube or the tip of the endotracheal tube. If the peak inspiratory pressure was adjusted during perfluorocarbon dosing, to maintain the arterial carbon dioxide between 45 and 50 mmHg, then there was no increase in cerebral blood flow and there was less vari- ability in carotid blood flow. 4.2. Interpretation of the Results Despite the lack of statistically significant between- group differences in PaCO2 there was a consistent asso- ciation between increased PaCO2 and increased cerebral blood flow. In five of the dosing strategies used the PaCO2 increased during perfluorocarbon dosing, and in four of those five the tidal volumes decreased. The effect on tidal volumes, and hence minute ventilation, is not unexpected in animal models where there is no lung dis- ease, particularly when no adjustment is made in peak inspiratory pressures. Partial liquid ventilation is known to decrease lung compliance in normal lungs, and it also partially blocks endotracheal tubes during perfluorocar- bon instillation, increasing the airway resistance [19-21]. Both lead to decreased tidal volumes and/or increased tidal volumes to maintain PaCO2 [22]. Also PaO2 is known to be lower during partial liquid ventilation in animals with normal lungs [15,23]. The most compelling data that it is simply a decrease in tidal volume that caused the rise in PaCO2 is that during the dosing strat- egy where the PaCO2 was closely targeting by adjusting peak inspiratory pressure the tidal volumes were not de- creased. We have no evidence from the current study to suggest that any other factors were operating during the per- fluorocarbon dosing episodes in rabbits to increase cere- bral blood flow. Using adult animals excludes a change in shunt across a patent ductus arteriosus as a cause for the increase in cerebral blood flow. Similarly none of the rabbits had any hypoxic-ischaemic events making any post-hypoxic-ischaemic hyperperfusion very unlikely during any of the dosing episodes. None of the rabbits were hyperthermic at any stage during any of the dosing episodes; also during those dosing strategies where there was an increase in cerebral blood flow there was no cor- responding increase in temperature. There have been other published reports of studies in- vestigating the effect of partial liquid ventilation on cerebral blood flow [8,9,22,24-26]. Two of the reports are our previous studies in preterm lambs [8,9]. Only one of the other studies reported measurements during per- fluorocarbon dosing but in this study there was no con- trol group for comparison [24]. The studies are discussed below. 4.3. Comparison with Other Studies Burkhardt et al. [24] report the only other study that has investigated the effects of perfluorocarbon dosing on cerebral concentration of total and oxygenated haemo- globin using near infrared spectroscopy. They used newborn piglets of around 730 g and <24 hours old without lung disease. They were randomised to one of three different dosing regimens of PF5080: 10 mL/kg given over about six minutes, target filling rate of 1.5 mL/min [~2.1 mL/kg/min]; or 30 mL/kg given over about 16 minutes, target filling rate of 1.5 mL/min [~2.1 mL/kg/min]; or 30 mL/kg given over about 41 seconds, target filling over 30 - 45 s [~40 - 60 mL/kg/min]. The cerebral concentration of oxygenated haemoglo- bin decreased initially (at 1 minute) when 30 mL/kg was given rapidly, with return to baseline by 3 min. There was no decrease with 30 mL/kg given slowly nor when 10 mL/kg was administered. At 5 min and thereafter the cerebral concentration of oxygenated haemoglobin in- creased in both 30 mL/kg groups but not in the 10 mL/kg group. In both 30 mL/kg groups the total cerebral hae- moglobin concentration increased compared with the 10 mL/kg group. Similarly in both 30 mL/kg groups the PaCO2 increased and PaO2 decreased but not in the 10 Copyright © 2012 SciRes. OPEN ACCESS 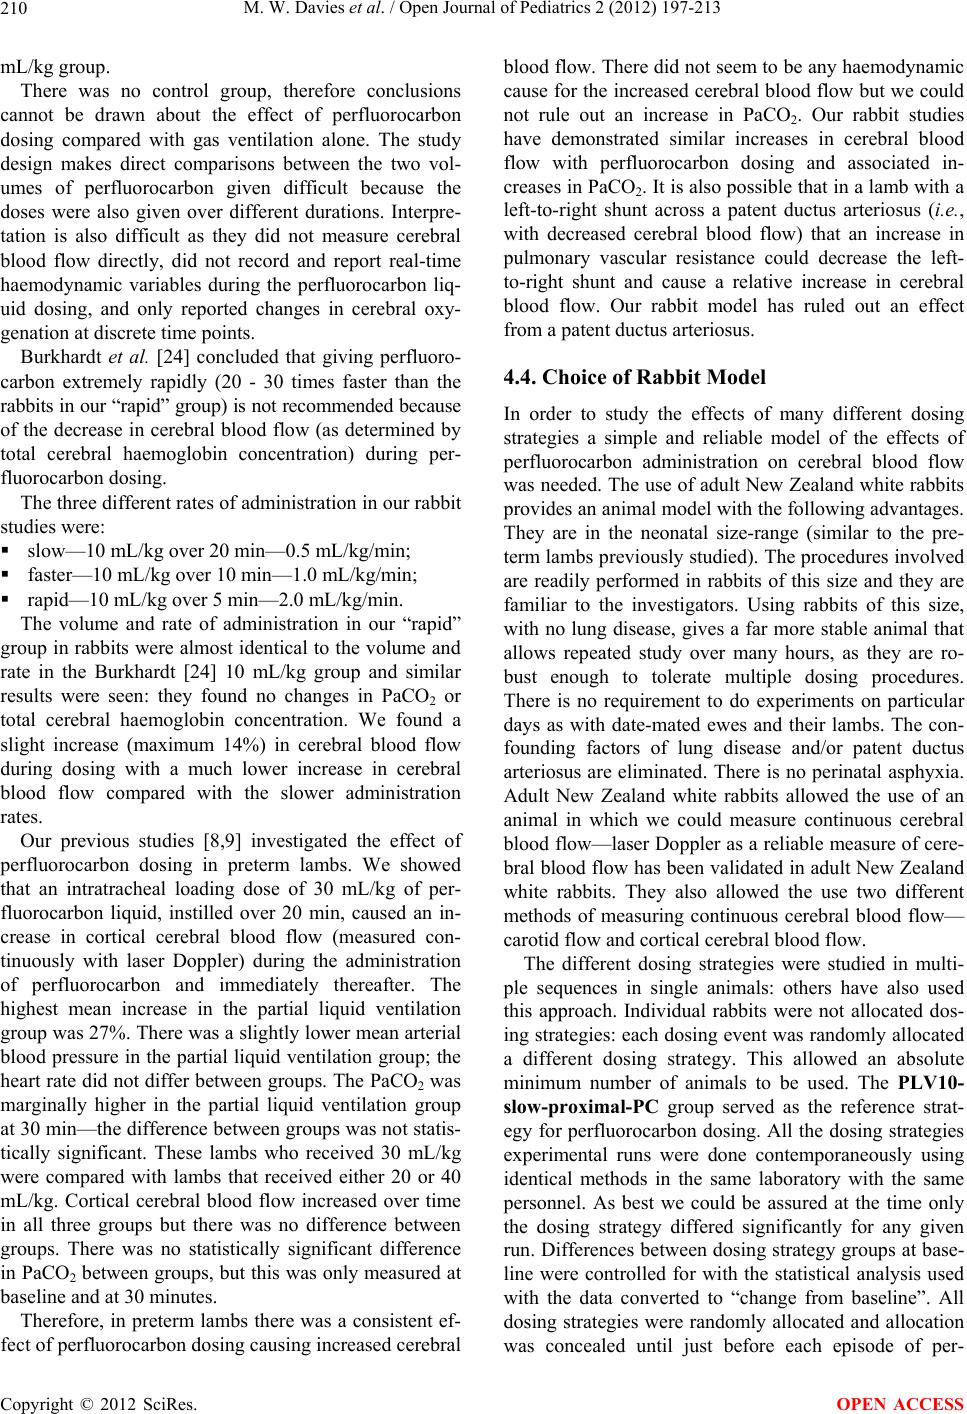 M. W. Davies et al. / Open Journal of Pediatrics 2 (2012) 197-213 210 mL/kg group. There was no control group, therefore conclusions cannot be drawn about the effect of perfluorocarbon dosing compared with gas ventilation alone. The study design makes direct comparisons between the two vol- umes of perfluorocarbon given difficult because the doses were also given over different durations. Interpre- tation is also difficult as they did not measure cerebral blood flow directly, did not record and report real-time haemodynamic variables during the perfluorocarbon liq- uid dosing, and only reported changes in cerebral oxy- genation at discrete time points. Burkhardt et al. [24] concluded that giving perfluoro- carbon extremely rapidly (20 - 30 times faster than the rabbits in our “rapid” group) is not recommended because of the decrease in cerebral blood flow (as determined by total cerebral haemoglobin concentration) during per- fluorocarbon dosing. The three different rates of administration in our rabbit studies were: slow—10 mL/kg over 20 min—0.5 mL/kg/min; faster—10 mL/kg over 10 min—1.0 mL/kg/min; rapid—10 mL/kg over 5 min—2.0 mL/kg/min. The volume and rate of administration in our “rapid” group in rabbits were almost identical to the volume and rate in the Burkhardt [24] 10 mL/kg group and similar results were seen: they found no changes in PaCO2 or total cerebral haemoglobin concentration. We found a slight increase (maximum 14%) in cerebral blood flow during dosing with a much lower increase in cerebral blood flow compared with the slower administration rates. Our previous studies [8,9] investigated the effect of perfluorocarbon dosing in preterm lambs. We showed that an intratracheal loading dose of 30 mL/kg of per- fluorocarbon liquid, instilled over 20 min, caused an in- crease in cortical cerebral blood flow (measured con- tinuously with laser Doppler) during the administration of perfluorocarbon and immediately thereafter. The highest mean increase in the partial liquid ventilation group was 27%. There was a slightly lower mean arterial blood pressure in the partial liquid ventilation group; the heart rate did not differ between groups. The PaCO2 was marginally higher in the partial liquid ventilation group at 30 min—the difference between groups was not statis- tically significant. These lambs who received 30 mL/kg were compared with lambs that received either 20 or 40 mL/kg. Cortical cerebral blood flow increased over time in all three groups but there was no difference between groups. There was no statistically significant difference in PaCO2 between groups, but this was only measured at baseline and at 30 minutes. Therefore, in preterm lambs there was a consistent ef- fect of perfluorocarbon dosing causing increased cerebral blood flow. There did not seem to be any haemodynamic cause for the increased cerebral blood flow but we could not rule out an increase in PaCO2. Our rabbit studies have demonstrated similar increases in cerebral blood flow with perfluorocarbon dosing and associated in- creases in PaCO2. It is also possible that in a lamb with a left-to-right shunt across a patent ductus arteriosus (i.e., with decreased cerebral blood flow) that an increase in pulmonary vascular resistance could decrease the left- to-right shunt and cause a relative increase in cerebral blood flow. Our rabbit model has ruled out an effect from a patent ductus arteriosus. 4.4. Choice of Rabbit Model In order to study the effects of many different dosing strategies a simple and reliable model of the effects of perfluorocarbon administration on cerebral blood flow was needed. The use of adult New Zealand white rabbits provides an animal model with the following advantages. They are in the neonatal size-range (similar to the pre- term lambs previously studied). The procedures involved are readily performed in rabbits of this size and they are familiar to the investigators. Using rabbits of this size, with no lung disease, gives a far more stable animal that allows repeated study over many hours, as they are ro- bust enough to tolerate multiple dosing procedures. There is no requirement to do experiments on particular days as with date-mated ewes and their lambs. The con- founding factors of lung disease and/or patent ductus arteriosus are eliminated. There is no perinatal asphyxia. Adult New Zealand white rabbits allowed the use of an animal in which we could measure continuous cerebral blood flow—laser Doppler as a reliable measure of cere- bral blood flow has been validated in adult New Zealand white rabbits. They also allowed the use two different methods of measuring continuous cerebral blood flow— carotid flow and cortical cerebral blood flow. The different dosing strategies were studied in multi- ple sequences in single animals: others have also used this approach. Individual rabbits were not allocated dos- ing strategies: each dosing event was randomly allocated a different dosing strategy. This allowed an absolute minimum number of animals to be used. The PLV10- slow-proximal-PC group served as the reference strat- egy for perfluorocarbon dosing. All the dosing strategies experimental runs were done contemporaneously using identical methods in the same laboratory with the same personnel. As best we could be assured at the time only the dosing strategy differed significantly for any given run. Differences between dosing strategy groups at base- line were controlled for with the statistical analysis used with the data converted to “change from baseline”. All dosing strategies were randomly allocated and allocation was concealed until just before each episode of per- Copyright © 2012 SciRes. OPEN ACCESS 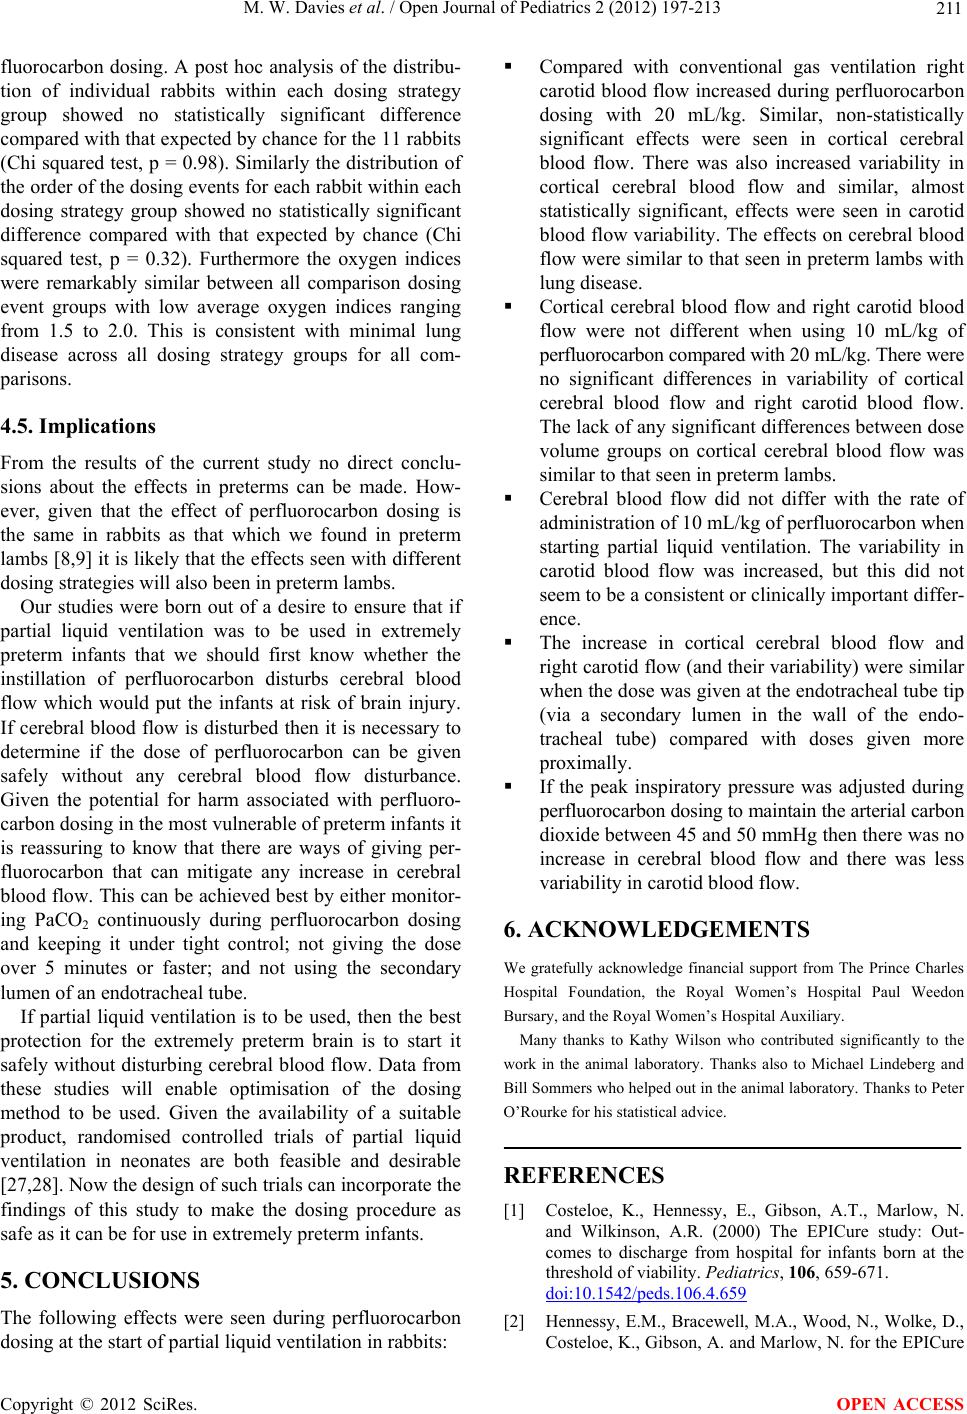 M. W. Davies et al. / Open Journal of Pediatrics 2 (2012) 197-213 211 fluorocarbon dosing. A post hoc analysis of the distribu- tion of individual rabbits within each dosing strategy group showed no statistically significant difference compared with that expected by chance for the 11 rabbits (Chi squared test, p = 0.98). Similarly the distribution of the order of the dosing events for each rabbit within each dosing strategy group showed no statistically significant difference compared with that expected by chance (Chi squared test, p = 0.32). Furthermore the oxygen indices were remarkably similar between all comparison dosing event groups with low average oxygen indices ranging from 1.5 to 2.0. This is consistent with minimal lung disease across all dosing strategy groups for all com- parisons. 4.5. Implications From the results of the current study no direct conclu- sions about the effects in preterms can be made. How- ever, given that the effect of perfluorocarbon dosing is the same in rabbits as that which we found in preterm lambs [8,9] it is likely that the effects seen with different dosing strategies will also been in preterm lambs. Our studies were born out of a desire to ensure that if partial liquid ventilation was to be used in extremely preterm infants that we should first know whether the instillation of perfluorocarbon disturbs cerebral blood flow which would put the infants at risk of brain injury. If cerebral blood flow is disturbed then it is necessary to determine if the dose of perfluorocarbon can be given safely without any cerebral blood flow disturbance. Given the potential for harm associated with perfluoro- carbon dosing in the most vulnerable of preterm infants it is reassuring to know that there are ways of giving per- fluorocarbon that can mitigate any increase in cerebral blood flow. This can be achieved best by either monitor- ing PaCO2 continuously during perfluorocarbon dosing and keeping it under tight control; not giving the dose over 5 minutes or faster; and not using the secondary lumen of an endotracheal tube. If partial liquid ventilation is to be used, then the best protection for the extremely preterm brain is to start it safely without disturbing cerebral blood flow. Data from these studies will enable optimisation of the dosing method to be used. Given the availability of a suitable product, randomised controlled trials of partial liquid ventilation in neonates are both feasible and desirable [27,28]. Now the design of such trials can incorporate the findings of this study to make the dosing procedure as safe as it can be for use in extremely preterm infants. 5. CONCLUSIONS The following effects were seen during perfluorocarbon dosing at the start of partial liquid ventilation in rabbits: Compared with conventional gas ventilation right carotid blood flow increased during perfluorocarbon dosing with 20 mL/kg. Similar, non-statistically significant effects were seen in cortical cerebral blood flow. There was also increased variability in cortical cerebral blood flow and similar, almost statistically significant, effects were seen in carotid blood flow variability. The effects on cerebral blood flow were similar to that seen in preterm lambs with lung disease. Cortical cerebral blood flow and right carotid blood flow were not different when using 10 mL/kg of perfluorocarbon compared with 20 mL/kg. There were no significant differences in variability of cortical cerebral blood flow and right carotid blood flow. The lack of any significant differences between dose volume groups on cortical cerebral blood flow was similar to that seen in preterm lambs. Cerebral blood flow did not differ with the rate of administration of 10 mL/kg of perfluorocarbon when starting partial liquid ventilation. The variability in carotid blood flow was increased, but this did not seem to be a consistent or clinically important differ- ence. The increase in cortical cerebral blood flow and right carotid flow (and their variability) were similar when the dose was given at the endotracheal tube tip (via a secondary lumen in the wall of the endo- tracheal tube) compared with doses given more proximally. If the peak inspiratory pressure was adjusted during perfluorocarbon dosing to maintain the arterial carbon dioxide between 45 and 50 mmHg then there was no increase in cerebral blood flow and there was less variability in carotid blood flow. 6. ACKNOWLEDGEMENTS We gratefully acknowledge financial support from The Prince Charles Hospital Foundation, the Royal Women’s Hospital Paul Weedon Bursary, and the Royal Women’s Hospital Auxiliary. Many thanks to Kathy Wilson who contributed significantly to the work in the animal laboratory. Thanks also to Michael Lindeberg and Bill Sommers who helped out in the animal laboratory. Thanks to Peter O’Rourke for his statistical advice. REFERENCES [1] Costeloe, K., Hennessy, E., Gibson, A.T., Marlow, N. and Wilkinson, A.R. (2000) The EPICure study: Out- comes to discharge from hospital for infants born at the threshold of viability. Pediatrics, 106, 659-671. doi:10.1542/peds.106.4.659 [2] Hennessy, E.M., Bracewell, M.A., Wood, N., Wolke, D., Costeloe, K., Gibson, A. and Marlow, N. for the EPICure Copyright © 2012 SciRes. OPEN ACCESS 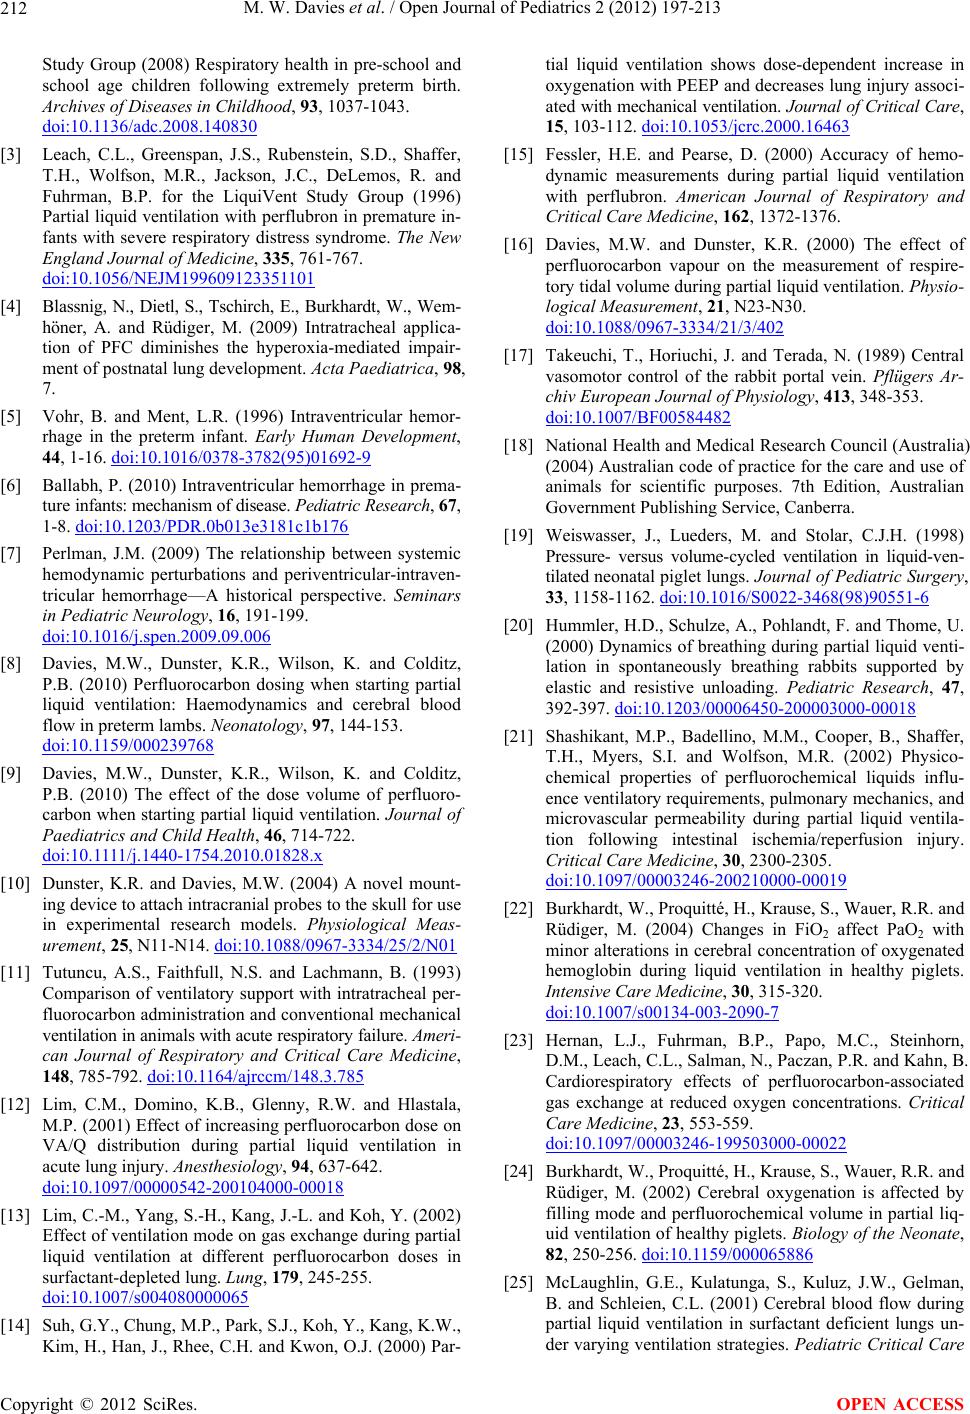 M. W. Davies et al. / Open Journal of Pediatrics 2 (2012) 197-213 212 Study Group (2008) Respiratory health in pre-school and school age children following extremely preterm birth. Archives of Diseases in Childhood, 93, 1037-1043. doi:10.1136/adc.2008.140830 [3] Leach, C.L., Greenspan, J.S., Rubenstein, S.D., Shaffer, T.H., Wolfson, M.R., Jackson, J.C., DeLemos, R. and Fuhrman, B.P. for the LiquiVent Study Group (1996) Partial liquid ventilation with perflubron in premature in- fants with severe respiratory distress syndrome. The New England Journal of Medicine, 335, 761-767. doi:10.1056/NEJM199609123351101 [4] Blassnig, N., Dietl, S., Tschirch, E., Burkhardt, W., Wem- höner, A. and Rüdiger, M. (2009) Intratracheal applica- tion of PFC diminishes the hyperoxia-mediated impair- ment of postnatal lung development. Acta Paediatrica, 98, 7. [5] Vohr, B. and Ment, L.R. (1996) Intraventricular hemor- rhage in the preterm infant. Early Human Development, 44, 1-16. doi:10.1016/0378-3782(95)01692-9 [6] Ballabh, P. (2010) Intraventricular hemorrhage in prema- ture infants: mechanism of disease. Pediatric Research, 67, 1-8. doi:10.1203/PDR.0b013e3181c1b176 [7] Perlman, J.M. (2009) The relationship between systemic hemodynamic perturbations and periventricular-intraven- tricular hemorrhage—A historical perspective. Seminars in Pediatric Neurology, 16, 191-199. doi:10.1016/j.spen.2009.09.006 [8] Davies, M.W., Dunster, K.R., Wilson, K. and Colditz, P.B. (2010) Perfluorocarbon dosing when starting partial liquid ventilation: Haemodynamics and cerebral blood flow in preterm lambs. Neonatology, 97, 144-153. doi:10.1159/000239768 [9] Davies, M.W., Dunster, K.R., Wilson, K. and Colditz, P.B. (2010) The effect of the dose volume of perfluoro- carbon when starting partial liquid ventilation. Journal of Paediatrics and Child Health, 46, 714-722. doi:10 .1111/j.144 0-1754.2010.01828.x [10] Dunster, K.R. and Davies, M.W. (2004) A novel mount- ing device to attach intracranial probes to the skull for use in experimental research models. Physiological Meas- urement, 25, N11-N14. doi:10.1088/0967-3334/25/2/N01 [11] Tutuncu, A.S., Faithfull, N.S. and Lachmann, B. (1993) Comparison of ventilatory support with intratracheal per- fluorocarbon administration and conventional mechanical ventilation in animals with acute respiratory failure. Ameri- can Journal of Respiratory and Critical Care Medicine, 148, 785-792. doi:10.1164/ajrccm/148.3.785 [12] Lim, C.M., Domino, K.B., Glenny, R.W. and Hlastala, M.P. (2001) Effect of increasing perfluorocarbon dose on VA/Q distribution during partial liquid ventilation in acute lung injury. Anesthesiology, 94, 637-642. doi:10.1097/00000542-200104000-00018 [13] Lim, C.-M., Yang, S.-H., Kang, J.-L. and Koh, Y. (2002) Effect of ventilation mode on gas exchange during partial liquid ventilation at different perfluorocarbon doses in surfactant-depleted lung. Lung, 179, 245-255. doi:10.1007/s004080000065 [14] Suh, G.Y., Chung, M.P., Park, S.J., Koh, Y., Kang, K.W., Kim, H., Han, J., Rhee, C.H. and Kwon, O.J. (2000) Par- tial liquid ventilation shows dose-dependent increase in oxygenation with PEEP and decreases lung injury associ- ated with mechanical ventilation. Journal of Critical Care, 15, 103-112. doi:10.1053/jcrc.2000.16463 [15] Fessler, H.E. and Pearse, D. (2000) Accuracy of hemo- dynamic measurements during partial liquid ventilation with perflubron. American Journal of Respiratory and Critical Care Medicine, 162, 1372-1376. [16] Davies, M.W. and Dunster, K.R. (2000) The effect of perfluorocarbon vapour on the measurement of respire- tory tidal volume during partial liquid ventilation. Physio- logical Measurement, 21, N23-N30. doi:10.1088/0967-3334/21/3/402 [17] Takeuchi, T., Horiuchi, J. and Terada, N. (1989) Central vasomotor control of the rabbit portal vein. Pflügers Ar- chiv European Journal of Physiology, 413, 348-353. doi:10.1007/BF00584482 [18] National Health and Medical Research Council (Australia) (2004) Australian code of practice for the care and use of animals for scientific purposes. 7th Edition, Australian Government Publishing Service, Canberra. [19] Weiswasser, J., Lueders, M. and Stolar, C.J.H. (1998) Pressure- versus volume-cycled ventilation in liquid-ven- tilated neonatal piglet lungs. Journal of Pediatric Surgery, 33, 1158-1162. doi:10.1016/S0022-3468(98)90551-6 [20] Hummler, H.D., Schulze, A., Pohlandt, F. and Thome, U. (2000) Dynamics of breathing during partial liquid venti- lation in spontaneously breathing rabbits supported by elastic and resistive unloading. Pediatric Research, 47, 392-397. doi:10.1203/00006450-200003000-00018 [21] Shashikant, M.P., Badellino, M.M., Cooper, B., Shaffer, T.H., Myers, S.I. and Wolfson, M.R. (2002) Physico- chemical properties of perfluorochemical liquids influ- ence ventilatory requirements, pulmonary mechanics, and microvascular permeability during partial liquid ventila- tion following intestinal ischemia/reperfusion injury. Critical Care Medicine, 30, 2300-2305. doi:10.1097/00003246-200210000-00019 [22] Burkhardt, W., Proquitté, H., Krause, S., Wauer, R.R. and Rüdiger, M. (2004) Changes in FiO2 affect PaO2 with minor alterations in cerebral concentration of oxygenated hemoglobin during liquid ventilation in healthy piglets. Intensive Care Medicine, 30, 315-320. doi:10.1007/s00134-003-2090-7 [23] Hernan, L.J., Fuhrman, B.P., Papo, M.C., Steinhorn, D.M., Leach, C.L., Salman, N., Paczan, P.R. and Kahn, B. Cardiorespiratory effects of perfluorocarbon-associated gas exchange at reduced oxygen concentrations. Critical Care Medicine, 23, 553-559. doi:10.1097/00003246-199503000-00022 [24] Burkhardt, W., Proquitté, H., Krause, S., Wauer, R.R. and Rüdiger, M. (2002) Cerebral oxygenation is affected by filling mode and perfluorochemical volume in partial liq- uid ventilation of healthy piglets. Biology of the Neonate, 82, 250-256. doi:10.1159/000065886 [25] McLaughlin, G.E., Kulatunga, S., Kuluz, J.W., Gelman, B. and Schleien, C.L. (2001) Cerebral blood flow during partial liquid ventilation in surfactant deficient lungs un- der varying ventilation strategies. Pediatric Critical Care Copyright © 2012 SciRes. OPEN ACCESS  M. W. Davies et al. / Open Journal of Pediatrics 2 (2012) 197-213 Copyright © 2012 SciRes. 213 OPEN ACCESS Medicine, 2, 88-92. doi:10.1097/00130478-200101000-00017 [26] Dimmitt, R.A., Beckman, S.A., Halamek, L.P., Moss, R.L., Mickas, N.A., Falco, D.A., Chubb, C. and Skars- gard, E.D. (2002) Effects of partial liquid ventilation on cerebral blood flow and cerebral metabolism in neonatal lambs. Journal of Pediatric Surgery, 37, 840-844. doi:10.1053/jpsu.2002.32884 [27] Wolfson, M.R. and Shaffer, T.H. (2005) Pulmonary ap- plications of perfluorochemical liquids: Ventilation and beyond. Paediatric Respiratory Reviews, 6, 117-127. doi:10.1016/j.prrv.2005.03.010 [28] Greenough, A. (2006) High frequency oscillation and liq- uid ventilation. Paediatric Respiratory Reviews, 7, S186- S188. doi:10.1016/j.prrv.2006.04.207 Abbreviations ANOVA: Analysis of variance; Cdyn: Dynamic compliance; CI: Confidence interval; CV: Coefficient of variation; ETT: Endotracheal tube; FiO2: Fraction of inspired oxygen; LDF: Laser Doppler flow; MuLETT: Multi-lumen endotracheal tube; PaCO2: Arterial carbon dioxide tension; PaO2: Arterial oxygen tension; PC: Pressure-controlled; PEEP: Positive end expiratory pressure; PFC: Perfluorocarbon; PIP: Peak inspiratory pressure; PLV: Partial liquid ventilation. |