

Paper Menu >>
Journal Menu >>
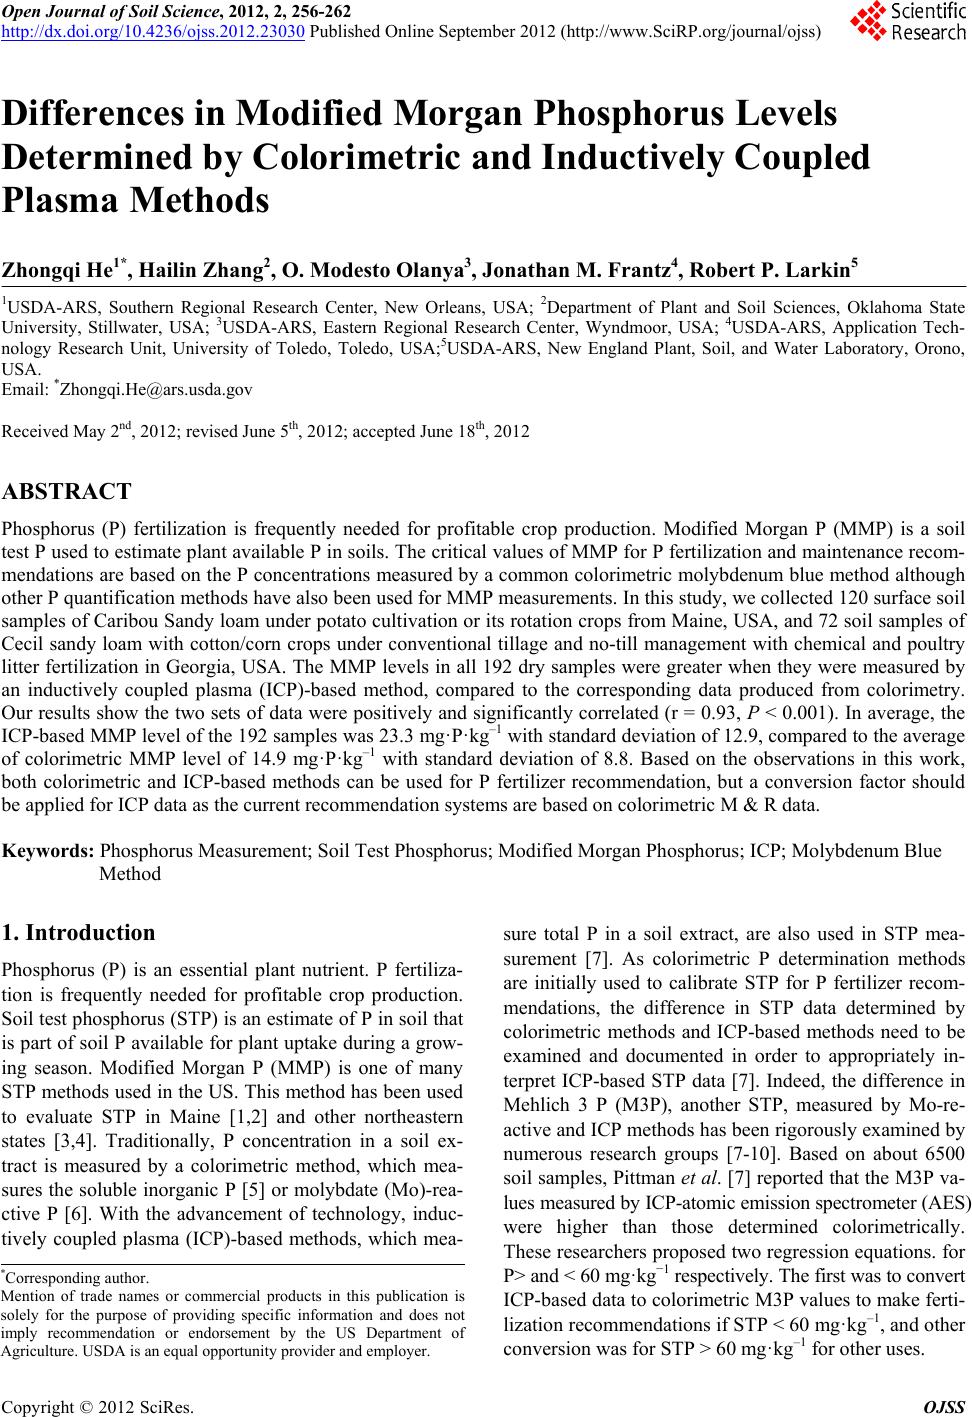 Open Journal of Soil Science, 2012, 2, 256-262 http://dx.doi.org/10.4236/ojss.2012.23030 Published Online September 2012 (http://www.SciRP.org/journal/ojss) Differences in Modified Morgan Phosphorus Levels Determined by Colorimetric and Inductively Coupled Plasma Methods Zhongqi He1*, Hailin Zhang2, O. Modesto Olanya3, Jonathan M. Frantz4, Robert P. Larkin5 1USDA-ARS, Southern Regional Research Center, New Orleans, USA; 2Department of Plant and Soil Sciences, Oklahoma State University, Stillwater, USA; 3USDA-ARS, Eastern Regional Research Center, Wyndmoor, USA; 4USDA-ARS, Application Tech- nology Research Unit, University of Toledo, Toledo, USA;5USDA-ARS, New England Plant, Soil, and Water Laboratory, Orono, USA. Email: *[email protected] Received May 2nd, 2012; revised June 5th, 2012; accepted June 18th, 2012 ABSTRACT Phosphorus (P) fertilization is frequently needed for profitable crop production. Modified Morgan P (MMP) is a soil test P used to estimate plant available P in soils. The critical values of MMP for P fertilization and maintenance recom- mendations are based on the P concentrations measured by a common colorimetric molybdenum blue method although other P quantification methods have also been used for MMP measurements. In this study, we collected 120 surface soil samples of Caribou Sandy loam under potato cultivation or its rotation crops from Maine, USA, and 72 soil samples of Cecil sandy loam with cotton/corn crops under conventional tillage and no-till management with chemical and poultry litter fertilization in Georgia, USA. The MMP levels in all 192 dry samples were greater when they were measured by an inductively coupled plasma (ICP)-based method, compared to the corresponding data produced from colorimetry. Our results show the two sets of data were positively and significantly correlated (r = 0.93, P < 0.001). In average, the ICP-based MMP level of the 192 samples was 23.3 mg·P·kg–1 with standard deviation of 12.9, compared to the average of colorimetric MMP level of 14.9 mg·P·kg–1 with standard deviation of 8.8. Based on the observations in this work, both colorimetric and ICP-based methods can be used for P fertilizer recommendation, but a conversion factor should be applied for ICP data as the current recommendation systems are based on colorimetric M & R data. Keywords: Phosphorus Measurement; Soil Test Phosphorus; Modified Morgan Phosphorus; ICP; Molybdenum Blue Method 1. Introduction Phosphorus (P) is an essential plant nutrient. P fertiliza- tion is frequently needed for profitable crop production. Soil test phosphorus (STP) is an estimate of P in soil that is part of soil P available for plant uptake during a grow- ing season. Modified Morgan P (MMP) is one of many STP methods used in the US. This method has been used to evaluate STP in Maine [1,2] and other northeastern states [3,4]. Traditionally, P concentration in a soil ex- tract is measured by a colorimetric method, which mea- sures the soluble inorganic P [5] or molybdate (Mo)-rea- ctive P [6]. With the advancement of technology, induc- tively coupled plasma (ICP)-based methods, which mea- sure total P in a soil extract, are also used in STP mea- surement [7]. As colorimetric P determination methods are initially used to calibrate STP for P fertilizer recom- mendations, the difference in STP data determined by colorimetric methods and ICP-based methods need to be examined and documented in order to appropriately in- terpret ICP-based STP data [7]. Indeed, the difference in Mehlich 3 P (M3P), another STP, measured by Mo-re- active and ICP methods has been rigorously examined by numerous research groups [7-10]. Based on about 6500 soil samples, Pittman et al. [7] reported that the M3P va- lues measured by ICP-atomic emission spectrometer (AES) were higher than those determined colorimetrically. These researchers proposed two regression equations. for P> and < 60 mg·kg−1 respectively. The first was to convert ICP-based data to colorimetric M3P values to make ferti- lization recommendations if STP < 60 mg·kg–1, and other conversion was for STP > 60 mg·kg–1 for other uses. *Corresponding author. Mention of trade names or commercial products in this publication is solely for the purpose of providing specific information and does no t imply recommendation or endorsement by the US Department o f Agriculture. USDA is an equal opportunity provider and employer. Copyright © 2012 SciRes. OJSS 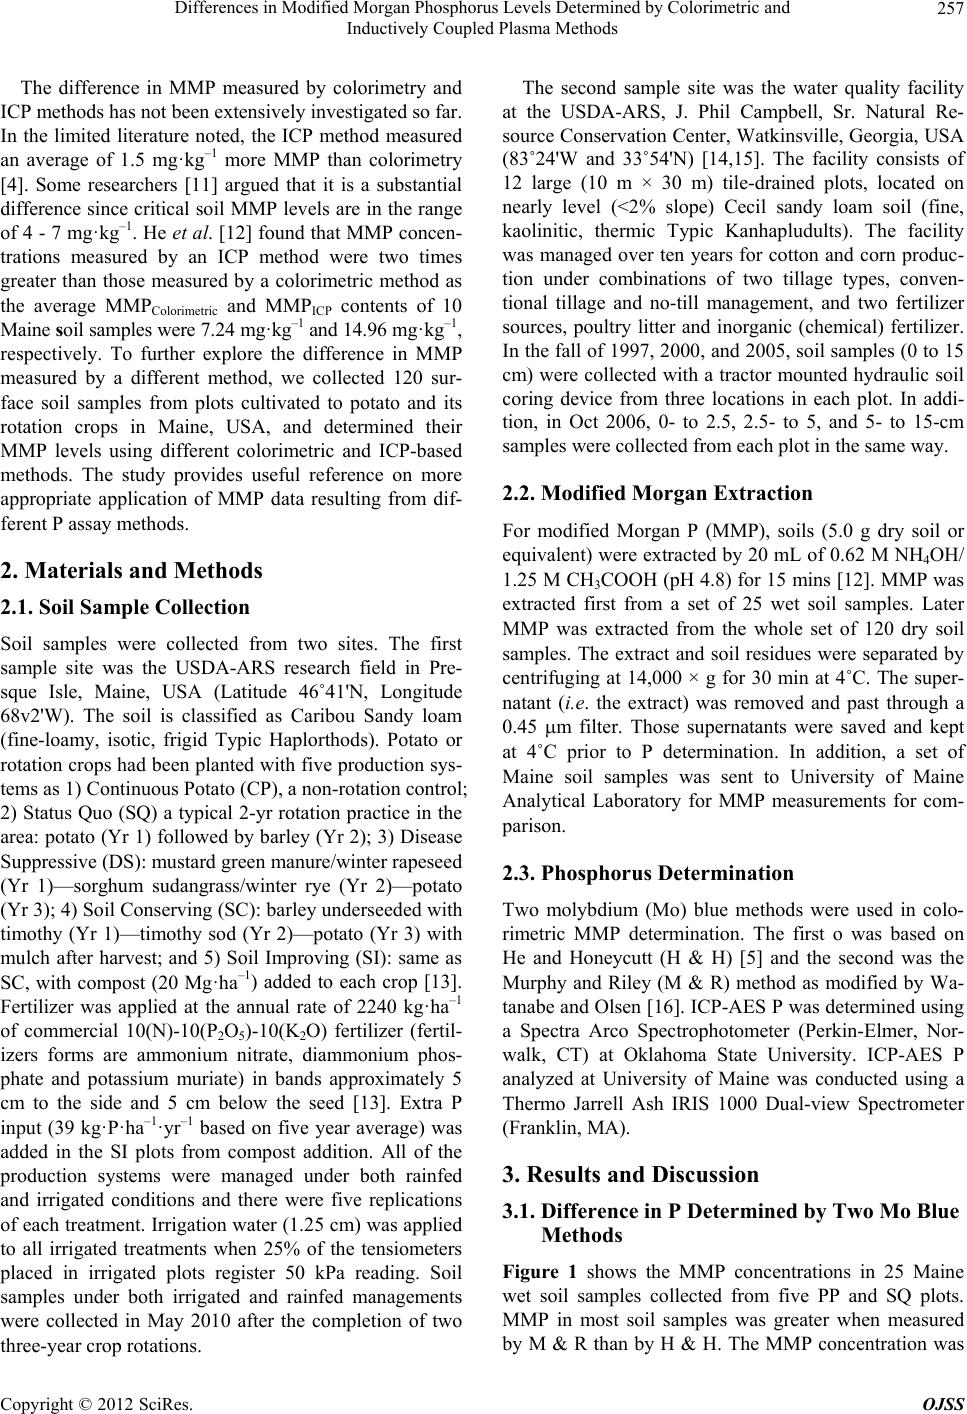 Differences in Modified Morgan Phosphorus Levels Determined by Colorimetric and Inductively Coupled Plasma Methods 257 The difference in MMP measured by colorimetry and ICP methods has not been extensively investigated so far. In the limited literature noted, the ICP method measured an average of 1.5 mg·kg–1 more MMP than colorimetry [4]. Some researchers [11] argued that it is a substantial difference since critical soil MMP levels are in the range of 4 - 7 mg·kg–1. He et al. [12] found that MMP concen- trations measured by an ICP method were two times greater than those measured by a colorimetric method as the average MMPColorimetric and MMPICP contents of 10 Maine soil samples were 7.24 mg·kg–1 and 14.96 mg·kg–1, respectively. To further explore the difference in MMP measured by a different method, we collected 120 sur- face soil samples from plots cultivated to potato and its rotation crops in Maine, USA, and determined their MMP levels using different colorimetric and ICP-based methods. The study provides useful reference on more appropriate application of MMP data resulting from dif- ferent P assay methods. 2. Materials and Methods 2.1. Soil Sample Collection Soil samples were collected from two sites. The first sample site was the USDA-ARS research field in Pre- sque Isle, Maine, USA (Latitude 46˚41'N, Longitude 68v2'W). The soil is classified as Caribou Sandy loam (fine-loamy, isotic, frigid Typic Haplorthods). Potato or rotation crops had been planted with five production sys- tems as 1) Continuous Potato (CP), a non-rotation control; 2) Status Quo (SQ) a typical 2-yr rotation practice in the area: potato (Yr 1) followed by barley (Yr 2); 3) Disease Suppressive (DS): mustard green manure/winter rapeseed (Yr 1)—sorghum sudangrass/winter rye (Yr 2)—potato (Yr 3); 4) Soil Conserving (SC): barley underseeded with timothy (Yr 1)—timothy sod (Yr 2)—potato (Yr 3) with mulch after harvest; and 5) Soil Improving (SI): same as SC, with compost (20 Mg·ha–1 ) added to each crop [13]. Fertilizer was applied at the annual rate of 2240 kg·ha–1 of commercial 10(N)-10(P2O5)-10(K2O) fertilizer (fertil- izers forms are ammonium nitrate, diammonium phos- phate and potassium muriate) in bands approximately 5 cm to the side and 5 cm below the seed [13]. Extra P input (39 kg·P·ha–1·yr–1 based on five year average) was added in the SI plots from compost addition. All of the production systems were managed under both rainfed and irrigated conditions and there were five replications of each treatment. Irrigation water (1.25 cm) was applied to all irrigated treatments when 25% of the tensiometers placed in irrigated plots register 50 kPa reading. Soil samples under both irrigated and rainfed managements were collected in May 2010 after the completion of two three-year crop rotations. The second sample site was the water quality facility at the USDA-ARS, J. Phil Campbell, Sr. Natural Re- source Conservation Center, Watkinsville, Georgia, USA (83˚24'W and 33˚54'N) [14,15]. The facility consists of 12 large (10 m × 30 m) tile-drained plots, located on nearly level (<2% slope) Cecil sandy loam soil (fine, kaolinitic, thermic Typic Kanhapludults). The facility was managed over ten years for cotton and corn produc- tion under combinations of two tillage types, conven- tional tillage and no-till management, and two fertilizer sources, poultry litter and inorganic (chemical) fertilizer. In the fall of 1997, 2000, and 2005, soil samples (0 to 15 cm) were collected with a tractor mounted hydraulic soil coring device from three locations in each plot. In addi- tion, in Oct 2006, 0- to 2.5, 2.5- to 5, and 5- to 15-cm samples were collected from each plot in the same way. 2.2. Modified Morgan Extraction For modified Morgan P (MMP), soils (5.0 g dry soil or equivalent) were extracted by 20 mL of 0.62 M NH4OH/ 1.25 M CH3COOH (pH 4.8) for 15 mins [12]. MMP was extracted first from a set of 25 wet soil samples. Later MMP was extracted from the whole set of 120 dry soil samples. The extract and soil residues were separated by centrifuging at 14,000 × g for 30 min at 4˚C. The super- natant (i.e. the extract) was removed and past through a 0.45 m filter. Those supernatants were saved and kept at 4˚C prior to P determination. In addition, a set of Maine soil samples was sent to University of Maine Analytical Laboratory for MMP measurements for com- parison. 2.3. Phosphorus Determination Two molybdium (Mo) blue methods were used in colo- rimetric MMP determination. The first o was based on He and Honeycutt (H & H) [5] and the second was the Murphy and Riley (M & R) method as modified by Wa- tanabe and Olsen [16]. ICP-AES P was determined using a Spectra Arco Spectrophotometer (Perkin-Elmer, Nor- walk, CT) at Oklahoma State University. ICP-AES P analyzed at University of Maine was conducted using a Thermo Jarrell Ash IRIS 1000 Dual-view Spectrometer (Franklin, MA). 3. Results and Discussion 3.1. Difference in P Determined by Two Mo Blue Methods Figure 1 shows the MMP concentrations in 25 Maine wet soil samples collected from five PP and SQ plots. MMP in most soil samples was greater when measured by M & R than by H & H. The MMP concentration was Copyright © 2012 SciRes. OJSS 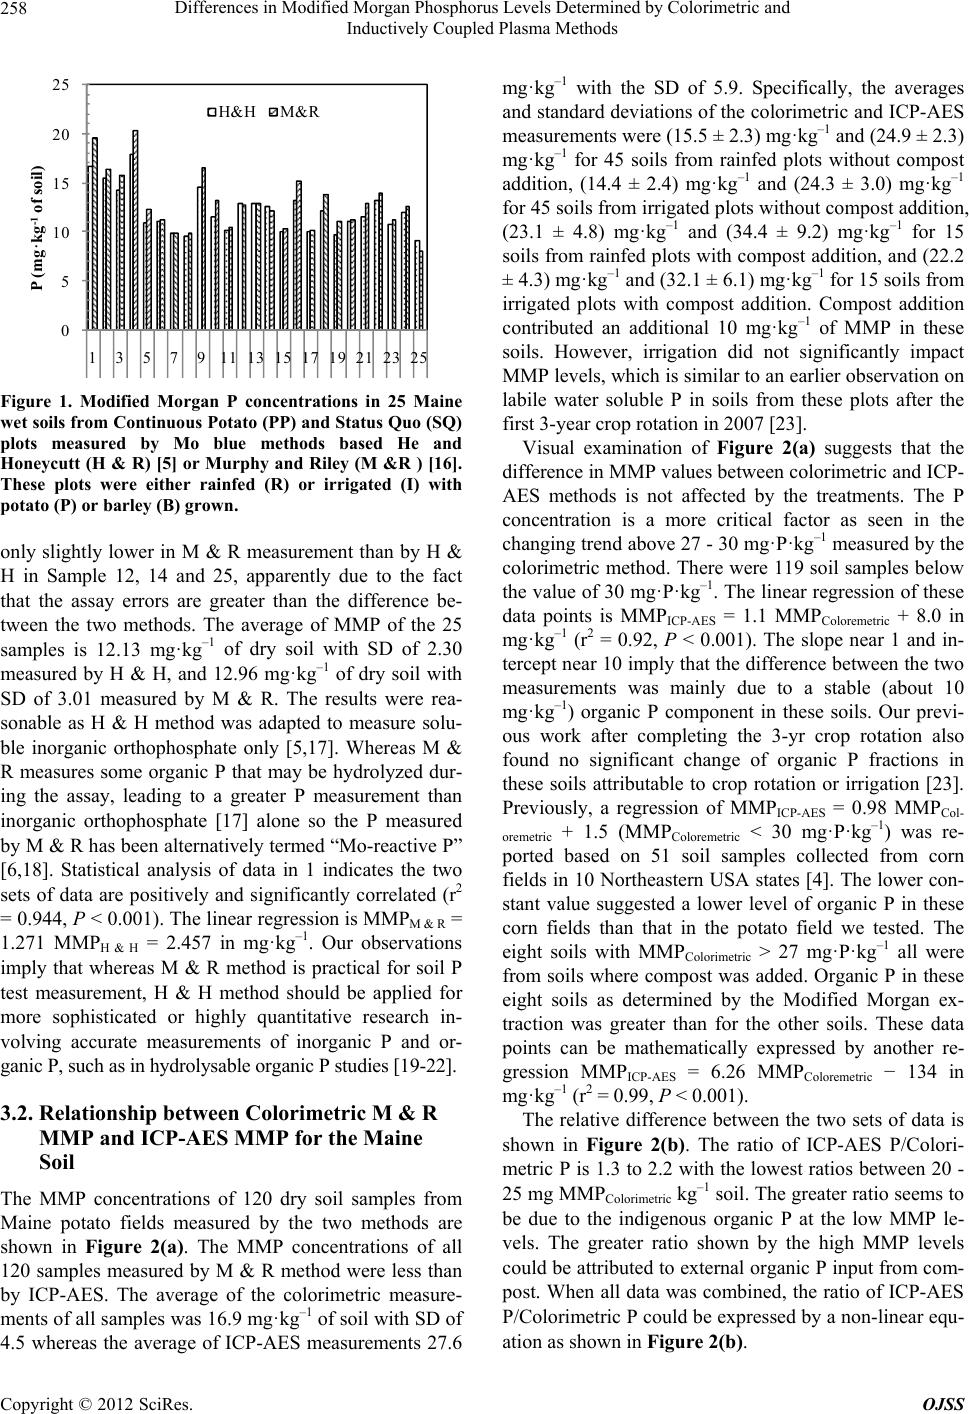 Differences in Modified Morgan Phosphorus Levels Determined by Colorimetric and Inductively Coupled Plasma Methods 258 0 5 10 15 20 25 1357911 13 15 1719 21 2325 P (mg·kg -1 of s oi l ) H&H M&R Figure 1. Modified Morgan P concentrations in 25 Maine wet soils from Continuous Potato (PP ) and Status Quo (SQ) plots measured by Mo blue methods based He and Honeycutt (H & R) [5] or Murphy and Riley (M &R ) [16]. These plots were either rainfed (R) or irrigated (I) with potato (P) or barley (B) grown. only slightly lower in M & R measurement than by H & H in Sample 12, 14 and 25, apparently due to the fact that the assay errors are greater than the difference be- tween the two methods. The average of MMP of the 25 samples is 12.13 mg·kg–1 of dry soil with SD of 2.30 measured by H & H, and 12.96 mg·kg–1 of dry soil with SD of 3.01 measured by M & R. The results were rea- sonable as H & H method was adapted to measure solu- ble inorganic orthophosphate only [5,17]. Whereas M & R measures some organic P that may be hydrolyzed dur- ing the assay, leading to a greater P measurement than inorganic orthophosphate [17] alone so the P measured by M & R has been alternatively termed “Mo-reactive P” [6,18]. Statistical analysis of data in 1 indicates the two sets of data are positively and significantly correlated (r2 = 0.944, P < 0.001). The linear regression is MMPM & R = 1.271 MMPH & H = 2.457 in mg·kg–1. Our observations imply that whereas M & R method is practical for soil P test measurement, H & H method should be applied for more sophisticated or highly quantitative research in- volving accurate measurements of inorganic P and or- ganic P, such as in hydrolysable organic P studies [19-22]. 3.2. Relationship between Colorimetric M & R MMP and ICP-AES MMP for the Maine Soil The MMP concentrations of 120 dry soil samples from Maine potato fields measured by the two methods are shown in Figure 2(a). The MMP concentrations of all 120 samples measured by M & R method were less than by ICP-AES. The average of the colorimetric measure- ments of all samples was 16.9 mg·kg–1 of soil with SD of 4.5 whereas the average of ICP-AES measurements 27.6 mg·kg–1 with the SD of 5.9. Specifically, the averages and standard deviations of the colorimetric and ICP-AES measurements were (15.5 ± 2.3) mg·kg–1 and (24.9 ± 2.3) mg·kg–1 for 45 soils from rainfed plots without compost addition, (14.4 ± 2.4) mg·kg–1 and (24.3 ± 3.0) mg·kg–1 for 45 soils from irrigated plots without compost addition, (23.1 ± 4.8) mg·kg–1 and (34.4 ± 9.2) mg·kg–1 for 15 soils from rainfed plots with compost addition, and (22.2 ± 4.3) mg·kg–1 and (32.1 ± 6.1) mg·kg–1 for 15 soils from irrigated plots with compost addition. Compost addition contributed an additional 10 mg·kg–1 of MMP in these soils. However, irrigation did not significantly impact MMP levels, which is similar to an earlier observation on labile water soluble P in soils from these plots after the first 3-year crop rotation in 2007 [23]. Visual examination of Figure 2(a) suggests that the difference in MMP values between colorimetric and ICP- AES methods is not affected by the treatments. The P concentration is a more critical factor as seen in the changing trend above 27 - 30 mg·P·kg–1 measured by the colorimetric method. There were 119 soil samples below the value of 30 mg·P·kg–1. The linear regression of these data points is MMPICP-AES = 1.1 MMPColoremetric + 8.0 in mg·kg–1 (r2 = 0.92, P < 0.001). The slope near 1 and in- tercept near 10 imply that the difference between the two measurements was mainly due to a stable (about 10 mg·kg–1) organic P component in these soils. Our previ- ous work after completing the 3-yr crop rotation also found no significant change of organic P fractions in these soils attributable to crop rotation or irrigation [23]. Previously, a regression of MMPICP-AES = 0.98 MMPCol- oremetric + 1.5 (MMPColoremetric < 30 mg·P·kg–1) was re- ported based on 51 soil samples collected from corn fields in 10 Northeastern USA states [4]. The lower con- stant value suggested a lower level of organic P in these corn fields than that in the potato field we tested. The eight soils with MMPColorimetric > 27 mg·P·kg–1 all were from soils where compost was added. Organic P in these eight soils as determined by the Modified Morgan ex- traction was greater than for the other soils. These data points can be mathematically expressed by another re- gression MMPICP-AES = 6.26 MMPColoremetric − 134 in mg·kg–1 (r2 = 0.99, P < 0.001). The relative difference between the two sets of data is shown in Figure 2(b). The ratio of ICP-AES P/Colori- metric P is 1.3 to 2.2 with the lowest ratios between 20 - 25 mg MMPColorimetric kg–1 soil. The greater ratio seems to be due to the indigenous organic P at the low MMP le- vels. The greater ratio shown by the high MMP levels could be attributed to external organic P input from com- post. When all data was combined, the ratio of ICP-AES P/Colorimetric P could be expressed by a non-linear equ- ation as shown in Figure 2(b). Copyright © 2012 SciRes. OJSS 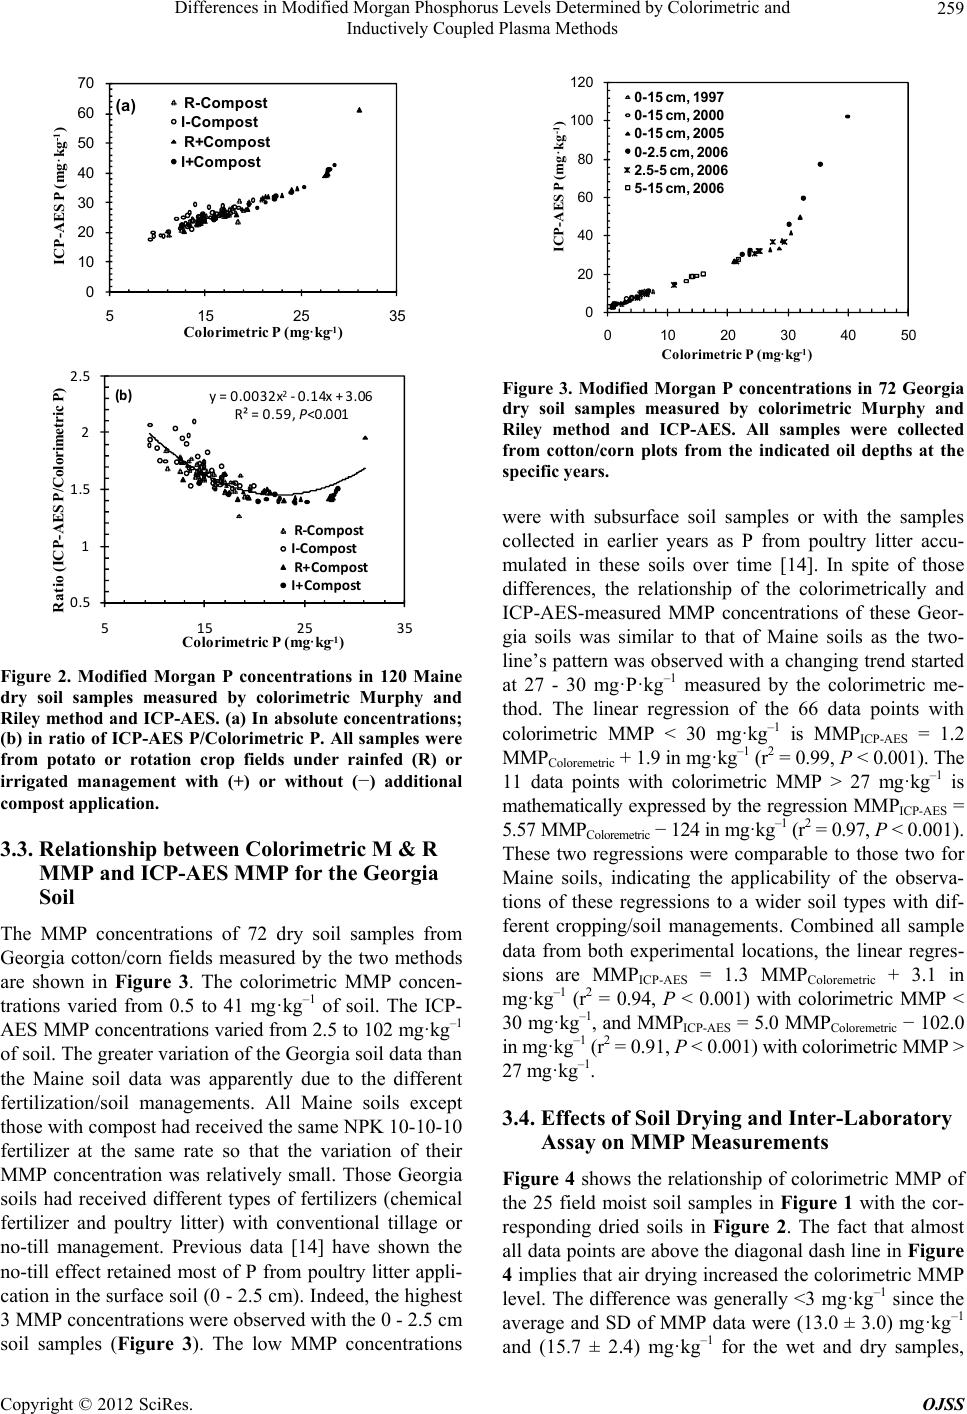 Differences in Modified Morgan Phosphorus Levels Determined by Colorimetric and Inductively Coupled Plasma Methods 259 0 10 20 30 40 50 60 70 51525 ICP-AES P (mg·kg -1 ) Colorimetric P (mg ·kg -1 )35 R-Co mpost I- Com post R+Compost I+Com p ost (a) y=0.0032x 2 ‐0.14x+3.06 R²=0.59,P<0.001 0.5 1 1.5 2 2.5 5 15253 Rati o (I CP-AE S P/C o lo ri metri c P) Colorimetric P (mg ·kg -1 )5 R‐Compost I‐Compost R+Co mp o st I+C ompost ( b ) Figure 2. Modified Morgan P concentrations in 120 Maine dry soil samples measured by colorimetric Murphy and Riley method and ICP-AES. (a) In absolute concentrations; (b) in ratio of ICP-AES P/Colorimetric P. All samples were from potato or rotation crop fields under rainfed (R) or irrigated management with (+) or without (−) additional compost application. 3.3. Relationship between Colorimetric M & R MMP and ICP-AES MMP for the Georgia Soil The MMP concentrations of 72 dry soil samples from Georgia cotton/corn fields measured by the two methods are shown in Figure 3. The colorimetric MMP concen- trations varied from 0.5 to 41 mg·kg–1 of soil. The ICP- AES MMP concentrations varied from 2.5 to 102 mg·kg–1 of soil. The greater variation of the Georgia soil data than the Maine soil data was apparently due to the different fertilization/soil managements. All Maine soils except those with compost had received the same NPK 10-10-10 fertilizer at the same rate so that the variation of their MMP concentration was relatively small. Those Georgia soils had received different types of fertilizers (chemical fertilizer and poultry litter) with conventional tillage or no-till management. Previous data [14] have shown the no-till effect retained most of P from poultry litter appli- cation in the surface soil (0 - 2.5 cm). Indeed, the highest 3 MMP concentrations were observed with the 0 - 2.5 cm soil samples (Figure 3). The low MMP concentrations 0 20 40 60 80 100 120 0 102030405 I CP-AE S P (mg·kg -1 ) Colorimetric P (mg ·kg -1 )0 0-15 cm, 1997 0-15 cm, 2000 0-15 cm, 2005 0-2.5 cm, 2006 2.5-5 cm, 2006 5-15 cm, 2006 Figure 3. Modified Morgan P concentrations in 72 Georgia dry soil samples measured by colorimetric Murphy and Riley method and ICP-AES. All samples were collected from cotton/corn plots from the indicated oil depths at the specific years. were with subsurface soil samples or with the samples collected in earlier years as P from poultry litter accu- mulated in these soils over time [14]. In spite of those differences, the relationship of the colorimetrically and ICP-AES-measured MMP concentrations of these Geor- gia soils was similar to that of Maine soils as the two- line’s pattern was observed with a changing trend started at 27 - 30 mg·P·kg–1 measured by the colorimetric me- thod. The linear regression of the 66 data points with colorimetric MMP < 30 mg·kg–1 is MMPICP-AES = 1.2 MMPColoremetric + 1.9 in mg·kg–1 (r2 = 0.99, P < 0.001). The 11 data points with colorimetric MMP > 27 mg·kg–1 is mathematically expressed by the regression MMPICP-AES = 5.57 MMPColoremetric − 124 in mg·kg–1 (r2 = 0.97, P < 0.001). These two regressions were comparable to those two for Maine soils, indicating the applicability of the observa- tions of these regressions to a wider soil types with dif- ferent cropping/soil managements. Combined all sample data from both experimental locations, the linear regres- sions are MMPICP-AES = 1.3 MMPColoremetric + 3.1 in mg·kg–1 (r2 = 0.94, P < 0.001) with colorimetric MMP < 30 mg·kg–1, and MMPICP-AES = 5.0 MMPColore me tr ic − 102.0 in mg·kg–1 (r2 = 0.91, P < 0.001) with colorimetric MMP > 27 mg·kg–1. 3.4. Effects of Soil Drying and Inter-Laboratory Assay on MMP Measurements Figure 4 shows the relationship of colorimetric MMP of the 25 field moist soil samples in Figure 1 with the cor- responding dried soils in Figure 2. The fact that almost all data points are above the diagonal dash line in Figure 4 implies that air drying increased the colorimetric MMP level. The difference was generally <3 mg·kg–1 since the average and SD of MMP data were (13.0 ± 3.0) mg·kg–1 and (15.7 ± 2.4) mg·kg–1 for the wet and dry samples, Copyright © 2012 SciRes. OJSS 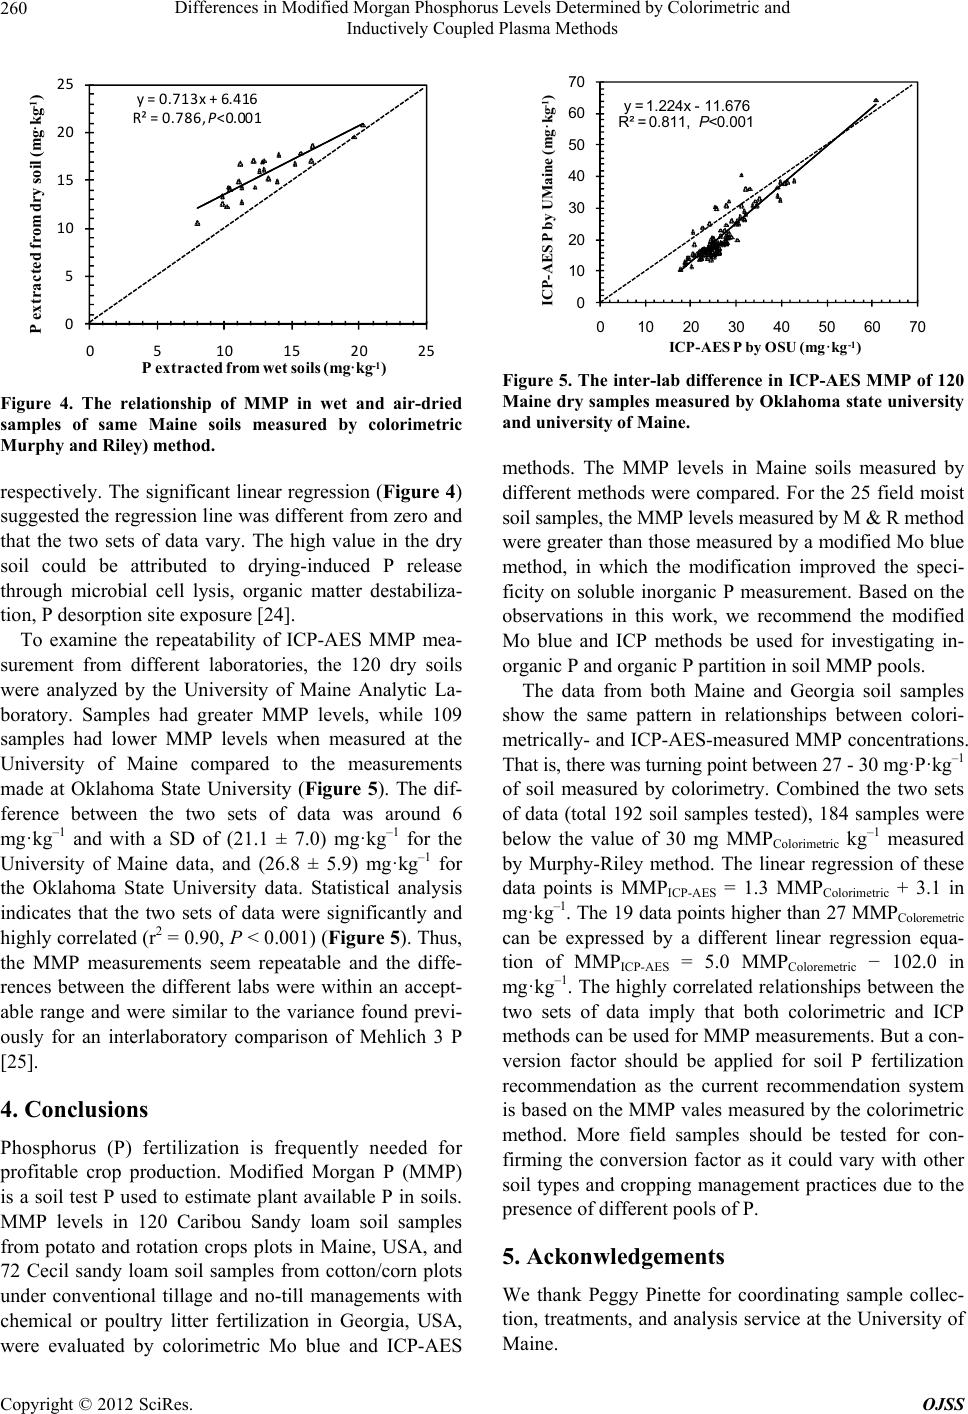 Differences in Modified Morgan Phosphorus Levels Determined by Colorimetric and Inductively Coupled Plasma Methods 260 y=0.713x+6.416 R²=0.786,P<0.001 0 5 10 15 20 25 0510 15 20 25 P extracted fro m dry s oil (mg ·k g -1 ) P extracted fro m we t soil s (m g ·kg -1 ) Figure 4. The relationship of MMP in wet and air-dried samples of same Maine soils measured by colorimetric Murphy and Riley ) method. respectively. The significant linear regression (Figure 4) suggested the regression line was different from zero and that the two sets of data vary. The high value in the dry soil could be attributed to drying-induced P release through microbial cell lysis, organic matter destabiliza- tion, P desorption site exposure [24]. To examine the repeatability of ICP-AES MMP mea- surement from different laboratories, the 120 dry soils were analyzed by the University of Maine Analytic La- boratory. Samples had greater MMP levels, while 109 samples had lower MMP levels when measured at the University of Maine compared to the measurements made at Oklahoma State University (Figure 5). The dif- ference between the two sets of data was around 6 mg·kg–1 and with a SD of (21.1 ± 7.0) mg·kg–1 for the University of Maine data, and (26.8 ± 5.9) mg·kg–1 for the Oklahoma State University data. Statistical analysis indicates that the two sets of data were significantly and highly correlated (r2 = 0.90, P < 0.001) (Figure 5). Thus, the MMP measurements seem repeatable and the diffe- rences between the different labs were within an accept- able range and were similar to the variance found previ- ously for an interlaboratory comparison of Mehlich 3 P [25]. 4. Conclusions Phosphorus (P) fertilization is frequently needed for profitable crop production. Modified Morgan P (MMP) is a soil test P used to estimate plant available P in soils. MMP levels in 120 Caribou Sandy loam soil samples from potato and rotation crops plots in Maine, USA, and 72 Cecil sandy loam soil samples from cotton/corn plots under conventional tillage and no-till managements with chemical or poultry litter fertilization in Georgia, USA, were evaluated by colorimetric Mo blue and ICP-AES y = 1.224x -11.676 R² = 0.811, P<0.001 0 10 20 30 40 50 60 70 0 10203040506070 ICP-AES P by UMaine(mg·kg -1 ) I CP-AE S P by OSU (m g·k g -1 ) Figure 5. The inter-lab difference in ICP-AES MMP of 120 Maine dry samples measured by Oklahoma state university and university of Maine. methods. The MMP levels in Maine soils measured by different methods were compared. For the 25 field moist soil samples, the MMP levels measured by M & R method were greater than those measured by a modified Mo blue method, in which the modification improved the speci- ficity on soluble inorganic P measurement. Based on the observations in this work, we recommend the modified Mo blue and ICP methods be used for investigating in- organic P and organic P partition in soil MMP pools. The data from both Maine and Georgia soil samples show the same pattern in relationships between colori- metrically- and ICP-AES-measured MMP concentrations. That is, there was turning point between 27 - 30 mg·P·kg–1 of soil measured by colorimetry. Combined the two sets of data (total 192 soil samples tested), 184 samples were below the value of 30 mg MMPColorimetric kg–1 measured by Murphy-Riley method. The linear regression of these data points is MMPICP-AES = 1.3 MMPColorimetric + 3.1 in mg·kg–1. The 19 data points higher than 27 MMPColoremetric can be expressed by a different linear regression equa- tion of MMPICP-AES = 5.0 MMPColoremetric − 102.0 in mg·kg–1. The highly correlated relationships between the two sets of data imply that both colorimetric and ICP methods can be used for MMP measurements. But a con- version factor should be applied for soil P fertilization recommendation as the current recommendation system is based on the MMP vales measured by the colorimetric method. More field samples should be tested for con- firming the conversion factor as it could vary with other soil types and cropping management practices due to the presence of different pools of P. 5. Ackonwledgements We thank Peggy Pinette for coordinating sample collec- tion, treatments, and analysis service at the University of Maine. Copyright © 2012 SciRes. OJSS 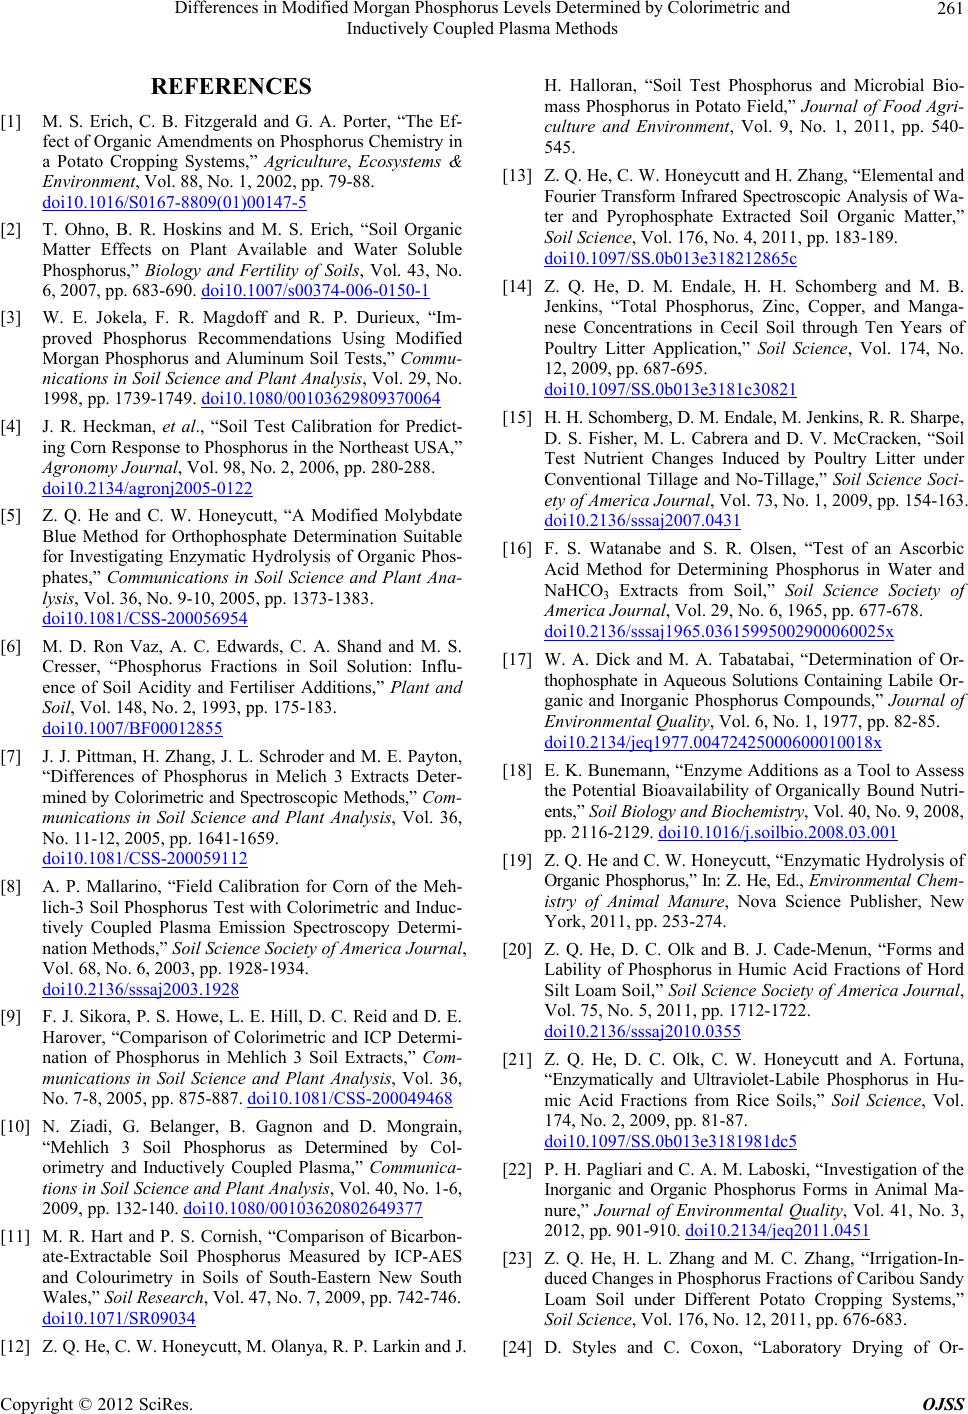 Differences in Modified Morgan Phosphorus Levels Determined by Colorimetric and Inductively Coupled Plasma Methods 261 REFERENCES [1] M. S. Erich, C. B. Fitzgerald and G. A. Porter, “The Ef- fect of Organic Amendments on Phosphorus Chemistry in a Potato Cropping Systems,” Agriculture, Ecosystems & Environment, Vol. 88, No. 1, 2002, pp. 79-88. doi10.1016/S0167-8809(01)00147-5 [2] T. Ohno, B. R. Hoskins and M. S. Erich, “Soil Organic Matter Effects on Plant Available and Water Soluble Phosphorus,” Biology and Fertility of Soils, Vol. 43, No. 6, 2007, pp. 683-690. doi10.1007/s00374-006-0150-1 [3] W. E. Jokela, F. R. Magdoff and R. P. Durieux, “Im- proved Phosphorus Recommendations Using Modified Morgan Phosphorus and Aluminum Soil Tests,” Commu- nications in Soil Science and Plant Analysis, Vol. 29, No. 1998, pp. 1739-1749. doi10.1080/00103629809370064 [4] J. R. Heckman, et al., “Soil Test Calibration for Predict- ing Corn Response to Phosphorus in the Northeast USA,” Agronomy Journal, Vol. 98, No. 2, 2006, pp. 280-288. doi10.2134/agronj2005-0122 [5] Z. Q. He and C. W. Honeycutt, “A Modified Molybdate Blue Method for Orthophosphate Determination Suitable for Investigating Enzymatic Hydrolysis of Organic Phos- phates,” Communications in Soil Science and Plant Ana- lysis, Vol. 36, No. 9-10, 2005, pp. 1373-1383. doi10.1081/CSS-200056954 [6] M. D. Ron Vaz, A. C. Edwards, C. A. Shand and M. S. Cresser, “Phosphorus Fractions in Soil Solution: Influ- ence of Soil Acidity and Fertiliser Additions,” Plant and Soil, Vol. 148, No. 2, 1993, pp. 175-183. doi10.1007/BF00012855 [7] J. J. Pittman, H. Zhang, J. L. Schroder and M. E. Payton, “Differences of Phosphorus in Melich 3 Extracts Deter- mined by Colorimetric and Spectroscopic Methods,” Com- munications in Soil Science and Plant Analysis, Vol. 36, No. 11-12, 2005, pp. 1641-1659. doi10.1081/CSS-200059112 [8] A. P. Mallarino, “Field Calibration for Corn of the Meh- lich-3 Soil Phosphorus Test with Colorimetric and Induc- tively Coupled Plasma Emission Spectroscopy Determi- nation Methods,” Soil Science Society of America Journal, Vol. 68, No. 6, 2003, pp. 1928-1934. doi10.2136/sssaj2003.1928 [9] F. J. Sikora, P. S. Howe, L. E. Hill, D. C. Reid and D. E. Harover, “Comparison of Colorimetric and ICP Determi- nation of Phosphorus in Mehlich 3 Soil Extracts,” Com- munications in Soil Science and Plant Analysis, Vol. 36, No. 7-8, 2005, pp. 875-887. doi10.1081/CSS-200049468 [10] N. Ziadi, G. Belanger, B. Gagnon and D. Mongrain, “Mehlich 3 Soil Phosphorus as Determined by Col- orimetry and Inductively Coupled Plasma,” Communica- tions in Soil Science and Plant Analysis, Vol. 40, No. 1-6, 2009, pp. 132-140. doi10.1080/00103620802649377 [11] M. R. Hart and P. S. Cornish, “Comparison of Bicarbon- ate-Extractable Soil Phosphorus Measured by ICP-AES and Colourimetry in Soils of South-Eastern New South Wales,” Soil Research, Vol. 47, No. 7, 2009, pp. 742-746. doi10.1071/SR09034 [12] Z. Q. He, C. W. Honeycutt, M. Olanya, R. P. Larkin and J. H. Halloran, “Soil Test Phosphorus and Microbial Bio- mass Phosphorus in Potato Field,” Journal of Food Agri- culture and Environment, Vol. 9, No. 1, 2011, pp. 540- 545. [13] Z. Q. He, C. W. Honeycutt and H. Zhang, “Elemental and Fourier Transform Infrared Spectroscopic Analysis of Wa- ter and Pyrophosphate Extracted Soil Organic Matter,” Soil Science, Vol. 176, No. 4, 2011, pp. 183-189. doi10.1097/SS.0b013e318212865c [14] Z. Q. He, D. M. Endale, H. H. Schomberg and M. B. Jenkins, “Total Phosphorus, Zinc, Copper, and Manga- nese Concentrations in Cecil Soil through Ten Years of Poultry Litter Application,” Soil Science, Vol. 174, No. 12, 2009, pp. 687-695. doi10.1097/SS.0b013e3181c30821 [15] H. H. Schomberg, D. M. Endale, M. Jenkins, R. R. Sharpe, D. S. Fisher, M. L. Cabrera and D. V. McCracken, “Soil Test Nutrient Changes Induced by Poultry Litter under Conventional Tillage and No-Tillage,” Soil Science Soci- ety of America Journal, Vol. 73, No. 1, 2009, pp. 154-163. doi10.2136/sssaj2007.0431 [16] F. S. Watanabe and S. R. Olsen, “Test of an Ascorbic Acid Method for Determining Phosphorus in Water and NaHCO3 Extracts from Soil,” Soil Science Society of America Journal, Vol. 29, No. 6, 1965, pp. 677-678. doi10.2136/sssaj1965.03615995002900060025x [17] W. A. Dick and M. A. Tabatabai, “Determination of Or- thophosphate in Aqueous Solutions Containing Labile Or- ganic and Inorganic Phosphorus Compounds,” Journal of Environmental Quality, Vol. 6, No. 1, 1977, pp. 82-85. doi10.2134/jeq1977.00472425000600010018x [18] E. K. Bunemann, “Enzyme Additions as a Tool to Assess the Potential Bioavailability of Organically Bound Nutri- ents,” Soil Biol ogy an d Bioche mistry , Vol. 40, No. 9, 2008, pp. 2116-2129. doi10.1016/j.soilbio.2008.03.001 [19] Z. Q. He and C. W. Honeycutt, “Enzymatic Hydrolysis of Organic Phosphorus,” In: Z. He, Ed., Environmental Che m- istry of Animal Manure, Nova Science Publisher, New York, 2011, pp. 253-274. [20] Z. Q. He, D. C. Olk and B. J. Cade-Menun, “Forms and Lability of Phosphorus in Humic Acid Fractions of Hord Silt Loam Soil,” Soil Science Society of America Journal, Vol. 75, No. 5, 2011, pp. 1712-1722. doi10.2136/sssaj2010.0355 [21] Z. Q. He, D. C. Olk, C. W. Honeycutt and A. Fortuna, “Enzymatically and Ultraviolet-Labile Phosphorus in Hu- mic Acid Fractions from Rice Soils,” Soil Science, Vol. 174, No. 2, 2009, pp. 81-87. doi10.1097/SS.0b013e3181981dc5 [22] P. H. Pagliari and C. A. M. Laboski, “Investigation of the Inorganic and Organic Phosphorus Forms in Animal Ma- nure,” Journal of Environmental Quality, Vol. 41, No. 3, 2012, pp. 901-910. doi10.2134/jeq2011.0451 [23] Z. Q. He, H. L. Zhang and M. C. Zhang, “Irrigation-In- duced Changes in Phosphorus Fractions of Caribou Sandy Loam Soil under Different Potato Cropping Systems,” Soil Science, Vol. 176, No. 12, 2011, pp. 676-683. [24] D. Styles and C. Coxon, “Laboratory Drying of Or- Copyright © 2012 SciRes. OJSS  Differences in Modified Morgan Phosphorus Levels Determined by Colorimetric and Inductively Coupled Plasma Methods Copyright © 2012 SciRes. OJSS 262 ganic-Matter Rich Soils: Phosphorus Solubility Effects, Influence of Soil Characteristics, and Consequences for Environmental Interpretation,” Geoderma, Vol. 136, No. 1-2, 2006, pp. 120-135. doi10.1016/j.geoderma.2006.03.017 [25] H. L. Zhang, S. Kariuki, J. L. Schroder, M. E. Payton and C. Focht, “Interlaboratory Validation of the Mehlich 3 Me- thod for Extraction of Plant-Available Phosphorus,” Jour- nal of AOAC International, Vol. 92, No. 1, 2009, pp. 91- 102. |