

Paper Menu >>
Journal Menu >>
 Psychology 2012. Vol.3, Special Issue, 81 8-824 Published Online September 2012 in SciRes (http://www.SciRP.org/journal/psych) http://dx.doi.org/10.4236/psych.2012.329124 Copyright © 2012 SciRes. 818 Prevalence of Common Mental Disorders among Incident Individuals on Long-Term Sickness Absence When Compensating for Non-Participation* Hans Joergen Soegaard#, Pernille Pedersen Research Unit West, Regional Psychiatric Services West, Herning, Denmark Email: #[email protected] Received June 15th, 2012; re vised J uly 16th, 2012; accepted August 13th, 2012 Objective: In a cross-sectional study regarding long-term sickness absence to estimate: 1) The prevalence of mental disorders among incident individuals on long-term sickness absence; 2) The diagnostic fre- quencies in total and divided by participants and non-participants; and 3) Divided by socio-demographic characteristics. Method: In a well-defined cohort with complete coverage, 2414 individuals entering LSA during one year were identified. In a two-phase study, the 1121 (46.4%) participants constituted Phase 1 and they were screened for mental disorders by Common Mental Disorders—Screening Questionnaire. In Phase 2, a subgroup of Phase 1, 337 individuals were diagnosed by means of Present State Examination. Compensation for non-participation was carried out by multiple imputation by the use of data known for all sick-listed individuals from public registers. Results: The frequencies of mental disorders were: Any mental disorder 52%, depression 36%, anxiety 15%, somatoform disorder 7%, alcohol and drug depend- ence 6%, and personality disorder 6%. The diagnostic frequencies were highest for non-participants, fe- male gender, age below 40 years, urban areas, single status, higher education, high skills/ managers, without a job, and low income. Conclusion: The prevalence of mental disorders among incident indi- viduals on LSA was found to be about 50%. The burden on society may be higher than expected from previous studies solely based on participants as the methods compensating for missing values in this study indicated that the frequency of mental disorders was higher among non-participants than among partici- pants. Keywords: Sickness Absence; Epidemiology; Diagnosis; Multiple Imputation; Non-Participation Background Mental disorders are frequent as the 12-months prevalence of any psychiatric disorder in population samples has been esti- mated to be as high as 27% (Wittchen & Jacobi, 2005). In addi- tion to the burden imposed on individuals and families, the high frequency of mental disorders imposes large burdens on society and the public health care system (Andlin-Sobocki et al., 2005; Murray & Lopez, 1997; OECD, 2009). The burdens on societies are primarily due to indirect costs such as payment of sickness absence benefits, early retirement, and early death (Andlin-Sobocki et al., 2005). The burden is increasing as mental health problems in OECD countries now account for a third of all new disability benefit claims on aver- age, and in some countries nearly 50% (OECD, 2009). In addi- tion, the cumulative incidence of sick-listed individuals with mental disorders on long-term sickness absence (LSA) is in- creasing (Hensing et al., 2006). With regard to LSA this was in this study defined as exceed- ing a continuous sickness absence period of eight weeks as well as in some other studies (Hensing et al., 2006). The exact bur- den imposed by LSA may be difficult to estimate for more reasons: 1) The exact population of sick-listed individuals is difficult to identify because the administration of sickness benefits in most countries, except the Scandinavian countries, is based on private insurance or by companies; 2) Mental disor- ders are often undetected e.g. in general practice (Christensen et al., 2005b); and 3) Because of a large degree of non-partici- pation in epidemiological studies. Perspective of the Study The perspective of this study was to overcome the obstacles mentioned above by applying methods to: 1) Identify all sick- listed individuals from public registers regarding sickness benefits; 2) Apply methods for detection of mental disorders by the use of a standardised instrument for the identification of psychiatric diagnoses; and 3) Compensate for missing data by the application of multiple imputation by the use of data from public registers. The identification of all sick-listed individuals can be accomplished in this study which was carried out in a Danish population where the administration of sickness absence benefits is based on public registers. Danish Legislation Concerning Sickness Absence In Denmark, it is a citizen’s privilege to be compensated fi- nancially during sickness absence, if the citizen was available for work prior to the sickness absence. This applies whether the citizen was sick-listed and holding a job or unemployed pro- *Financial Support: The study was funded from a Governmental grant to Ringkjøbing County; Declaration of Interest: The authors declare no con- flict of interest. #Corres p ondin g autho r .  H. J. SOEGAARD, P. PEDERSEN vided the citizen is unable to work due to an illness or injury. Rehabilitation officers in the jobcentres are responsible for the rehabilitation process. The role of general practitioners and other physicians is that they can be requested to do examina- tions and statements about sick-leave diagnoses, expected dura- tion of sickness absence and necessary rehabilitative measures. Aim The aims of the study in regard to individuals on LSA were in a cross-sectional study as follows: 1) To estimate the prevalence of common mental disorders among incident individuals on LSA. 2) To estimate the frequencies of mental disorders in total and among participants and non-participants. 3) To estimate the diagnostic f requencies distributed by socio- demographic characteristics. Methods Study Popu l at i o n The study was conducted in a well-defined Danish popula- tion of approximately 118,000 inhabitants of whom 50% were living in the urban municipality of Herning. The participants were recruited from public registers on sickness benefits. Indi- viduals who had their first day of a sickness absence period between the 30th of August 2004 and the 29th of August 2005 and who later proceeded into LSA were included, but only for the first sickness absence period registered within the year of the study. On a weekly basis, the social services provided the researchers information about sick-listed individuals. Within one week of entering LSA, a sick-listed individual was sent a questionnaire by post. The individuals were included if they were sick-listed from ordinary work, part time work, or ad- justed work, and if they were unemployed and their benefits were registered as changing from unemployment benefits to sickness absence benefits. Individuals who were under 18 years on the day when the sickness absence period exceeded eight weeks were excluded. This was also the case for individuals who were absent due to childbirth, and individuals who were unable to understand Danish. Within the geographical area, 56,589 individuals between 20 and 64 years were registered as available for the labour market on the 1st of January 2005 (Sta- tistics Denmark, 2011a). Two-Phase D esign Within the year studied, 2414 individuals entered LSA of which 1121 (46.4%) participated by returning the above-men- tioned questionnaire and an informed consent, referred to as participants. The 1293 individuals who did not respond at all are referred to as non-participants. The study was carried out by a two-phase design. Phase 1 comprised the 1121 participants who had filled in the Common Mental Disorders—Screening Questionnaire (CMD-SQ) which is a screening instrument cov- ering the categories depression, anxiety, somatoform disorders, and alcohol dependence (Christensen et al., 2005a). In Phase 1, 844 individuals were identified as scoring above the predefined levels of psychological distress in the subscales of CMD-SQ. By random, 423 individuals of this group were allocated to a psychiatric examination which included Present State Examina- tion (PSE) as diagnostic gold standard (World Health Organi- zation, 1994). Moreover, 11 individuals who did not meet the predefined criteria for psychological distress were also ran- domly allocated to a psychiatric examination. Due to non-par- ticipation at this stage, Phase 2 constituted 337 individuals who participated in a psychiatric examination. The selection process and non-participation is described in detail elsewhere (Soegaard & Bech, 2009). Data All individuals on LSA were linked to official registers through their Personal Identification Numbers in the Danish Centralized Civil Register (Det Centrale Personregister, The Civil Registration System in Denmark, 2011). Since 1968, this register has comprised every person who is a Danish citizen, and it is updated on a daily basis. In attaining information about the medical history of the individuals on LSA, The National Board of Health (The National Board of Health, 2011b) deliv- ered information regarding admission to hospitals, emergency rooms and outpatient clinics. Demo-graphic and socio-eco- nomic variables were delivered from Statistics Denmark (Sta- tistics Denmark, 2011b). The Medication Database (The Na- tional Board of Health, 2011a) delivered information on re- deemed prescriptions on psychoactive drugs (ATC codes N03, N05A, N05B, N05C, N06A and N06B) and the variable was dichotomised as the individual prescribed at least one type of the drugs or none (WHO Collaborating Centre for Drug Statis- tics Methodology, 2011). The Danish National Labour market Authority’s DREAM database (Arbejdsmarkedsstyrelsen & The National Labour Market authority, 2010) registers data con- cerning benefits for unemployment, sickness absence, and other kinds of economic or public compensation. The data were di- chotomised as receiving a benefit or not at the time just before being sick-listed, however not receiving sickness benefits. The final socio-demographic variables were: Gender, municipality, civil status, children living at home, education, employment, employment situation, and annually gross income. The catego- ries of each variable are mentioned in. All individuals in Phase 1 provided information in the posted questionnaire regarding psychological distress in the form of CMD-DQ (Christensen et al., 2005a) and quality of life in the form of SF-36 (Bjorner et al., 1998; Ware & Kosinski, 2001). In Phase 2, the individuals had their psychiatric diagnoses verified by means of a psychiatric examination which applied PSE as gold standard with output in the form of ICD-10 diag- noses (World Health Organisation, 2006; World Health Or- ganization, 1994). The psychiatric examinations were carried out by the investigator without knowledge of the screening result. Disorders not covered by PSE such as personality disor- ders were diagnosed by the psychiatrist according to ICD-10 (World Health Organisation, 2006). Total Non-Participation and Partial Non-Participation The study was not affected by Incomplete coverage (non- coverage) (Bisoffi et al., 2000) as all individuals on LSA were identified from public registers regarding sickness absence benefits. The Total non-participation rate was 53.6% which comprised the 1293 individuals who did not participate in any respect (Bisoffi et al., 2000). Partial non-participation occurred as non-participation by the design since only 434 (61.0%) indi- viduals of Phase 1 were allocated to the diagnostic verification. Copyright © 2012 SciRes. 819 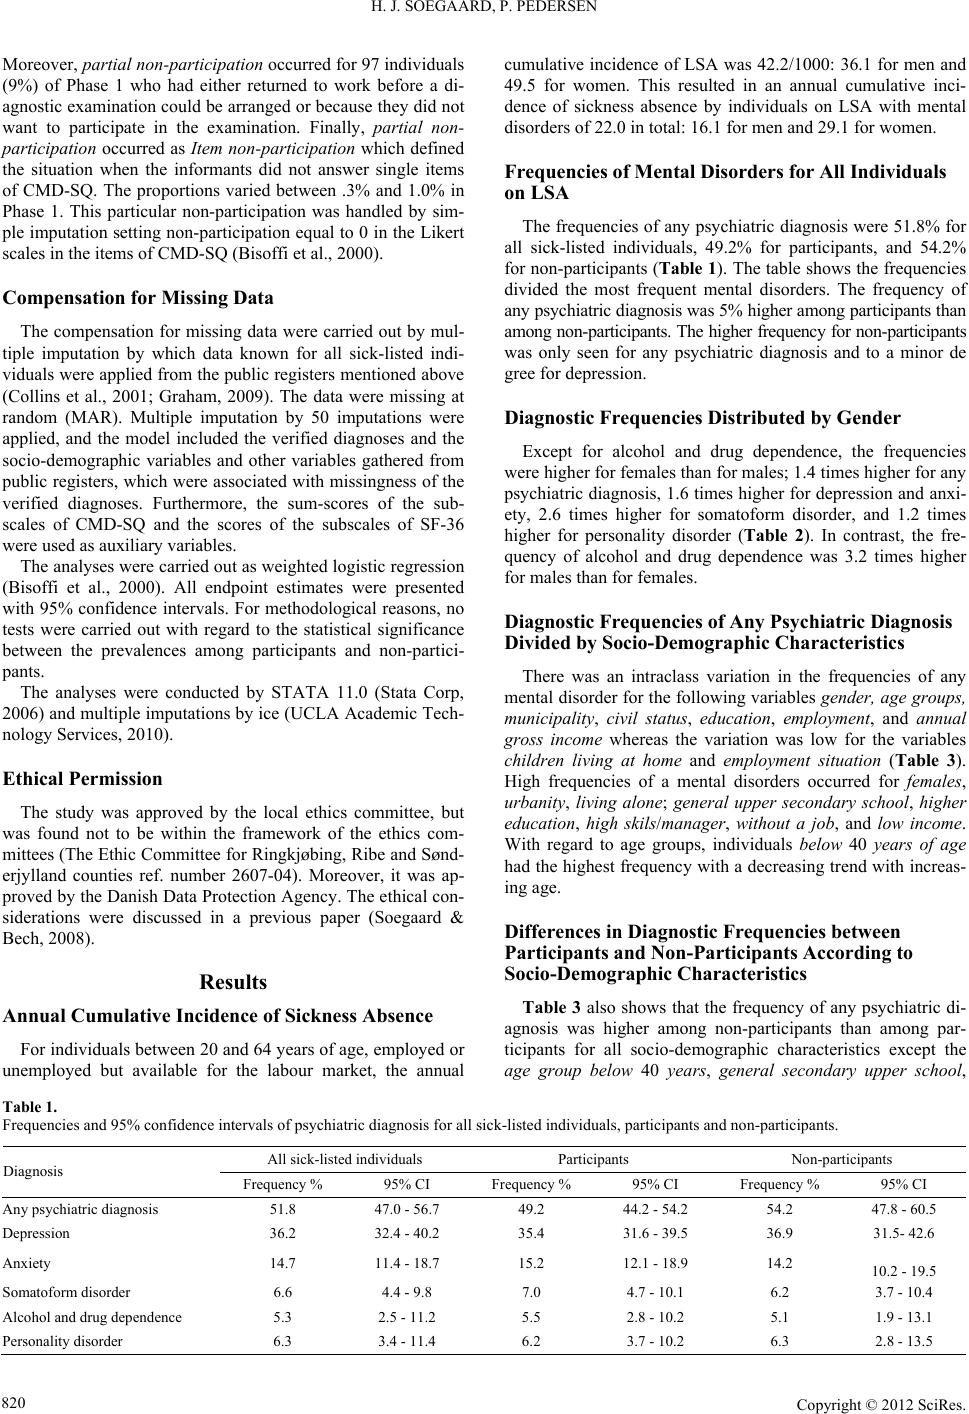 H. J. SOEGAARD, P. PEDERSEN Copyright © 2012 SciRes. 820 Moreover, partial non-participation occurred for 97 individuals (9%) of Phase 1 who had either returned to work before a di- agnostic examination could be arranged or because they did not want to participate in the examination. Finally, partial non- participation occurred as Item non-participation which defined the situation when the informants did not answer single items of CMD-SQ. The proportions varied between .3% and 1.0% in Phase 1. This particular non-participation was handled by sim- ple imputation setting non-participation equal to 0 in the Likert scales in the it ems of CMD-SQ (Bisoffi et al., 2000). Compensation for Missin g D a ta The compensation for missing data were carried out by mul- tiple imputation by which data known for all sick-listed indi- viduals were applied from the public registers mentioned above (Collins et al., 2001; Graham, 2009). The data were missing at random (MAR). Multiple imputation by 50 imputations were applied, and the model included the verified diagnoses and the socio-demographic variables and other variables gathered from public registers, which were associated with missingness of the verified diagnoses. Furthermore, the sum-scores of the sub- scales of CMD-SQ and the scores of the subscales of SF-36 were used as auxiliary variables. The analyses were carried out as weighted logistic regression (Bisoffi et al., 2000). All endpoint estimates were presented with 95% confidence intervals. For methodological reasons, no tests were carried out with regard to the statistical significance between the prevalences among participants and non-partici- pants. The analyses were conducted by STATA 11.0 (Stata Corp, 2006) and multiple imputations by ice (UCLA Academic Tech- nology Services, 2010). Ethical Permission The study was approved by the local ethics committee, but was found not to be within the framework of the ethics com- mittees (The Ethic Committee for Ringkjøbing, Ribe and Sønd- erjylland counties ref. number 2607-04). Moreover, it was ap- proved by the Danish Data Protection Agency. The ethical con- siderations were discussed in a previous paper (Soegaard & Bech, 2008). Results Annual Cum ulative Incide nce of Sickness Absence For individuals between 20 and 64 years of age, employed or unemployed but available for the labour market, the annual cumulative incidence of LSA was 42.2/1000: 36.1 for men and 49.5 for women. This resulted in an annual cumulative inci- dence of sickness absence by individuals on LSA with mental disorders of 22.0 in total: 16.1 for men and 29.1 for women. Frequencies of Mental Disorders for All Individuals on LSA The frequencies of any psychiatric diagnosis were 51.8% for all sick-listed individuals, 49.2% for participants, and 54.2% for non-participants (Table 1). The table shows the frequencies divided the most frequent mental disorders. The frequency of any psychiatric diagnosis was 5% higher among pa rticipants tha n among non- participants. The higher frequency for non-participan ts was only seen for any psychiatric diagnosis and to a minor de gree for depression. Diagnostic Frequencies Distributed by Gender Except for alcohol and drug dependence, the frequencies were higher for females than for males; 1.4 times higher for any psychiatric diagnosis, 1.6 times higher for depression and anxi- ety, 2.6 times higher for somatoform disorder, and 1.2 times higher for personality disorder (Table 2). In contrast, the fre- quency of alcohol and drug dependence was 3.2 times higher for males than for females. Diagnostic Frequencies of Any Psychiatric Diagnosis Divided by Socio-Demographic Characteristics There was an intraclass variation in the frequencies of any mental disorder for the following variables gender, age groups, municipality, civil status, education, employment, and annual gross income whereas the variation was low for the variables children living at home and employment situation (Table 3). High frequencies of a mental disorders occurred for females, urbanity, living alone; general upper secondary school, higher education, high skils/manager, without a job, and low income. With regard to age groups, individuals below 40 years of age had the highest frequency with a decreasing trend with increas- ing age. Differences in Diagnostic Frequencies between Participants and Non-Participants According to Socio-Demographic Characteristics Table 3 also shows that the frequency of any psychiatric di- agnosis was higher among non-participants than among par- ticipants for all socio-demographic characteristics except the age group below 40 years, general secondary upper school, Table 1. Frequencies and 95% confidence i n tervals of psychia t ric diagnosis for all sick-lis t ed individuals, participants an d n on-participants. All sick-listed i ndividuals Participants Non-participants Diagnosis Frequency % 95% CI Frequency % 95% CI Frequency % 95% CI Any psychiatric diagnosis 51.8 47.0 - 56.7 49.2 44.2 - 54.2 54.2 47.8 - 60.5 Depression 36.2 32.4 - 40.2 35.4 31.6 - 39.5 36.9 31.5- 42.6 Anxiety 14.7 11.4 - 18.7 15.2 12.1 - 18.9 14.2 10.2 - 19.5 Somatoform disorder 6.6 4.4 - 9.8 7.0 4.7 - 10.1 6.2 3.7 - 10.4 Alcohol an d d rug dependence 5.3 2.5 - 11.2 5.5 2.8 - 10.2 5.1 1.9 - 13.1 Personality disorder 6.3 3.4 - 11.4 6.2 3.7 - 10.2 6.3 2.8 - 13.5 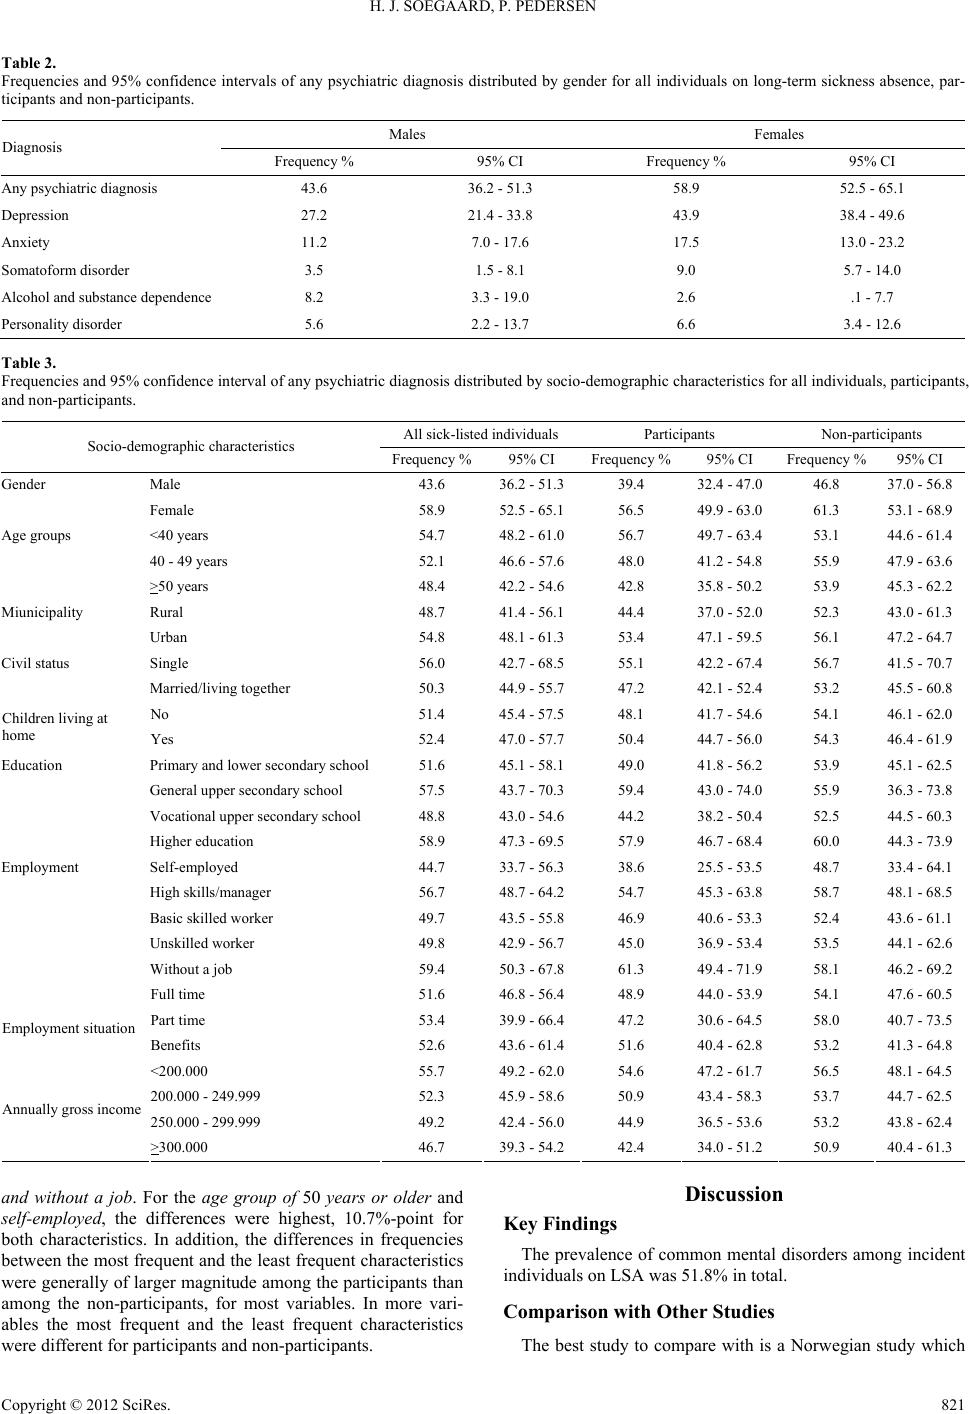 H. J. SOEGAARD, P. PEDERSEN Table 2. Frequencies and 95% confidence intervals of any psychiatric diagnosis distributed by gender for all individuals on long-term sickness absence, par- ticipants and non-participants. Males Females Diagnosis Frequency % 95% CI Frequency % 95% CI Any psychi atric diagnosis 43.6 36.2 - 51.3 58.9 52.5 - 65.1 Depression 27.2 21.4 - 33.8 43.9 38.4 - 49.6 Anxiety 11.2 7.0 - 17.6 17.5 13.0 - 23.2 Somatoform disorder 3.5 1.5 - 8.1 9.0 5.7 - 14.0 Alcohol and substance dependence 8.2 3.3 - 19.0 2.6 .1 - 7.7 Personality disorder 5.6 2.2 - 13.7 6.6 3.4 - 12.6 Table 3. Frequencies and 95% confidence interval of any psychiatric diagnosis distributed by socio-demographic characteristics for all individuals, participants, and non-participants. All sick-listed i ndividuals Participants Non-participants Socio-demographic characteristics Frequency %95% CI Frequency %95% CI Frequency % 95% CI Gender Male 43.6 36.2 - 51.3 39.4 32.4 - 47.0 46.8 37.0 - 56.8 Female 58.9 52.5 - 65.1 56.5 49.9 - 63.0 61.3 53.1 - 68.9 Age groups <40 yea rs 54.7 48.2 - 61.0 56.7 49.7 - 63.4 53.1 44.6 - 61.4 40 - 49 years 52.1 46.6 - 57.6 48.0 41.2 - 54.8 55.9 47.9 - 63.6 >50 years 48.4 42.2 - 54.6 42.8 35.8 - 50.2 53.9 45.3 - 62.2 Miunicipality Rural 48.7 41.4 - 56.1 44.4 37.0 - 52.0 52.3 43.0 - 61.3 Urban 54.8 48.1 - 61.3 53.4 47.1 - 59.5 56.1 47.2 - 64.7 Civil status Single 56.0 42.7 - 68.5 55.1 42.2 - 67.4 56.7 41.5 - 70.7 Married/living together 50.3 44.9 - 55.7 47.2 42.1 - 52.4 53.2 45.5 - 60.8 No 51.4 45.4 - 57.5 48.1 41.7 - 54.6 54.1 46.1 - 62.0 Children livin g at home Yes 52.4 47.0 - 57.7 50.4 44.7 - 56.0 54.3 46.4 - 61.9 Education Primary and lower secondary school 51.6 45.1 - 58.1 49.0 41.8 - 56.2 53.9 45.1 - 62.5 General upper secondary sc hool 57.5 43.7 - 70.3 59.4 43.0 - 74.0 55.9 36.3 - 73.8 Vocational upper secondary school 48.8 43.0 - 54.6 44.2 38.2 - 50.4 52.5 44.5 - 60.3 Higher education 58.9 47.3 - 69.5 57.9 46.7 - 68.4 60.0 44.3 - 73.9 Employment Self-employed 44.7 33.7 - 56.3 38.6 25.5 - 53.5 48.7 33.4 - 64.1 High skills/manager 56.7 48.7 - 64.2 54.7 45.3 - 63.8 58.7 48.1 - 68.5 Basic skilled worker 49.7 43.5 - 55.8 46.9 40.6 - 53.3 52.4 43.6 - 61.1 Unskilled worker 49.8 42.9 - 56.7 45.0 36.9 - 53.4 53.5 44.1 - 62.6 Without a job 59.4 50.3 - 67.8 61.3 49.4 - 71.9 58.1 46.2 - 69.2 Full time 51.6 46.8 - 56.4 48.9 44.0 - 53.9 54.1 47.6 - 60.5 Part time 53.4 39.9 - 66.4 47.2 30.6 - 64.5 58.0 40.7 - 73.5 Employment situation Benefits 52.6 43.6 - 61.4 51.6 40.4 - 62.8 53.2 41.3 - 64.8 <200.000 55.7 49.2 - 62.0 54.6 47.2 - 61.7 56.5 48.1 - 64.5 200.000 - 249.999 52.3 45.9 - 58.6 50.9 43.4 - 58.3 53.7 44.7 - 62.5 250.000 - 299.999 49.2 42.4 - 56.0 44.9 36.5 - 53.6 53.2 43.8 - 62.4 Annually gross income >300.000 46.7 39.3 - 54.2 42.4 34.0 - 51.2 50.9 40.4 - 61.3 and without a job. For the age group of 50 years or older and self-employed, the differences were highest, 10.7%-point for both characteristics. In addition, the differences in frequencies between the most frequent and the least frequent characteristics were generally of larger magnitude among the participants than among the non-participants, for most variables. In more vari- ables the most frequent and the least frequent characteristics were different for participants and non-par t i c i pants. Discussion Key Findings The prevalence of common mental disorders among incident individuals on LSA was 51.8% in total. Comparison with Other Studies The best study to compare with is a Norwegian study which Copyright © 2012 SciRes. 821  H. J. SOEGAARD, P. PEDERSEN found a cumulative incidence of sickness absence for females with mental disorders of 46/1000 individuals available for the labour market and of 22 for males in 2000 (Hensing et al., 2006). The cumulative incidence in the Norwegian study was higher than in the present study showing a cumulative inci- dence of 29 for females and 16 for males even though the pre- sent study applied methods to identify undetected mental dis- orders which not was the case in the Norwegian study. The explanation may be due to differences in national legislation and practice regarding economic compensation for sickness absence. In addition, the differences may be rooted in variation over time with regard to the incentive to go on sickness absence since the Norwegian figures are from 2000 and the figures in this study from 2004/2005. Finally, in Norway, it is obligatory, when entering LSA, to code the sick-leave diagnoses in accor- dance with the ICPC-classification standards which is different from the Danish practice (Lambets et al., 1993). The obligation of this coding may improve the awareness of coding mental disorders. The higher frequency of mental disorders for the female gender than for male gender shown in this study is in accor- dance with consistent findings from population samples for affective disorders and anxiety (Alonso et al., 2004; Bijl et al., 1998; Lindeman et al., 2000; Hodiamont et al., 1987; Offord et al., 1996; Bijl et al., 2002; Peen et al., 2007; Jenkins et al., 1997; Bebbington et al., 2003; Akhtar-Danesh & Landeen, 2007; Kessler et al., 1994). The opposite for alcohol and drug de- pendence was also in agreement with other studies. (Alonso et al., 2004; Bijl et al., 1998; Lindeman et al., 2000; Hodiamont et al., 1987; Offord et al., 1996; Bijl et al., 2002; Peen et al., 2007; Jenkins et al., 1997; Bebbington et al., 2003; Akhtar-Danesh & Landeen, 2007; Kessler et al., 1994). The high frequency of mental disorders for individuals aged below 40 years as well as the trend of decreasing frequencies of mental disorders with older age as found in this study was also in accordance with the majority of other studies (Alonso et al., 2004; Bijl et al., 1998; Lindeman et al., 2000; Offord et al., 1996; Bijl et al., 2002; Beb- bington et al., 2003; Akhtar-Danesh & Landeen, 2007; Kes- sler et al., 1994). Several population studies have shown higher frequencies of mental disorders with increasing urbanity (Bijl et al., 1998; Hodiamont et al., 1987; Peen et al., 2007; Jenkins et al., 1997). This trend was verified in the present study as well. However, the trend may not be as apparent in this study as in other studies due to the fact that the most urbanised area was a city of only 60.000 inhabitants. Living alone (unmarried, widow or widower, separated, divorced, and not living with children), has in other studies especially for the female gender been associated with a high frequency of mental disorders (Alonso et al., 2004; Bijl et al., 1998; Lindeman et al., 2000; Hodiamont et al., 1987; Jenkins et al., 1997; Bebbington et al., 2003; Akhtar-Danesh & Landeen, 2007). These findings were confirmed in this study as far as civil status is concerned, but not with regard to whether the individuals were living with children below 18 years of age or not. In this study, the high frequency of mental disorders for the variable without a job corresponds to a high frequency for unemployment in other studies even though the variable without a job was not fully comparable with unemployment (Alonso et al., 2004; Bijl et al., 1998; Hodiamont et al., 1987; Jenkins et al., 1997; Bebbington et al., 2003; Akhtar-Danesh & Landeen, 2007; Kessler et al., 1994). As in other studies, the frequency of mental disorders was decreasing with income (Bijl et al., 1998; Kessler et al., 1994). The most striking finding in this study was that the fre- quency of mental disorders increased with a higher level of education. This is in contradiction with other studies (Alonso et al., 2004; Bijl et al., 1998; Hodiamont et al., 1987; Akhtar- Danesh & Landeen, 2007; Kessler et al., 1994). The explana- tion may be that this study concerns sick-listed individuals. It is possible that individuals of a lower educational level such as lower and secondary Danish primary school as well as unskilled workers and basic skilled workers are not prone to take a leave of absence on account of lower levels of psychological distress because they can keep working in jobs that are not mentally demanding. In comparison, individuals with a higher socio- economic status and of a higher educational level, who often hold mentally demanding jobs, are more promptly faced with challenges when experiencing psychological distress. In comparing other studies and the present study, it must be taken into account that this study comprised incident individu- als on LSA, whereas the population-based studies comprise prevalent individuals whose illness will be of longer duration. Mental disorders are frequently of longer duration, and, conse- quently, they occur with a higher frequency in prevalence stud- ies. In the general population, anxiety is found to be more frequent than depression, 12% versus 9%. However, this study docu- mented that depression was much more frequent than anxiety, 35% versus 15% (Wittchen & Jacobi, 2005). The rather high frequency of depression might be explained by the fact that depression is much more associated with work performance than anxiety (Angst, 1990). The study revealed more intra class variation among partici- pants than non-participants, and the frequency of any mental disorder was 5%-point higher among non-participants than among participants. The interpretation could be that socio- demographic differences are overestimated in studies which are delimited to the participants. Methodological Considerations When compensating for missing data, weighting methods, multiple imputation, or maximum likelihood methods are the most appropriate instruments (Collins et al., 2001; Graham, 2009). In this study, the missing data regarding the verified diagnoses was associated with more variables known for all individuals on LSA. For this reason, the missing data were not missing completely at random (MCAR), but merely missing at random (MAR). However, the missing data were probably also missing not at random (MNAR) which is likely when it was beyond the control of the researcher to verify the diagnoses for certain individuals (Collins et al., 2001; Graham, 2009). Strengths and Limitations The major strength of the study is the fact that it is not af- fected by incomplete coverage since the individuals in the study were identified from public registers as receiving sickness ab- sence benefits. Furthermore, it is a major strength that a sub- group of informants was diagnosed by a psychiatrist applying a standardised diagnostic instrument. Finally, it was a major strength that the variables used in the multiple imputations were gath- ered from public registers, and, consequently, not affected with recall bias. It is a shortcoming, however, that there was a delay of more than eight weeks in carrying out the psychiatric examinations Copyright © 2012 SciRes. 822  H. J. SOEGAARD, P. PEDERSEN related to the specific time when the individuals began their sick-leave. This may have caused an overestimation of the number of mental disorders since mental disorders may have developed from the point in time when the individuals began their sick-leave to the point in time when the psychiatric ex- aminations were carried out. However, the mental disorders which may have developed during the sickness absence period would still be of significance for rehabilitation afte r eight weeks. It is also a shortcoming that no statistics was applied for meth- odological reasons with regard to the differences between par- ticipants and non-participants. However, the 95%-confidence in- tervals of the intervals are overlapping which indicate that the differences were statistically significant. Conclusion The study provided evidence that the burdens imposed by mental disorders on society and the Danish health care system is high as the frequency of mental disorders in LSA was 52%. In addition the study suggests that the burden may be higher than previously expected from studies solely based on partici- pants as when compensating for n on-participation the frequencies of mental disorders were found higher among non-participants than among participants, however not significantly. The impli- cations for future research is to replicate the study in a larger scale by including more urbanised areas together with applying methods which compensate for non-participation (missing val- ues). In addition, studies in which actions are taken to improve the participation rate are warranted. Furthermore, there is a need for identifying variables which are the most optimal in the models compensating for missing values. Authorship Credits The authors’ responsibilities were as follows: HJS and PP: study concept and design; HJS and PP: data acquisition; HJS: statistical analyses; HJS and PP: interpretation of the data; HJS: drafting of the manuscript: HJS and PP: critical review of the manuscript. Acknowledgements We are grateful to Liselotte Petersen, statistician PhD, for her help with data management of register data. REFERENCES Akhtar-Danesh, N., & Landeen, J. (2007). Relation between depression and sociodemographic factors . International Journal of Mental Health Systems, 1, 4. doi:10.1186/1752-4458-1-4 Alonso, J., Angermeyer, M. C., & Bernert, S. (2004). Prevalence of mental disorders in Europe: results from the European Study of the Epidemiology of Mental Disorders (ESEMeD) project. Acta Psychia- trica Scandinavica, 109, 21-27. doi:10.1111/j.1600-0047.2004.00327.x Andlin-Sobocki, P., Jonsson, B., Wittchen, H. U., & Olesen, J. (2005). Cost of disorders of the brain in Europe. European Journal of Neu- rology, 12, 1-27. doi:10.1111/j.1468-1331.2005.01202.x Angst, J. (1990). Depression and anxiety: A review of studies in the community and in primary health care. In: N. Sartorius, D. Goldberg, G. de Girolamo, J. A. Costa e Silva, Y Lecrubier, & H.-U. Wittchen (Eds.), Psychological disorders in general medical settings (pp. 60- 68). Toronto: Hogrefe & Huber. Arbejdsmarkedsstyrelsen, The National Labour Ma rket authority. DRE A M- databasen. The DREAM Databse. U RL (Last checked 16 June 2012). http://www.dst.dk/da/TilSalg/Forskningsservice/Data/~/media/E61C 0C35353141D0A692BF410BF1A3EC.pdf Bebbington, P., Dunn, G., Jenkins, R., Lewis, G., Brugha, T., Farrell, M. et al. (2003). The influence of age and sex on the prevalence of de- pressive conditions: Report from the National Survey of Psychiatric Morbidity. Inter n a t i o n a l Review of Psychiatry, 15, 74-83. doi:10.1080/0954026021000045976 Bijl, R. V., Ravelli, A., & van Zessen, G. (1998). Prevalence of psychi- atric disorder in the general population: Results of The Netherlands Mental Health Survey and Incidence Study (NEMESIS). Social Psy- chiatry and Psychiatric Epide m i o l o gy, 33, 587-595. doi:10.1007/s001270050098 Bijl, R. V., De, G. R., Ravelli, A., Smit, F., & Vollebergh, W. A. (2002). Gender and age-specific first incidence of DSM-III-R psychiatric disorders in the general population. Results from the Netherlands Mental Health Survey and Incidence Study (NEMESIS). Social Psy- chiatry and Psychiatric Epide m i o l o gy, 37, 372-379. doi:10.1007/s00127-002-0566-3 Bisoffi, G., Mazzi, M. A., & Dunn, G. (2000). Evaluating screening questionnaires using Receiver Operating Characteristic (ROC) curves from two-phase (double) samples. International Journal of Methods in Psychiatric Research, 9, 121-133. doi:10.1002/mpr.86 Bjorner, J. B., T hun edborg, K., Kristensen, T. S., Modvig, J., & Bech, P. (1998). The Danish SF-36 Health Survey: Translation and prelimi- nary validity studies. Journal of Clinical Epidemiology, 5 1 , 991-999. doi:10.1016/S0895-4356(98)00091-2 Christensen, K. S., Fink, P., Toft, T., Frostholm, L., Ornbol, E., & Olesen, F. (2005). A brief case-finding questionnaire for common mental disorders: The CMDQ. Family Practice, 22, 448-457. doi:10.1093/fampra/cmi025 Christensen, K. S., Toft, T., Frostholm, L., Ornbol, E., Fink, P., & Olesen, F. (2005). Screening for common mental disorders: Who will benefit? Results from a randomised clinical trial. Family Practice, 22, 428-434. doi:10.1093/fampra/cmi032 Collins, L. M., Schafer, J. L., & Kam, C. M. (2001). A comparison of inclusive and restrictive strategies in modern missing data procedures. Psychological Methods, 6, 330-351. doi:10.1037/1082-989X.6.4.330 Det Centrale Personregister (2012). The Civil Registration System in Denmark. URL (Last checked 16 June 2012). http://www.cpr.dk/cpr/site.aspx?p=198&ArticleTypeID=76&t=Forsi deVisartikel&Articleid=4327 Graham, J. W. (2009). Mi ssing data analysis: Making it work in the real world. Annual Review of Psychology, 60, 549-576. doi:10.1146/annurev.psych.58.110405.085530 Hensing, G., Andersson, L., & Brage, S. (2006). Increase in sickness absence with psychiatric diagnosis in Norway: A general population- based epidemiologic study of age, gender and regional distribution. BMC Medicine, 4, 19. doi:10.1186/1741-7015-4-19 Hodiamont, P., Peer, N., & Syben, N. (1987). Epidemiological aspects of psychiatric disorder in a Dutch health area. Psychological Medi- cine, 17, 495-505. doi:10.1017/S0033291700025058 Jenkins, R., Lewis, G., Bebbington, P., Brugha, T., Farrell, M., Gill, B. et al. (1997). The national psychiatric morbidity surveys of Great Britain—Initial findings from the household survey. Psychological Medicine, 27, 775-789. doi:10.1017/S0033291797005308 Kessler, R. C., McGonagle, K. A., Zhao, S., Nelson, C. B., Hughes, M., Eshleman, S. et al. (1994). Lifetime and 12-month prevalence of DSM-III-R psychiatric disorders in the United States. Results from the National Comorbidity Survey. Archives of General Psychiatry, 51, 8-19. doi:10.1001/archpsyc.1994.03950010008002 Lambets, H., Wood, M., & Hofmanns-Okkes, I. (1993). The interna- tional classification of primary care in the European community. Oxford: Oxford University Press. Lindeman, S., Ha malainen, J., Isometsa, E., Kaprio, J., Poikolainen, K., Heikkinen, M. et al. (2000). The 12-month prevalence and risk fac- tors for major depressive episode in Finland: Representative sample of 5993 adults. Acta Psy chia tric a Sc and inav ica, 102, 178-184. doi:10.1034/j.1600-0447.2000.102003178.x Murray, C. J., & Lopez, A. D. (1997). Global mortality, disability, and the contribution of risk factors: Global burden of disease study. Lan- Copyright © 2012 SciRes. 823  H. J. SOEGAARD, P. PEDERSEN Copyright © 2012 SciRes. 824 cet, 17, 1436-1442 . OECD (2009). Sickness, disability and work: Keeping on track in the economic downturn—background paper. URL (Last checked 16 June 2012). http://www.oecd.org/dataoecd / 42 / 1 5 /42699911.p df Offord, D. R., Boyle, M. H., Campbell, D., Goering, P., Lin, E., Wong, M. et al. (1996). One-year prevalence of psychiatric disorder in On- tarians 15 to 64 years of age. Canadian Journal of Psychiatry, 41, 559-563. Peen, J., Dekker, J., Schoe vers, R. A., Have, M . T., De, G. R., & Beek - man, A. T. (2007). Is the prevalence of psychiatric disorders associ- ated with urbanization? Social Psychiatry and Psychiatric Epidemi- ology, 42, 984-989. doi:10.1007/s00127-007-0256-2 SCAN (1994). Schedules for Clinical Assessment in Neuropsychiatry (Computer Program). Geneva: World Health Organization. Soegaard, H. J., & Bech, P. (2008). Psychiatric disorders in long-term sickness absence—A population based cross sectional study. Scan- dinavian Journal of Pub li c He al th, 37, 682-689. doi:10.1177/1403494809344357 Soegaard, H. J., & Bech, P. (2009). Psychiatric disorders in long-term sickness absence—A population based cross-sectional study. Scan- dinavian Journal of Pub li c He al th, 37, 682-689. doi:10.1177/1403494809344357 STATA 11.0 (2006). 4505 Lakeway Drive College Station, TX 77845, USA. URL (Last checked 16 June 2012). http://www.stata.com/ Statistics Denmark (2011). Statistics Denmark. URL (Last checked 16 June 2012) http://www.dst.dk/en.aspx The National Board of Health, Denmark. URL (Last checked 16 June 2012). http://www.sst.dk/English.aspx The National Board of Health D. Laegemiddeldatabasen. The medica- tion database. URL (Last checked 16 June 2012). http://laegemiddelstyrelsen.dk/da/topics/statistik,-priser-og-tilskud/st atistik-og-analyser/om-laegemiddel-statistikregisteret UCLA Academic Technology Services. Stata Library Multiple Imputa- tion Using ICE. URL (Last checked 16 June 2012). http://www.ats.ucla.edu/stat/stata/library/ice.htm Ware, J. E., & Kosinski, M. (2001). Physical and mental health sum- mary scales: A manual for users of Version 1 (2nd ed.). Lincoln, RI: Quality Metric, Inc. Wittchen, H. U., & Jacobi, F. (2005). Size and burden of mental disor- ders in Europe—A critical review and appraisal of 27 studies. Euro- pean Neuropsychopharmacology, 15 , 357-376. doi:10.1016/j.euroneuro.2005.04.012 WHO Collaborating Centre for Drug Statistics Methodology. ATC/ DDD Index 2011. URL (L ast checked 16 June 2012). http://www.whocc.no/atc_ddd_index/ World Health Organisation (2006). International Statistical Classifica- tion of Diseases and Related Health Problems. 10th Revision. Gen- eve: World Health Organisation. |