

Paper Menu >>
Journal Menu >>
 Journal of Minerals and Materials Characterization and Engineering, 2012, 11, 891-895 Published Online September 2012 (http://www.SciRP.org/journal/jmmce) Correlation between Process Variables in Shielded Metal-Arc Welding (SMAW) Process and Post Weld Heat Treatment (PWHT) on Some Mechanical Properties of Low Carbon Steel Welds J. O. Olawale*, S. A. Ibitoye, K. M. Oluwasegun, M. D. Shittu, R. C. Ofoezie Department of Materials Science and Engineering, Obafemi Awolowo University, Ile-Ife, Nigeria Email: *[email protected] Received May 4, 2012; revised June 10, 2012; accepted June 29, 2012 ABSTRACT This investigation was conducted to correlate process variables in shielded metal-arc welding (SMAW) and post weld heat treatment on some mechanical properties of low carbon steel weld. Three hundred and sixty pieces of weld samples were prepared. The samples were welded together using AWS E6013 electrodes with DC arc welding process. Varying welding curr ents of 100 A, 120 A, 140 A were used with a ter minal voltage of 80 V. Th e weld samples were prepared for hardness, tensile and impact test. The prepared samples were then subjected to normalising heat treatment operation at temperatures of 590˚C, 600˚C, 620˚C, 640˚C, 660˚C, 680˚C, and 700˚C. It was observed that increase in welding current led to an in crease in hardness and ultimate tensile strength values of as-weld samples while impact strength de- creases. After post heat treatment operation the hardness and ultimate tensile strengths decreases while i mpact strength increases. From this outcome we conclude that there is correlation between the welding current and mechanical proper- ties of weld metal on one hand and normalising temperatures and mechanical properties on the other hand. As the cur- rent increases the hardness and strength increases but impact strength reduces, while hardness and strength continuou sly reduces but impact strength increases as normalising temperatures increases. Keywords: Post-Welding; Normalising; Current; Steel; Hardness; Strength 1. Introduction Welding is one of the most important technological proc- esses used across numerous branches of industry such as industrial engineering, shipbuilding, pipeline fabrication to name but a few. The welding process generally involves melting and subsequent cooling, and the result of this thermal cycle is distortion if the welded item is free to move or residual stress if the item is securely held [1]. There comes a point when the amount of residual stress can create po- tential problems, either immediately or during the life of the welded structure, and it needs to be reduced or re- moved. Post weld heat treatment is the most widely used form of stress relieving on completion of fabrication of welded structures. High level residual stresses can occur in weldment due to restraint by the parent metal during weld solidification [2]. The stresses may be as high as the yield strength of material itself. When combined with normal load stresses these may exceed the design stresses. These stresses can be relief by post-weld heat treatment. In concept, post- weld heat treatment can encompass many different po- tential treatments; however, in steel fabrication, the two most common procedures used are post heating and stress relieving [3]. The heat treatment consists of the stressrelief, annealing or solution annealing depending upon the requirements. For instance annealing and tem- pering have been found to have significantly improve the mechanical properties of welded steel [4,5]. Also, to consistently produce high quality of welds, arc welding requires experienced welding personnel. One reason for this is the need to properly select welding pa- rameters for a given task to provide a good weld quality which identified by its micro-structure and the amount of spatter, and relied on the correct bead geometry size. Therefore, the use of the control system in arc welding can eliminate much of the “guess work” often employed by welders to specify welding parameters for a given task [6]. Investigation into the relationship between the weld- ing process parameters and bead geometry began in the *Corresponding author. Copyright © 2012 SciRes. JMMCE 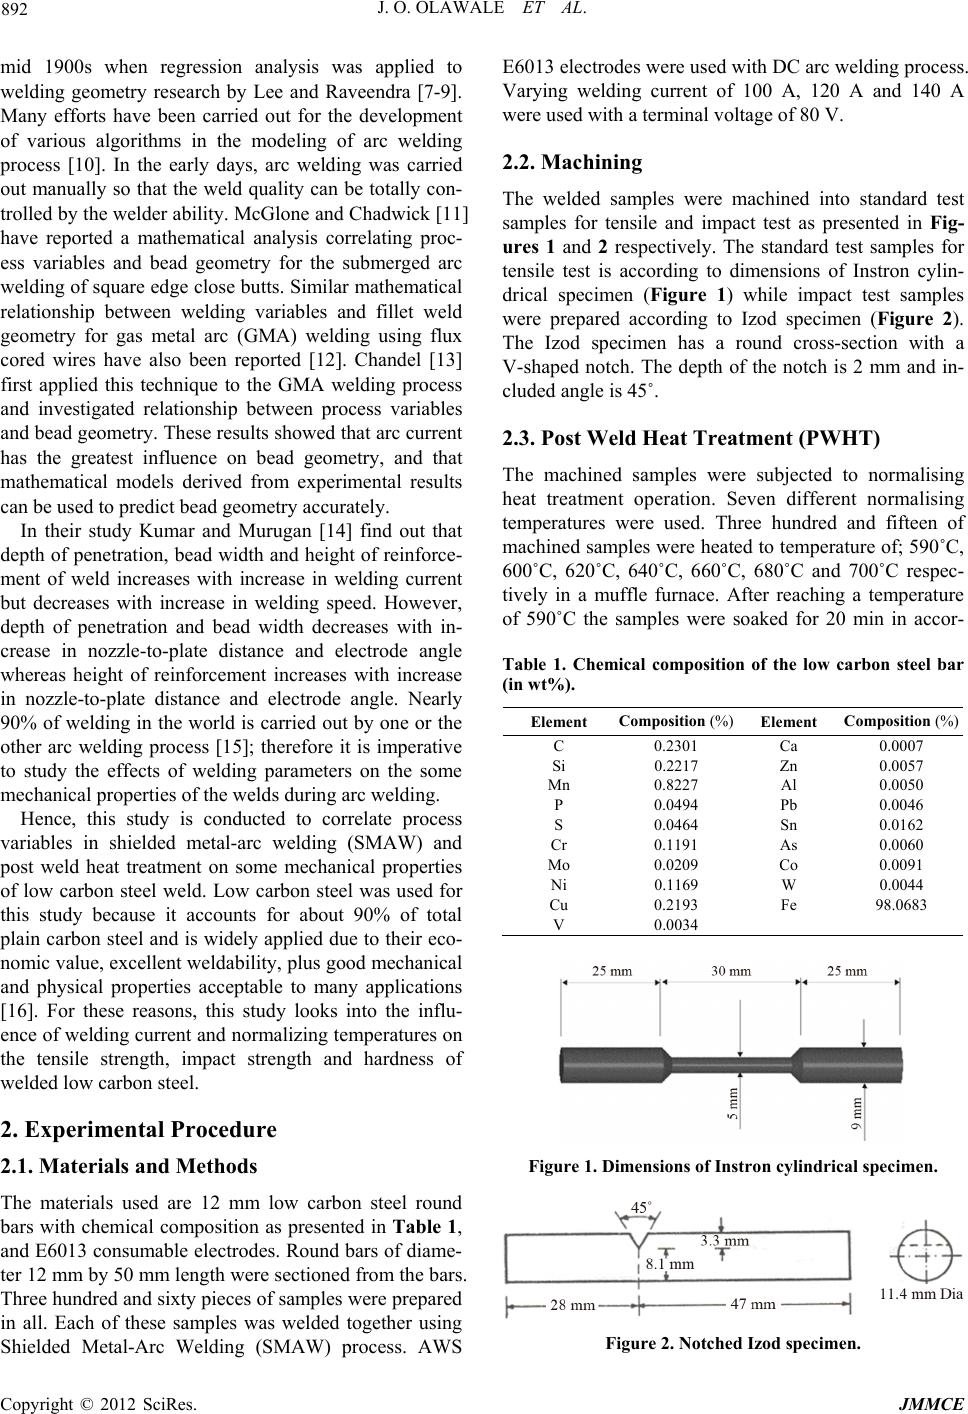 J. O. OLAWALE ET AL. 892 mid 1900s when regression analysis was applied to welding geometry research by Lee and Raveendra [7-9]. Many efforts have been carried out for the development of various algorithms in the modeling of arc welding process [10]. In the early days, arc welding was carried out manually so that the weld quality can be totally con- trolled by the welder ability. McGlone and Chadwick [11 ] have reported a mathematical analysis correlating proc- ess variables and bead geometry for the submerged arc welding of square edge close butts. Similar mathematical relationship between welding variables and fillet weld geometry for gas metal arc (GMA) welding using flux cored wires have also been reported [12]. Chandel [13] first applied this technique to the GMA welding process and investigated relationship between process variables and bead geometry. These results showed that arc current has the greatest influence on bead geometry, and that mathematical models derived from experimental results can be used to predict bead geometry accurately. In their study Kumar and Murugan [14] find out that depth of penetration, bead width and height of reinforce- ment of weld increases with increase in welding current but decreases with increase in welding speed. However, depth of penetration and bead width decreases with in- crease in nozzle-to-plate distance and electrode angle whereas height of reinforcement increases with increase in nozzle-to-plate distance and electrode angle. Nearly 90% of welding in the world is carried out by one or the other arc welding process [15]; therefore it is imperative to study the effects of welding parameters on the some mechanical properties of the welds during arc welding. Hence, this study is conducted to correlate process variables in shielded metal-arc welding (SMAW) and post weld heat treatment on some mechanical properties of low carbon steel weld. Low carbon steel was used for this study because it accounts for about 90% of total plain carbon steel and is widely applied due to their eco- nomic value, excellent weld ability, plus good mechanical and physical properties acceptable to many applications [16]. For these reasons, this study looks into the influ- ence of welding current and normalizing temperatures on the tensile strength, impact strength and hardness of welded low carbon steel. 2. Experimental Procedure 2.1. Materials and Methods The materials used are 12 mm low carbon steel round bars with chemical composition as presented in Table 1, and E6013 consumable electrodes. Round bars of diame- ter 12 mm by 50 mm length were sectioned from the bars. Three hundred and six ty pieces of samples were pr epar ed in all. Each of these samples was welded together using Shielded Metal-Arc Welding (SMAW) process. AWS E6013 electrodes were used with DC arc welding process. Varying welding current of 100 A, 120 A and 140 A were used with a terminal voltage of 80 V. 2.2. Machining The welded samples were machined into standard test samples for tensile and impact test as presented in Fig- ures 1 and 2 respectively. The standard test samples for tensile test is according to dimensions of Instron cylin- drical specimen (Figure 1) while impact test samples were prepared according to Izod specimen (Figure 2). The Izod specimen has a round cross-section with a V-shaped notch. The depth of the notch is 2 mm and in- cluded angle is 45˚. 2.3. Post Weld Heat Treatment (PWHT) The machined samples were subjected to normalising heat treatment operation. Seven different normalising temperatures were used. Three hundred and fifteen of machined samples were heated to temperature of; 590˚C, 600˚C, 620˚C, 640˚C, 660˚C, 680˚C and 700˚C respec- tively in a muffle furnace. After reaching a temperature of 590˚C the samples were soaked for 20 min in accor- Table 1. Chemical composition of the low carbon steel bar (in wt%). Element Composition (%) Element Composition (%) C 0.2301 Ca 0.0007 Si 0.2217 Zn 0.0057 Mn 0.8227 Al 0.0050 P 0.0494 Pb 0.0046 S 0.0464 Sn 0.0162 Cr 0.1191 As 0.0060 Mo 0.0209 Co 0.0091 Ni 0.1169 W 0.0044 Cu 0.2193 Fe 98.0683 V 0.0034 Figure 1. Dimensions of Instron cylindrical specimen. Figure 2. Notched Izod spec i men. Copyright © 2012 SciRes. JMMCE 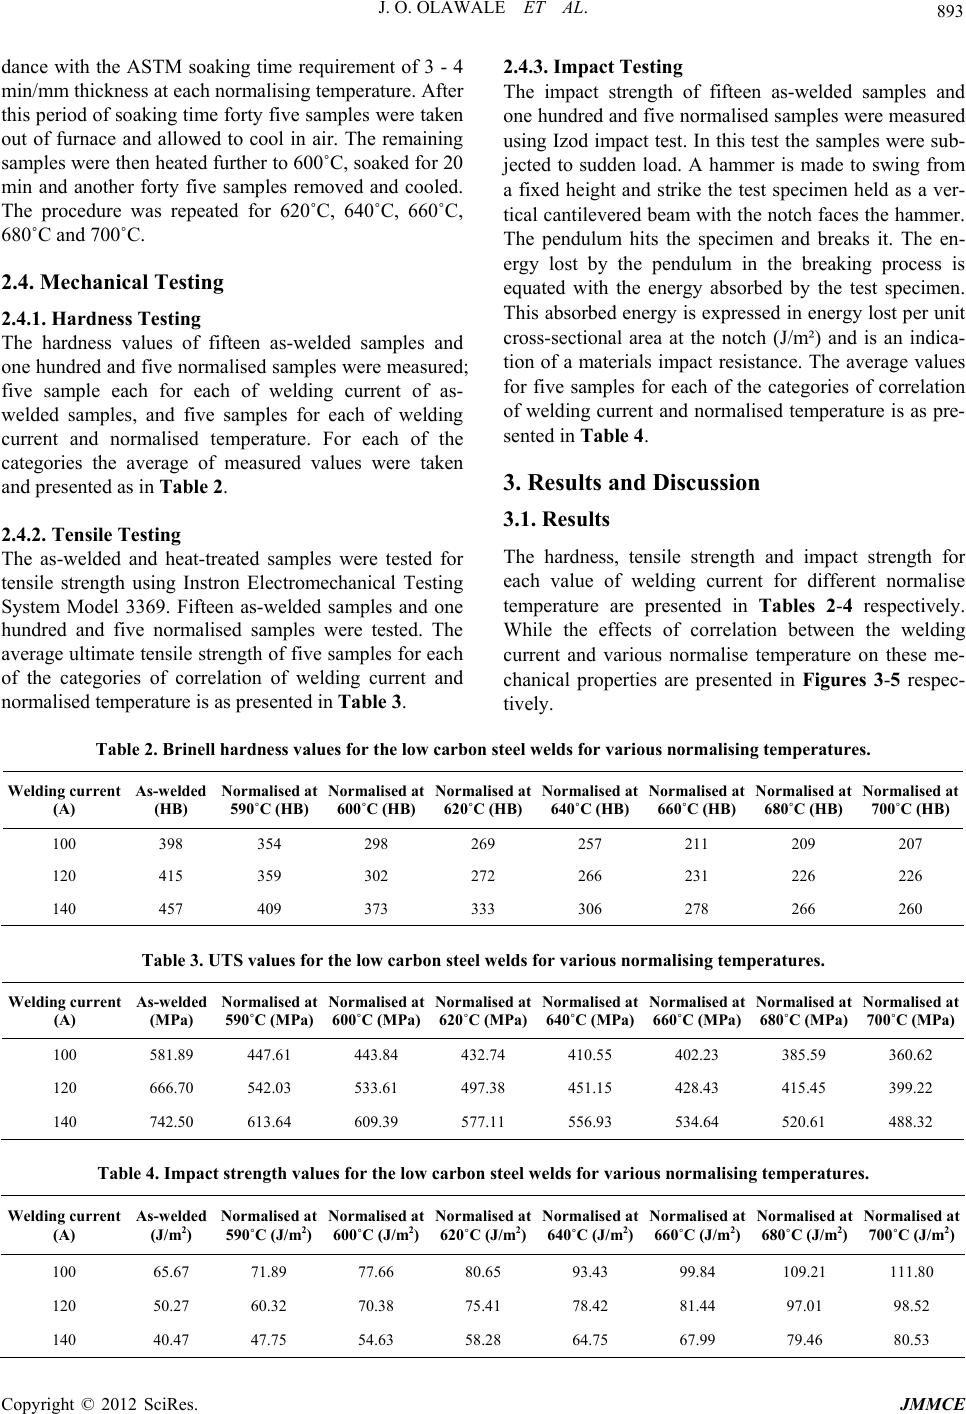 J. O. OLAWALE ET AL. Copyright © 2012 SciRes. JMMCE 893 dance with the ASTM soaking time requirement of 3 - 4 min/mm thickness at each normalising temperature. After this period of soaking time forty five samples were taken out of furnace and allowed to cool in air. The remaining samples were then heated further to 600˚C, soaked for 20 min and another forty five samples removed and cooled. The procedure was repeated for 620˚C, 640˚C, 660˚C, 680˚C and 700˚C. 2.4. Mechanical Testing 2.4.1. Hardness Testi ng The hardness values of fifteen as-welded samples and one hundred and five normalised samples were measured; five sample each for each of welding current of as- welded samples, and five samples for each of welding current and normalised temperature. For each of the categories the average of measured values were taken and presented as in Table 2. 2.4.2. Tensile Testing The as-welded and heat-treated samples were tested for tensile strength using Instron Electromechanical Testing System Model 3369. Fifteen as-welded samples and one hundred and five normalised samples were tested. The average ultimate tensile strength of five samples for each of the categories of correlation of welding current and normalised temperature is as presented in Table 3. 2.4.3. Impact Testing The impact strength of fifteen as-welded samples and one hundred and five normalised samples were measured using Izod impact test. In this test the samples were sub- jected to sudden load. A hammer is made to swing from a fixed height and strike the test specimen held as a ver- tical cantilevered beam with the notch faces the hammer. The pendulum hits the specimen and breaks it. The en- ergy lost by the pendulum in the breaking process is equated with the energy absorbed by the test specimen. This absorbed energy is expressed in energy lost per unit cross-sectional area at the notch (J/m²) and is an indica- tion of a materials impact resistance. The average values for five samples for each of the categories of correlation of welding current and normalised temperature is as pre- sented in Table 4. 3. Results and Discussion 3.1. Results The hardness, tensile strength and impact strength for each value of welding current for different normalise temperature are presented in Tables 2-4 respectively. While the effects of correlation between the welding current and various normalise temperature on these me- chanical properties are presented in Figures 3-5 respec- tively. Table 2. Brinell hardness values for the low carbon steel welds for various normalising temperatures. Welding current (A) As-welded (HB) Normalised at 590˚C (HB) Normalised at 600˚C (HB)Normalised at 620˚C (HB)Normalised at 640˚C (HB)Normalised at 660˚C (HB) Normalised at 680˚C (HB) Normalised at 700˚C (HB) 100 398 354 298 269 257 211 209 207 120 415 359 302 272 266 231 226 226 140 457 409 373 333 306 278 266 260 Table 3. UTS values for the low carbon steel welds for various normalising temperatures. Welding current (A) As-welded (MPa) Normalised at 590˚C (MPa) Normalised at 600˚C (MPa)Normalised at 620˚C (MPa)Normalised at 640˚C (MPa)Normalised at 660˚C (MPa) Normalised at 680˚C (MPa) Normalised at 700˚C (MPa) 100 581.89 447.61 443.84 432.74 410.55 402.23 385.59 360.62 120 666.70 542.03 533.61 497.38 451.15 428.43 415.45 399.22 140 742.50 613.64 609.39 577.11 556.93 534.64 520.61 488.32 Table 4. Impact strength values for the low carbon steel welds for various normalising temperatures. Welding current (A) As-welded (J/m2) Normalised at 590˚C (J/m2) Normalised at 600˚C (J/m2)Normalised at 620˚C (J/m2)Normalised at 640˚C (J/m2)Normalised at 660˚C (J/m2) Normalised at 680˚C (J/m2) Normalised at 700˚C (J/m2) 100 65.67 71.89 77.66 80.65 93.43 99.84 109.21 111.80 120 50.27 60.32 70.38 75.41 78.42 81.44 97.01 98.52 140 40.47 47.75 54.63 58.28 64.75 67.99 79.46 80.53 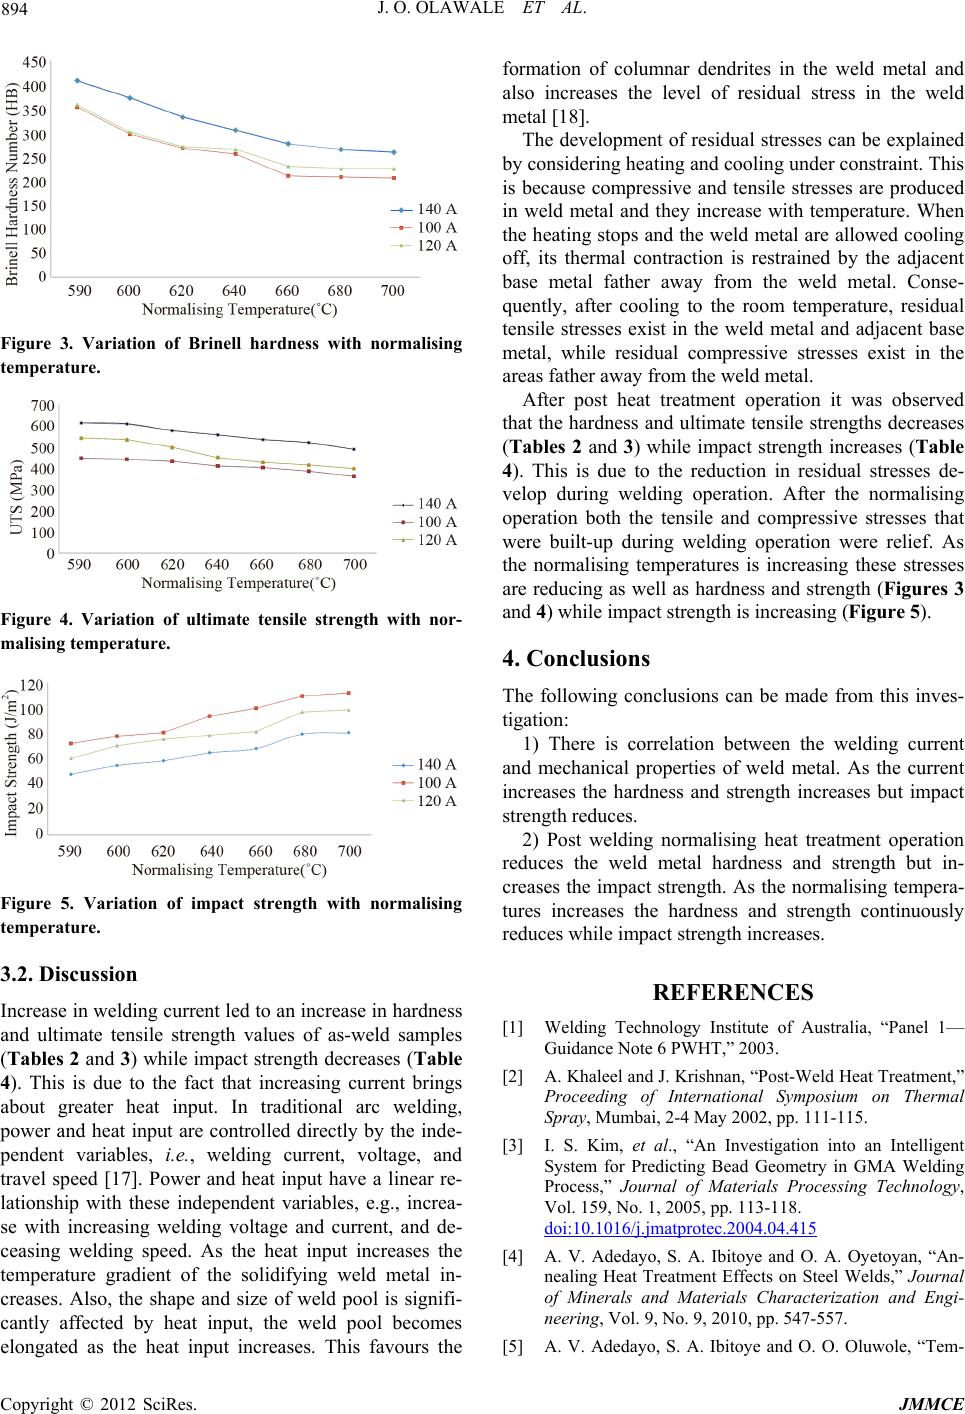 J. O. OLAWALE ET AL. 894 Figure 3. Variation of Brinell hardness with normalising temperature. Figure 4. Variation of ultimate tensile strength with nor- malising temperature. Figure 5. Variation of impact strength with normalising temperature. 3.2. Discussion Increase in welding current led to an increase in hardness and ultimate tensile strength values of as-weld samples (Tables 2 and 3) while impact strength decreases (Table 4). This is due to the fact that increasing current brings about greater heat input. In traditional arc welding, power and heat input are controlled directly by the inde- pendent variables, i.e., welding current, voltage, and travel speed [17]. Power and heat input have a linear re- lationship with these independent variables, e.g., increa- se with increasing welding voltage and current, and de- ceasing welding speed. As the heat input increases the temperature gradient of the solidifying weld metal in- creases. Also, the shape and size of weld pool is signifi- cantly affected by heat input, the weld pool becomes elongated as the heat input increases. This favours the formation of columnar dendrites in the weld metal and also increases the level of residual stress in the weld metal [18]. The development of residual stresses can be explained by considering heating and cooling under constraint. This is because compressive and tensile stresses are produced in weld metal and they increase with temperature. When the heating stops and the weld metal are allowed cooling off, its thermal contraction is restrained by the adjacent base metal father away from the weld metal. Conse- quently, after cooling to the room temperature, residual tensile stresses exist in the weld metal and adjacent base metal, while residual compressive stresses exist in the areas father away from the weld metal. After post heat treatment operation it was observed that the hardness and ultimate tensile streng ths decreases (Tables 2 and 3) while impact strength increases (Table 4). This is due to the reduction in residual stresses de- velop during welding operation. After the normalising operation both the tensile and compressive stresses that were built-up during welding operation were relief. As the normalising temperatures is increasing these stresses are reducing as well as hardness and strength (Figures 3 and 4) while impact strength is increasing (Figure 5). 4. Conclusions The following conclusions can be made from this inves- tigation: 1) There is correlation between the welding current and mechanical properties of weld metal. As the current increases the hardness and strength increases but impact strength reduces. 2) Post welding normalising heat treatment operation reduces the weld metal hardness and strength but in- creases the impact strength. As the normalising tempera- tures increases the hardness and strength continuously reduces while impact strength increases. REFERENCES [1] Welding Technology Institute of Australia, “Panel 1— Guidance Note 6 PWHT,” 2003. [2] A. Khaleel and J. Krishnan, “Post-Weld Heat Treatment,” Proceeding of International Symposium on Thermal Spray, Mumbai, 2-4 May 2002, pp. 111-115. [3] I. S. Kim, et al., “An Investigation into an Intelligent System for Predicting Bead Geometry in GMA Welding Process,” Journal of Materials Processing Technology, Vol. 159, No. 1, 2005, pp. 113-118. doi:10.1016/j.jmatprotec.2004.04.415 [4] A. V. Adedayo, S. A. Ibitoye and O. A. Oyetoyan, “An- nealing Heat Treatment Effects on Steel Welds,” Journal of Minerals and Materials Characterization and Engi- neering, Vol. 9, No. 9, 2010, pp. 547-557. [5] A. V. Adedayo, S. A. Ibitoye and O. O. Oluwole, “Tem- Copyright © 2012 SciRes. JMMCE  J. O. OLAWALE ET AL. 895 pering Heat Treatment Effects on Steel Welds,” Journal of Minerals and Materials Characterization and Engi- neering, Vol. 10, No. 8, 2011, pp. 755-764. [6] R. S. Funderburk, “Key Concepts in Welding Engineer- ing,” Welding Innovation, Vol. 15, No. 2, 1998, 2 p. [7] J. Raveendra and R. S. Parmar, “Mathematical Models to Predict Weld Bead Geometry for Flux Cored Arc Weld- ing,” Metal Construct, Vol. 19, No. 1, 1987, pp. 31R- 35R. [8] J. I. Lee and K. W. Um, “A Prediction of Welding Proc- ess Parameters by Prediction of Back-Bead Geometry,” Journal of Materials Processing Technology, Vol. 108, No. 1, 2000, pp. 106-113. doi:10.1016/S0924-0136(00)00736-6 [9] K. S. Prasad, C. S. Rao a nd D. N. Rao, “The Prediction of Weld Bead Geometry in Plasma Arc Welding Using Fac- torial Design Approach,” Journal of Minerals and Mate- rials Characterization and Engineering, Vol. 10, No. 10, 2011, pp. 875-886. [10] P. J. Modenesi and R. C. Avelar, “The Influence of Smal l Variations of Wire Characteristics on Gas Metal Arc Welding Process Stability,” Journal of Materials Proc- essing Technology, Vol. 86, No. 1-3, 1999, pp. 226-232. [11] J. C. McGlone and D. B. Chadwick, “The Submerged Arc Butt Welding of Mild Steel (Part 2): The Prediction of Weld Bead Geometry from the Procedure Parameters,” Welding Institute Report 80/1978/PE, 1978. [12] J. Doherty, et al., “The Relationships between Arc Weld- ing Parameters and Fillet Weld Geometry for MIG Welding with Flux Cored Wires,” Welding Institute Re- port 82/1978/PE, 1978. [13] R. S. Chandel, “Mathematical Modeling of Gas Metal Arc Weld Features,” Proceedings of the 4th International Conference on Modeling of Casting and Welding Proc- esses, Palm Coast, 17-22 April 1988, pp. 109-120. [14] V. V. Kumar and N. Murugan, “Effect of FCAW Process Parameters on Weld Bead Geometry in Stainless Steel Cladding,” Journal of Minerals and Materials Charac- terization and Engineering, Vol. 10, No. 9, 2011, pp. 827-824. [15] S. P. Tewari, A. Gupta and J. Prakash, “Effect of Welding Parameters on the Weldability of Material,” International Journal of Engineering Science and Technology, Vol. 2, No. 4, 2010, pp. 512-516. [16] T. V. Raja, C. P. Sharma and A. Sharman, “Heat Treat- ment Principles and Techniques,” Prentice-Hall of India Private Li mi ted, New Delhi, 1999, p. 243. [17] V. Gunaraj and N. Murugan, “Prediction and Comparison of the Area of the Heat Affected Zone for the Bead-on- Plate and Bead-on-Joint in Submerged Arc Welding of Pipes,” Journal of Materials Processing Technology, Vol. 95, No. 1-3, 1999, pp. 246-261. doi:10.1016/S0924-0136(99)00296-4 [18] K. Sindo, “Welding Metallurgy,” 2nd Edition, John Wiley & Sons, New York, 2003, pp. 199-206. Copyright © 2012 SciRes. JMMCE |