

Paper Menu >>
Journal Menu >>
 Psychology 2012. Vol.3, No.9, 722-728 Published Online September 2012 in SciRes (http://www.SciRP.org/journal/psych) http://dx.doi.org/10.4236/psych.2012.39109 Copyright © 2012 SciRes. 722 Development of Word-of-Mouth Elasticity Measures for Tourism Product Categories Yimiao Chen1, Fangyi Liu2*, Li-Ming Ho2, Tom M. Y. Lin1 1Department of Business Administration, National Taiwan University of Science and Technology, Taipei, Chinese Taipei 2Department of Marine Leisure Management, National Kaohsiung Marine University, Kaohsiung, Chinese Taipei Email: *[email protected] Received June 21st, 2012; revised July 24th, 2012; accepted August 28th, 2012 This study examines the influence of word of mouth (WOM) on eight tourism products by applying eco- nomic elasticity theory to understand the relationship between behavioral outcomes and target elements to these behavioral outcomes (customer consumption). The elasticity model of economics was developed to conceptualize WOM elasticity () and measure WOM effects on various products. The results of WOM elasticity values show a significant difference between physical and service product categories. In addition, all effective respondents in this research are highly sensitive to WOM relating to specific prod- ucts. This shows that WOM is not only a key variable of tourism products but also validates that WOM communications are meaningful for tourism customers. The authors contributes to tourism service and WOM marketing effects compared by validating empirical research in eight different product categories and providing empirical support with prior services marketing literature. Theoretical and practical impli- cations and future research issues are discussed. x WOM E Keywords: Tourism Product Categories; Word-of-Mouth; Elasticity Logic; Purchase Drivers Introduction Word-of-mouth (WOM) is an important issue in marketing. Numerous studies have demonstrated that WOM is an effective marketing tool, for example, Lan et al. (2012) shows people like to talk and spread information in their familiar group, whether products are sold at street vendors, night markets, ge- neral shops or internet auction sites, most of customers receive in-formation from their very close acquaintances. Villanueva et al. (2008) concluded that the lifetime value of customers ac- quired through WOM is twice as great as that acquired through traditional marketing tools and Trusov et al. (2009) pointed out that WOM in website member acquisition is 30 times higher than media appearances. Furthermore, we understand WOM can help purchase decision making (Harrison-Walker, 2001; Crane & Lynch, 1988), especially in innovative products (Dod- son & Muller, 1978; Arndt, 1967); durable goods (Mahajan et al., 1990; Kiel & Layton, 1981), and professional services (File et al., 1994; Murray, 1991); thus, the WOM effects are vary across products, markets (Ennew et al., 2000), and even brands. The potential impact of WOM and its value to an organization is thus considerable, although the dominant explanation focuses on the role of WOM as a risk-reliever or as a risk reduction strategy (Fang et al, 2011; Forsythe, 2003; Derbaix, 1983), the comparison for WOM influence on different products may be more difficult to identify. Therefore, this study will directly combines economic elasticity theory and WOM research to explore a comprehensive principle for not only quantifying WOM effects but also mirroring the primary cause in various WOM phenomena, with a one-size-fits-all standard of WOM quantification in market research can better use this effective marketing tool. Price elasticity theory originates from economics, where the sales of good X responds to a 1% change in price; that is, xxxxx (E is the price elasticity, P represents product price and Q is the quantity of product sale). A number of WOM studies have demonstrated that the sales of goods respond to changes in WOM (Bansal & Voyer, 2000; Goges & Mayzlin, 2004). Thus, WOM elasticity follows the same logic to quantify the relation between WOM and the sales of goods, that is, the extent of WOM effects. EQPPQ For the purpose of examining the usage of WOM elasticity, the authors found the power of word-of-mouth (recommenda- tion by friends and family) is the most credible for leisure tra- velers (Murphy et al., 2007; Alvarez & Asugman, 2006). For tourists, this recommendation of a product/service from a friend or family member is the most powerful information source available. It is also the least expensive. In the same time, lot of literatures emphasis the influence of travel blogs as a commu- nications tool to travel information (as an electronic word-of- mouth) about travel experience (Pan et al., 2007; Schmallegger & Carson, 2008). And the continuing rise of the internet as a WOM communications tool for travel and tourism presents challenges for tourism enterprises. After leisure travelers obtain travel information either online or offline, many still need the validation of a travel professional, especially for more complex travel. It is essential for travel marketers to realize the sale is not consummated at time of booking or final deposit. Rather, it is after the customer consumes the travel experience of others. So, how to understand the real effect of the travel experience WOM? Thus, the authors choose 8 product categories of tour- *Corresponding author.  Y. M. CHEN ET AL. ism industry to calculate the WOM elasticity values and com- pare the WOM effects on these product categories, and hope the results can generalized to other industries. This study is organized as follows. The authors first devise a WOM sales function to integrate two major variables: tourism product sales and its WOM. Second, the authors use question- naires to collect product purchasing information from experi- enced consumers. Third, the authors investigate two types (physical vs service) of products mentioned in the literature. Finally, the authors calculate the WOM elasticity value of the 8 product categories. Finally, the authors present the results and discuss the limitations and implications of how WOM and its effects impact each product category. Measuring Word-of-Mouth Influences Elasticity The ory for Qu ant i fi cati o n and Comparison To understand the concept of WOM elasticity as applied to WOM marketing research; it is useful to briefly review previ- ous marketing research within the elasticity framework. For example, Assmus et al. (1984) examined the elasticity frame- work and noted the absolute value of price elasticity is eight times that of advertising elasticity. Olivera-Castro (2008) ap- plied price elasticity theory to brand selection; and Trusov et al. (2009) used the elasticity indicator to estimate that WOM is 20 times as effective as marketing events and 30 times as effective as media appearances. In general, these studies followed the elasticity theory to describe variables and compare their effect- tiveness, and used the concept to integrate research themes and the variables of demand, sale, market share, and so forth, to discuss marketing effects. Moreover, some researchers add a time variable to understand elasticity trends in determining marketing strategies. Overall, academics support elasticity as a very useful concept that can be applied to the study of WOM. WOM Elasticity Logic WOM behavior means the number of people told about a product experience (Halstead & Droge, 1991). Many WOM studies have found that a considerable proportion of consumers seek product WOM from the Internet or friends before buying goods (Bloch et al., 1986; Katona & Mueller, 1954). Many of these studies have determined that positive WOM can increase the probability of product purchase (Ardnt, 1967; Katz & Lazarfeld, 1955), and negative WOM can negatively influence purchasing decisions (Homburg et al., 2005; Mittal et al., 1998). That’s means the product sales as a function of WOM as fol- lowing: xx xxx SalesQf WOM , other factorfWOM where Qx is the sales of product X, x is the WOM of product X, and other factorx is other variables (assumed to be fixed here) that can affect the product sales, WOM According to the WOM sales function above, the definition of the WOM elasticity of product X is as follow: x xxx x WOM xx xx QQQ WOM EWOM WOMWOMQ where Qx is the sales of product X, is the WOM of pro- duct X, x WOM xx shows how QX changes as x changes, and this expression for shows how the sales of X responds to a 1% change in X’s WOM. Research Hypotheses As above, WOM elasticity value (WOM ) can directly meas- ure and compare WOM effects, shows that the differences in WOM effects are then related to differences in WOM elasticity. Accordingly, WOM becomes an intermediate indicator inte- grating all influenced factors except WOM to WOM sale func- tion so that can help us better understand WOM effects (see Figure 1). Thus, the first hypothesis in this study is concerned with the WOM elasticity value in tourism industry, this ex- pected a positive value will be observed for all categories we will investigate. And second hypothesis is subjected to empiri- cal examination of difference of WOM elasticity value between the service and physical products; in here the authors expected a larger value for service than physical products in this paper. E E Methodology To Get the WOM Elasticity Values The economic theory logic is used to calculate the WOM elasticity value; thus, we must assume the other conditions are unchanged and the system is a closed economy (without foreign purchases). Therefore, the consumption equal product sale, the relation between a product’s variables of consumption (C) and WOM is Equation (1). Mathematical Notations QCfWOM (1) WOM ΔQQ ΔCC EΔWOM WOMΔWOM WOM (2) βε CAWOMe (3) lnClnA βln WOMε (4) WOM dlnC βE dlnWOM 1 (5) i1i1 i1 i2i2 i2 i ipip ip inin in lnClnWOM ε lnClnWOM ε MM αβ lnClnWOM ε MM lnClnWOM ε M M (6) where Q is the product sales; C is the consumption of goods, an independent variable in this study’s framework; and WOM is the product WOM, a dependent variable. Given Equation (1), 1Setting ln A = , a constant, we differentiate Equation (4) by WOM as α follows: dlnC dαdlnWOM dε β dWOM dWOMdWOMdWOM 1dC 1 Þ0β0 CdWOM WOM where WOM 1CdC dWOMdC C βE 1 WOMdWOMWOM ΔQΔWOM WOM x WOM E Copyright © 2012 SciRes. 723 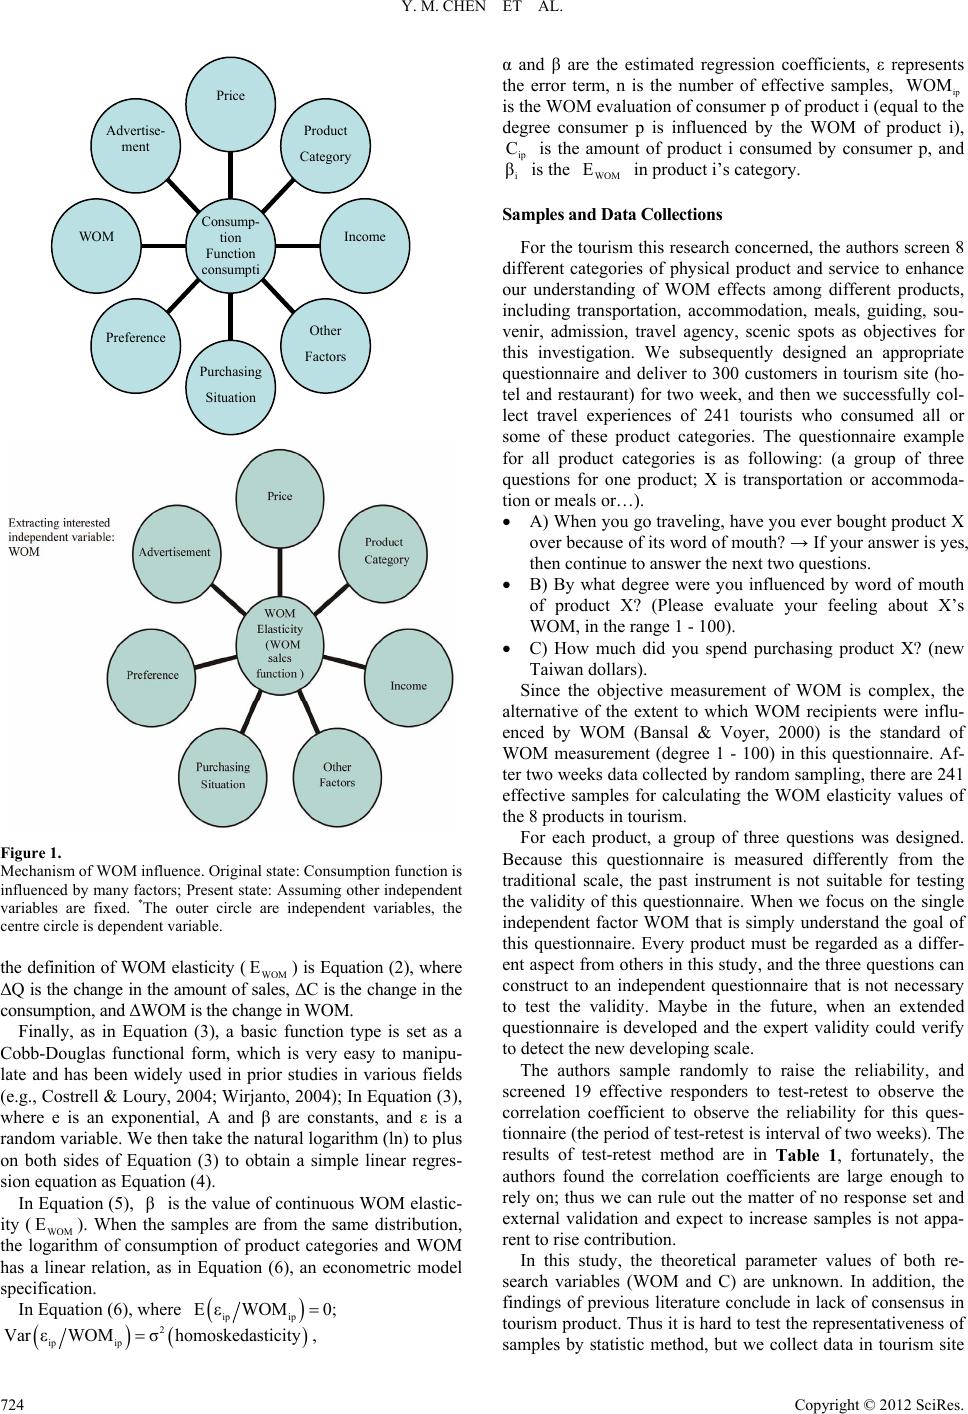 Y. M. CHEN ET AL. Price Product Category Income Other Factors Purchasing Situation Preference WOM Advertise- ment Consump- tion Function consumpti Figure 1. Mechanism of WOM influence. Original state: Consumption function is influenced by many factors; Present state: Assuming other independent variables are fixed. *The outer circle are independent variables, the centre circle is dependent variable. the definition of WOM elasticity (WOM ) is Equation (2), where ΔQ is the change in the amount of sales, ΔC is the change in the consumption, and ΔWOM is the change in WOM. E Finally, as in Equation (3), a basic function type is set as a Cobb-Douglas functional form, which is very easy to manipu- late and has been widely used in prior studies in various fields (e.g., Costrell & Loury, 2004; Wirjanto, 2004); In Equation (3), where e is an exponential, A and β are constants, and ε is a random variable. We then take the natural logarithm (ln) to plus on both sides of Equation (3) to obtain a simple linear regres- sion equation as Equation (4). In Equation (5), is the value of continuous WOM elastic- ity (WOM ). When the samples are from the same distribution, the logarithm of consumption of product categories and WOM has a linear relation, as in Equation (6), an econometric model specification. β E In Equation (6), where ip ip EεWOM 0; 2 ip ip Var εWOM σhomoskedasticity, α and β are the estimated regression coefficients, ε represents the error term, n is the number of effective samples, ip is the WOM evaluation of consumer p of product i (equal to the degree consumer p is influenced by the WOM of product i), ip is the amount of product i consumed by consumer p, and is the in product i’s category. WOM C i βWOM E Samples and Data Collections For the tourism this research concerned, the authors screen 8 different categories of physical product and service to enhance our understanding of WOM effects among different products, including transportation, accommodation, meals, guiding, sou- venir, admission, travel agency, scenic spots as objectives for this investigation. We subsequently designed an appropriate questionnaire and deliver to 300 customers in tourism site (ho- tel and restaurant) for two week, and then we successfully col- lect travel experiences of 241 tourists who consumed all or some of these product categories. The questionnaire example for all product categories is as following: (a group of three questions for one product; X is transportation or accommoda- tion or meals or…). A) When you go traveling, have you ever bought product X over because of its word of mouth? → If your answer is yes, then continue to answer the next two questions. B) By what degree were you influenced by word of mouth of product X? (Please evaluate your feeling about X’s WOM, in the range 1 - 100). C) How much did you spend purchasing product X? (new Taiwan dollars). Since the objective measurement of WOM is complex, the alternative of the extent to which WOM recipients were influ- enced by WOM (Bansal & Voyer, 2000) is the standard of WOM measurement (degree 1 - 100) in this questionnaire. Af- ter two weeks data collected by random sampling, there are 241 effective samples for calculating the WOM elasticity values of the 8 products in tourism. For each product, a group of three questions was designed. Because this questionnaire is measured differently from the traditional scale, the past instrument is not suitable for testing the validity of this questionnaire. When we focus on the single independent factor WOM that is simply understand the goal of this questionnaire. Every product must be regarded as a differ- ent aspect from others in this study, and the three questions can construct to an independent questionnaire that is not necessary to test the validity. Maybe in the future, when an extended questionnaire is developed and the expert validity could verify to detect the new developing scale. The authors sample randomly to raise the reliability, and screened 19 effective responders to test-retest to observe the correlation coefficient to observe the reliability for this ques- tionnaire (the period of test-retest is interval of two weeks). The results of test-retest method are in Table 1, fortunately, the authors found the correlation coefficients are large enough to rely on; thus we can rule out the matter of no response set and external validation and expect to increase samples is not appa- rent to rise contribution. In this study, the theoretical parameter values of both re- search variables (WOM and C) are unknown. In addition, the findings of previous literature conclude in lack of consensus in tourism product. Thus it is hard to test the representativeness of samples by statistic method, but we collect data in tourism site Copyright © 2012 SciRes. 724  Y. M. CHEN ET AL. Table 1. The test-retest reliability results. Product category Correlation coefficient Total point of WOM evaluation and consumption Transportation 0.93 Accommodation 0.85 Meals 0.87 Guiding 0.84 Travel agency 0.89 Total point of WOM evaluation and consumption Admission 0.87 Souvenir 0.96 Scenic spots 0.90 Total 0.89 (hotel and restaurant) for suitable sample is acceptable and, the WOM evaluation is a subjective variable and consumption is depended on consumer’s purchasing pattern is already under- standing, too. Results Following the mathematical notations in page 3, the authors obtain results by simple linear regression method. Table 2 pre- sents the results of data analysis for a closed economy, where β is a direct measure of the WOM elasticity of the 8 product categories. The results clearly show that the β value of all cate- gories of goods is greater than zero, and in which findings of all product categories are significant except scenic spots, then results in WOM with a positive enhancement can promote product consumption. The WOM elasticity results for the product categories are different, proving that WOM effects vary across products. Therefore, WOM elasticity is a considerable source of influ- ence that leads to different WOM effects. Furthermore, the empirical analysis examined that 1% changes in WOM have a positive percentage impact on the sales of goods, except scenic spots. Our results indicate that these goods are services have WOM elasticity values ranging from 0.58 to 1.29. Murray (1991) found that consumers use personal sources of information more when looking for service providers than when looking for physical goods, and the more expert the product knowledge, the greater the WOM influence on consumer decision making (Bansal & Voyer, 2000; Gilly et al., 1998; Rabaglietti et al, 2011), and the more lasting the effects (Berry, 1995). For most of the product of tourism, experience goods (Smith & Swinyard, 1982) also have a large influence like the travel agency, guiding or accommodation. However, these goods are physical have lower WOM elastic- ity values ranging from 0.21 to 0.64, even that the result of scenic spots is not significant, for three possible reasons. First, as the post research speaking that physical good with less WOM influence; second, the consumption of these products is not necessary in traveling; and third, the tourists’ evaluation of scenic spots have great response difference. The results means WOM wields considerable influence on Table 2. Results of the data analysis of the 8 product categories. Attribute Product category α β (EWOM) p value Significant (ρ < 0.1) Transportation3.83 0.58 0.03 ** Accommodation4.24 0.78 0.06 * Meals 2.53 0.75 0.05 ** Guiding 3.03 1.03 0.02 ** Service Travel agency5.53 1.29 0.09 * Admission 4.40 0.21 0.03 ** Souvenir 6.82 0.33 0.10 * Physical Scenic spots 7.57 0.64 0.23 Average of total 4.740.65 0.076 * The sign of two stars (**) is ρ < 0.05 that represent the result is very significant, and one stars (*) is 0.05 ≦ ρ < 0.1 that represent the result is significant. consumer purchases in tourism product categories, and the average evaluation of WOM for all product categories is 77.89 (highest score is 100, see Table 3), which reveals that the con- sumer would purchase goods if he or she had a stronger feeling about the WOM and ensures that WOM is an effective market- ing tool in tourism. The power of WOM observed in this study’s results echoes previous researchers who emphasized that WOM can make the difference between product success and failure (e.g., Godes & Mayzlin, 2004; Laczniak et al., 2001). Discussion Theoretical Implications The most important theoretical implication in this study is the concept of WOM elasticity was designed to an intermediate indicator to integrate all factors which may affect the product sales, then used to calculate and compare the WOM influence on product sales. Although prior research has greatly taken the use of elasticity theory to increase our understanding of social science, most studies have focused solely on single event (product) appearance or on a variety of products. Remarkably, we have no one-size-fits-all standard to quan- tify WOM to estimate WOM elasticity value; however, we can bypass WOM measurement by using each recipient's personal, subjective assessment of WOM influence. Note that the WOM recipients (consumers) are the purchase decision makers (Sweeney, 2008) evaluating how WOM affects their decision making and expectations of consumptions (Devlin et al., 2002; Webster, 1991). This scale of WOM elasticity limits the ability of academics to copy with the complex of WOM variable (e.g. negative WOM), and hope to develop improved technology (construct the panel data base for long term) for future use. One implica- tion from the findings is that although consumers can be put into segmented classes according to their purchase expenditures it may not translate into purchase quantity. However, the intro- duction of the concept of economic elasticity as an implement to provide a simple method to quantify and compare WOM effects that found WOM elasticity values showed a statistical difference and that it has a significant WOM influence on ser- Copyright © 2012 SciRes. 725 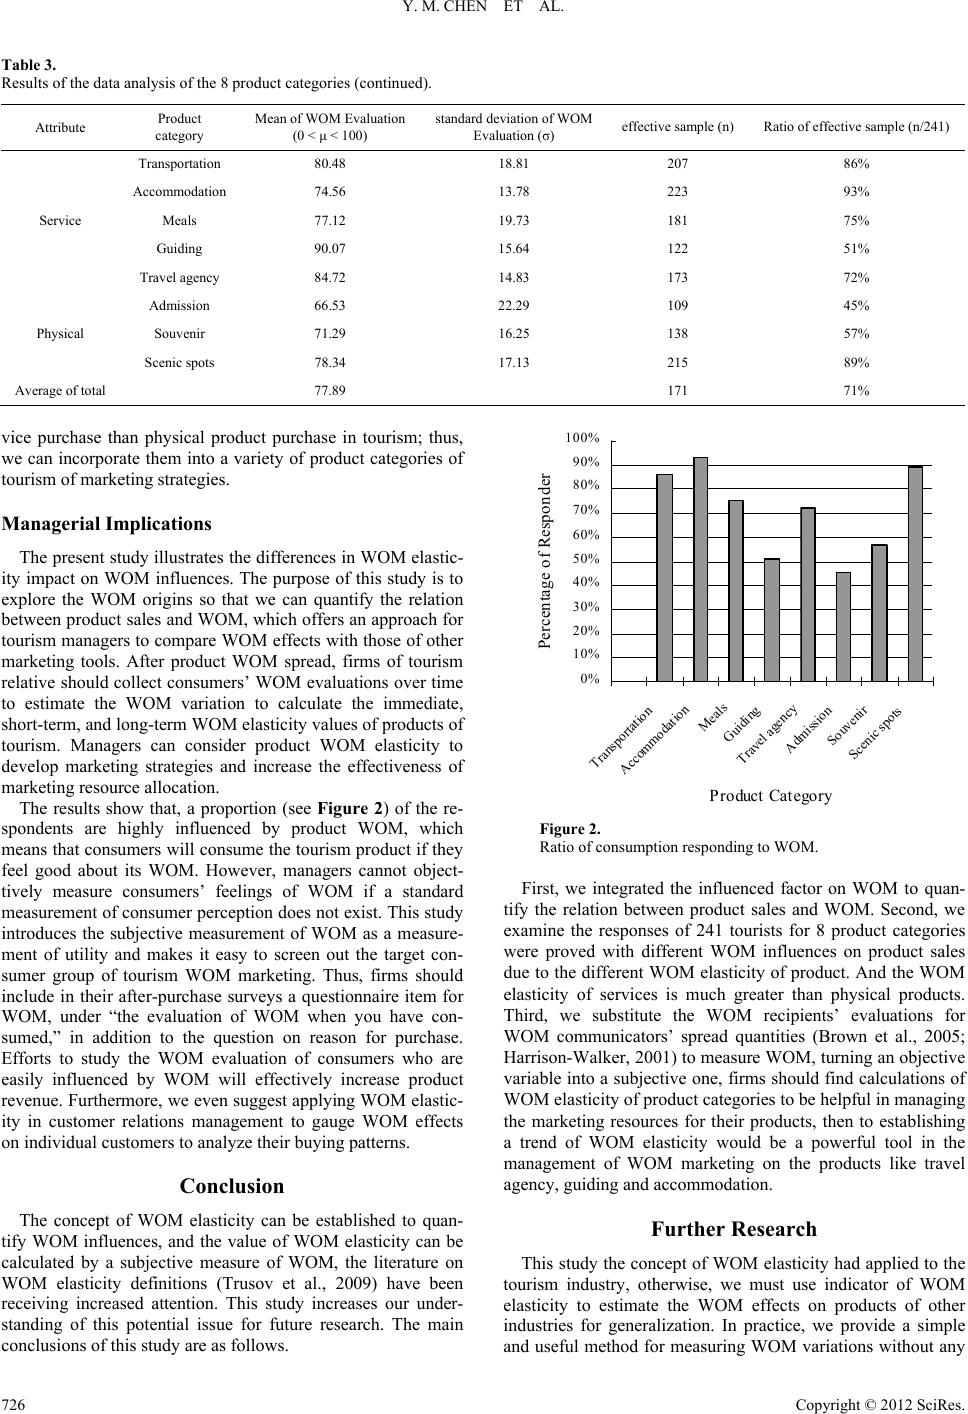 Y. M. CHEN ET AL. Copyright © 2012 SciRes. 726 Table 3. Results of the data analysis of the 8 product categories (continued). Attribute Product category Mean of WOM Evaluation (0 < μ < 100) standard deviation of WOM Evaluation (σ) effective sample (n) Ratio of effective sample (n/241) Transportation 80.48 18.81 207 86% Accommodation 74.56 13.78 223 93% Meals 77.12 19.73 181 75% Guiding 90.07 15.64 122 51% Service Travel agency 84.72 14.83 173 72% Admission 66.53 22.29 109 45% Souvenir 71.29 16.25 138 57% Physical Scenic spots 78.34 17.13 215 89% Average of total 77.89 171 71% vice purchase than physical product purchase in tourism; thus, we can incorporate them into a variety of product categories of tourism of marketing strategies. 0% 10% 20% 30% 40% 50% 60% 70% 80% 90% 100% Transportatio n Accommodatio n Meals Guiding Travel agency Admis sion Souvenir Scenic spots Product Category Percentage of Responder Managerial Implicati o ns The present study illustrates the differences in WOM elastic- ity impact on WOM influences. The purpose of this study is to explore the WOM origins so that we can quantify the relation between product sales and WOM, which offers an approach for tourism managers to compare WOM effects with those of other marketing tools. After product WOM spread, firms of tourism relative should collect consumers’ WOM evaluations over time to estimate the WOM variation to calculate the immediate, short-term, and long-term WOM elasticity values of products of tourism. Managers can consider product WOM elasticity to develop marketing strategies and increase the effectiveness of marketing resource allocation. The results show that, a proportion (see Figure 2) of the re- spondents are highly influenced by product WOM, which means that consumers will consume the tourism product if they feel good about its WOM. However, managers cannot object- tively measure consumers’ feelings of WOM if a standard measurement of consumer perception does not exist. This study introduces the subjective measurement of WOM as a measure- ment of utility and makes it easy to screen out the target con- sumer group of tourism WOM marketing. Thus, firms should include in their after-purchase surveys a questionnaire item for WOM, under “the evaluation of WOM when you have con- sumed,” in addition to the question on reason for purchase. Efforts to study the WOM evaluation of consumers who are easily influenced by WOM will effectively increase product revenue. Furthermore, we even suggest applying WOM elastic- ity in customer relations management to gauge WOM effects on individual customers to analyze their buying patterns. Figure 2. Ratio of consumption responding to WOM. First, we integrated the influenced factor on WOM to quan- tify the relation between product sales and WOM. Second, we examine the responses of 241 tourists for 8 product categories were proved with different WOM influences on product sales due to the different WOM elasticity of product. And the WOM elasticity of services is much greater than physical products. Third, we substitute the WOM recipients’ evaluations for WOM communicators’ spread quantities (Brown et al., 2005; Harrison-Walker, 2001) to measure WOM, turning an objective variable into a subjective one, firms should find calculations of WOM elasticity of product categories to be helpful in managing the marketing resources for their products, then to establishing a trend of WOM elasticity would be a powerful tool in the management of WOM marketing on the products like travel agency, guiding and accommodation. Conclusion The concept of WOM elasticity can be established to quan- tify WOM influences, and the value of WOM elasticity can be calculated by a subjective measure of WOM, the literature on WOM elasticity definitions (Trusov et al., 2009) have been receiving increased attention. This study increases our under- standing of this potential issue for future research. The main conclusions of this study are as follows. Further Research This study the concept of WOM elasticity had applied to the tourism industry, otherwise, we must use indicator of WOM elasticity to estimate the WOM effects on products of other industries for generalization. In practice, we provide a simple and useful method for measuring WOM variations without any 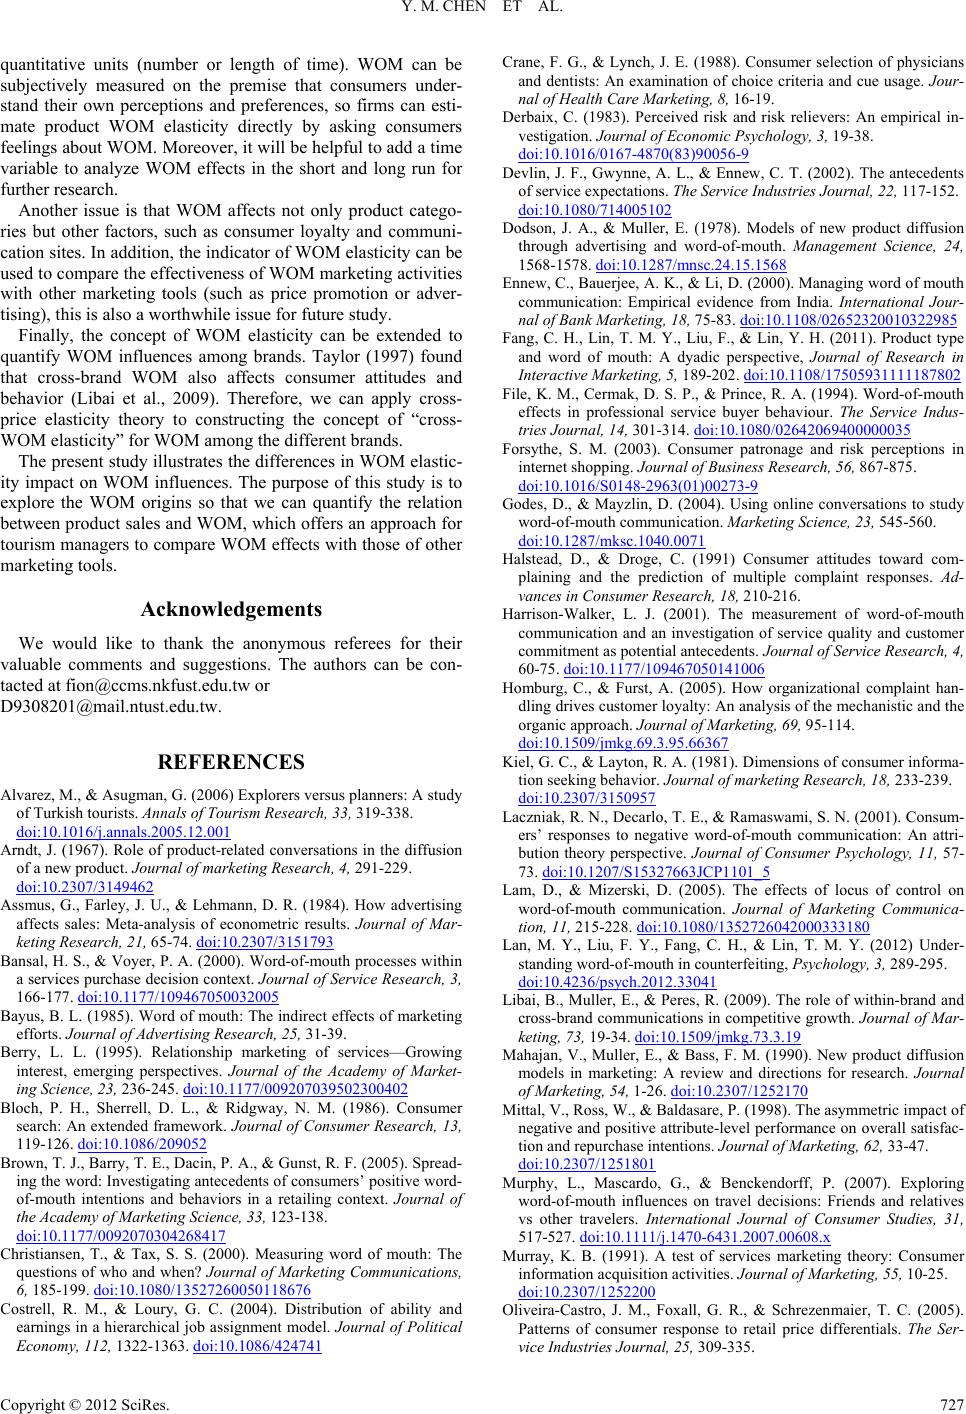 Y. M. CHEN ET AL. quantitative units (number or length of time). WOM can be subjectively measured on the premise that consumers under- stand their own perceptions and preferences, so firms can esti- mate product WOM elasticity directly by asking consumers feelings about WOM. Moreover, it will be helpful to add a time variable to analyze WOM effects in the short and long run for further research. Another issue is that WOM affects not only product catego- ries but other factors, such as consumer loyalty and communi- cation sites. In addition, the indicator of WOM elasticity can be used to compare the effectiveness of WOM marketing activities with other marketing tools (such as price promotion or adver- tising), this is also a worthwhile issue for future study. Finally, the concept of WOM elasticity can be extended to quantify WOM influences among brands. Taylor (1997) found that cross-brand WOM also affects consumer attitudes and behavior (Libai et al., 2009). Therefore, we can apply cross- price elasticity theory to constructing the concept of “cross- WOM elasticity” for WOM among the different brands. The present study illustrates the differences in WOM elastic- ity impact on WOM influences. The purpose of this study is to explore the WOM origins so that we can quantify the relation between product sales and WOM, which offers an approach for tourism managers to compare WOM effects with those of other marketing tools. Acknowledgements We would like to thank the anonymous referees for their valuable comments and suggestions. The authors can be con- tacted at fion@ccms.nkfust.edu.tw or REFERENCES Alvarez, M., & Asugman, G. (2006) Explorers versus planners: A study of Turkish tourists. Annals of Tourism Research, 33, 319-338. doi:10.1016/j.annals.2005.12.001 Arndt, J. (1967). Role of product-related conversations in the diffusion of a new product. Journal of marketing Research, 4, 291-229. doi:10.2307/3149462 Assmus, G., Farley, J. U., & Lehmann, D. R. (1984). How advertising affects sales: Meta-analysis of econometric results. Journal of Mar- keting Research, 21, 65-74. doi:10.2307/3151793 Bansal, H. S., & Voyer, P. A. (2000). Word-of-mouth processes within a services purchase decision context. Journal of Service Research, 3, 166-177. doi:10.1177/109467050032005 Bayus, B. L. (1985). Word of mouth: The indirect effects of marketing efforts. Journ al o f Advertising Research, 25, 31-39. Berry, L. L. (1995). Relationship marketing of services—Growing interest, emerging perspectives. Journal of the Academy of Market- ing Science, 23, 236-245. doi:10.1177/009207039502300402 Bloch, P. H., Sherrell, D. L., & Ridgway, N. M. (1986). Consumer search: An extended framework. Journal of Consumer Research, 13, 119-126. doi:10.1086/209052 Brown, T. J., Barry, T. E., Dacin, P. A., & Gunst, R. F. (2005). Spread- ing the word: Investigating antecedents of consumers’ positive word- of-mouth intentions and behaviors in a retailing context. Journal of the Academy of Marketing Science, 33, 123-138. doi:10.1177/0092070304268417 Christiansen, T., & Tax, S. S. (2000). Measuring word of mouth: The questions of who and when? Journal of Marketing Communications, 6, 185-199. doi:10.1080/13527260050118676 Costrell, R. M., & Loury, G. C. (2004). Distribution of ability and earnings in a hierarchical job assignment model. Journal of Political Economy, 112, 1322-1363. doi:10.1086/424741 Crane, F. G., & Lynch, J. E. (1988). Consumer selection of physicians and dentists: An examination of choice criteria and cue usage. Jour- nal of Health Care Marketing, 8, 16-19. Derbaix, C. (1983). Perceived risk and risk relievers: An empirical in- vestigation. Journ al of Economic Psychology, 3, 19-38. doi:10.1016/0167-4870(83)90056-9 Devlin, J. F., Gwynne, A. L., & Ennew, C. T. (2002). The antecedents of service expectations. The Service Industries Journal, 22, 117-152. doi:10.1080/714005102 Dodson, J. A., & Muller, E. (1978). Models of new product diffusion through advertising and word-of-mouth. Management Science, 24, 1568-1578. doi:10.1287/mnsc.24.15.1568 Ennew, C., Bauerjee, A. K., & Li, D. (2000). Managing word of mouth communication: Empirical evidence from India. International Jour- nal of Bank Marketing, 18, 75-83. doi:10.1108/02652320010322985 Fang, C. H., Lin, T. M. Y., Liu, F., & Lin, Y. H. (2011). Product type and word of mouth: A dyadic perspective, Journal of Research in Interactive Marketing, 5, 189-202. doi:10.1108/17505931111187802 File, K. M., Cermak, D. S. P., & Prince, R. A. (1994). Word-of-mouth effects in professional service buyer behaviour. The Service Indus- tries Journal, 14, 301-314. doi:10.1080/02642069400000035 Forsythe, S. M. (2003). Consumer patronage and risk perceptions in internet shopping. Journal o f Business Research, 56, 867-875. doi:10.1016/S0148-2963(01)00273-9 Godes, D., & Mayzlin, D. (2004). Using online conversations to study word-of-mouth communication. Marketing Science, 23, 545-560. doi:10.1287/mksc.1040.0071 Halstead, D., & Droge, C. (1991) Consumer attitudes toward com- plaining and the prediction of multiple complaint responses. Ad- vances in Consumer Research, 18, 210-216. Harrison-Walker, L. J. (2001). The measurement of word-of-mouth communication and an investigation of service quality and customer commitment as potential antecedents. Journal of Service Research, 4, 60-75. doi:10.1177/109467050141006 Homburg, C., & Furst, A. (2005). How organizational complaint han- dling drives customer loyalty: An analysis of the mechanistic and the organic approach. Journal of Marketing, 69, 95-114. doi:10.1509/jmkg.69.3.95.66367 Kiel, G. C., & Layton, R. A. (1981). Dimensions of consumer informa- tion seeking behavior. Journal of marketing Research, 18, 233-239. doi:10.2307/3150957 Laczniak, R. N., Decarlo, T. E., & Ramaswami, S. N. (2001). Consum- ers’ responses to negative word-of-mouth communication: An attri- bution theory perspective. Journal of Consumer Psychology, 11, 57- 73. doi:10.1207/S15327663JCP1101_5 Lam, D., & Mizerski, D. (2005). The effects of locus of control on word-of-mouth communication. Journal of Marketing Communica- tion, 11, 215-228. doi:10.1080/1352726042000333180 Lan, M. Y., Liu, F. Y., Fang, C. H., & Lin, T. M. Y. (2012) Under- standing word-of-mouth in counterfeiting, Psychology, 3, 289-295. doi:10.4236/psych.2012.33041 Libai, B., Muller, E., & Peres, R. (2009). The role of within-brand and cross-brand communications in competitive growth. Journal of Mar- keting, 73, 19-34. doi:10.1509/jmkg.73.3.19 Mahajan, V., Muller, E., & Bass, F. M. (1990). New product diffusion models in marketing: A review and directions for research. Journal of Marketing, 54, 1-26. doi:10.2307/1252170 Mittal, V., Ross, W., & Baldasare, P. (1998). The asymmetric impact of negative and positive attribute-level performance on overall satisfac- tion and repurchase intentions. Journal of Marketing, 62, 33-47. doi:10.2307/1251801 Murphy, L., Mascardo, G., & Benckendorff, P. (2007). Exploring word-of-mouth influences on travel decisions: Friends and relatives vs other travelers. International Journal of Consumer Studies, 31, 517-527. doi:10.1111/j.1470-6431.2007.00608.x Murray, K. B. (1991). A test of services marketing theory: Consumer information acquisition activities. J ourna l of M arket ing, 55, 10-25. doi:10.2307/1252200 Oliveira-Castro, J. M., Foxall, G. R., & Schrezenmaier, T. C. (2005). Patterns of consumer response to retail price differentials. The Ser- vice Industries Journal, 25, 309-335. Copyright © 2012 SciRes. 727  Y. M. CHEN ET AL. Copyright © 2012 SciRes. 728 doi:10.1080/02642060500050392 Pan, B., MacLaurin, T., & Crotts, J. C. (2007). Travel blogs and the implications for destination. Marketing Journal of Travel Research, 46, 35-45. doi:10.1177/0047287507302378 Rabaglietti, E., Liubicich, M. E., & Ciairano, S. (2011). Gender dif- fer-ences in the relationships between physical activity and the psy- cho-logical and physical self-reported condition of the elderly in a resi-dential care facility. Psychology, 2, 35-41. doi:10.4236/psych.2011.21006 Schmallegger, D., & Carson, D. (2008). Blogs in tourism: Changing approaches to information exchange. Journal of Vacation Marketing, 14, 99-110. doi:10.1177/1356766707087519 Smith, R. E., & Swinyard, W. R. (1982). Information response models: An integrated approach. Journal of Marketing, 46, 81-93. doi:10.2307/1251162 Sweeney, J. C., Soutar, G. N., & Mazzarol, T. (2008). Factors influ- encing word of mouth effectiveness: Receiver perspectives. Euro- pean Journal of Marketing, 42, 344-364. doi:10.1108/03090560810852977 Sui, J. J., & Baloglu, S. (2003). The role of emotional commitment in relationship marketing: An empirical investigation of a loyalty model for casinos. Journal of Hospitality & Tourism Re search, 27, 470-489. Taylor, K. A. (1997). A regret theory approach to assessing consumer satisfaction. Marketing Letters, 8, 229-238. doi:10.1023/A:1007966621364 Trusov, M., Bucklin, R. E., & Pauwels, K. (2009). Effects of word-of- mouth versus traditional marketing: Findings from an Internet social networking site. Journal of Ma rk eti ng, 73, 90-102. doi:10.1509/jmkg.73.5.90 Villanueva, J., Yoo, S., & Hanssens, D. M. (2008). The impact of mar- keting-induced vs word-of-mouth customer acquisition on customer equity. Journal of mar ke ti ng Research, 45, 48-59. doi:10.1509/jmkr.45.1.48 Webster, C. (1991). Influences upon consumer expectations of services. The Journal of Services Mar ke t i ng , 5, 5-17. doi:10.1108/08876049110035440 Wirjanto, T. S. (2004). Exploring consumption-based asset pricing model with stochastic-trend forcing processes. Applied Economics, 36, 1591-1597. doi:10.1080/0003684042000217940 |