

Paper Menu >>
Journal Menu >>
 Journal of Minerals and Materials Characterization and Engineering, 2012, 11, 869-875 Published Online September 2012 (http://www.SciRP.org/journal/jmmce) Application of Hooke & Jeeves Algorithm in Optimizing Fusion Zone Grain Size and Hardness of Pulsed Current Micro Plasma Arc W elded AISI 304L Sheets Kondapalli Siva Prasad1*, Chalamalasetti Srinivasa Rao2, Damera Nageswara Rao3 1Department of Mechanical Engineering, Anil Neerukonda Institute of Technology & Sciences, Visakhapatnam, India 2Department of Mechanical Engineering, Andhra University, Visakhapatnam, India 3Centurion University of Technology & Management, Odisha, India Email: *[email protected] Received April 2, 2012; revised May 6, 2012; accepted May 27, 2012 ABSTRACT AISI 304L is an austenitic Chromium-Nickel stainless steel offering the optimum combination of corrosion resistance, strength and ductility. These attributes make it a favorite for many mechanical components. The paper focuses on de- veloping mathematical models to predict grain size and hardness of pulsed current micro plasma arc welded AISI 304L joints. Four factors, five level, central composite rotatable design matrix is used to optimize the number of experiments. The mathematical models have been developed by Response Surface Method (RSM) and its adequacy is checked by Analysis of Variance (ANOVA) technique. By using the developed mathematical models, grain size and hardness of the weld joints can be predicted with 99% confidence level. The developed mathematical models have been optimized us- ing Hooke and Jeeves algorithm to minimize grain size and maximize the hardness. Keywords: Pulsed Current Micro Plasma Arc Welding; AISI 304L; Grain Size; Hardness; Hooke & Jeeves Algorithm 1. Introduction In welding processes, the input parameters have greater influence on the mechanical properties of the weld joints. By varying the input process parameters, the output could be changed with significant variation in their me- chanical properties. Accordingly, welding is usually se- lected to get a welded joint with excellent mechanical properties. To determine these welding combinations that would lead to excellent mechanical properties, different methods and approaches have been used. Various opti- mization methods can be applied to define the desired output variables through developing mathematical mod- els to specify the relationship between the input parame- ters and output variables. One of the most widely used methods to solve this problem is Response Surface Methodology (RSM), in which the unknown mechanism with an appropriate empirical model is approximated, being the function of representing a RSM. Welding thin sheets is quite different from welding thick sections, because during welding of thin sheets many problems are experienced. These problems are usually linked with heat input. Fusion welding generally involves joining of metals by application of heat for melting of metals to be joined. Almost all the conven- tional arc welding processes offer high heat input, which in turn leads to various problems such as burn through or melt trough, distortion, porosity, buckling warping & twisting of welded sheets, grain coarsening , evaporation of useful elements present in coating of the sheets, joint gap variation during welding, fume generation form coated sheets etc. Use of proper welding process, proce- dure and technique is one tool to address this issue [1]. Micro Plasma arc Welding (MPAW) is a good process for joining thin sheet, but it suffers high equipment cost compared to Gas Tungsten Arc Welding (GTAW). However it is more economical when compare with Laser Beam welding and Electron Beam Welding processes. Pulsed current MPAW involves cycling the welding current at selected regular frequency. The maximum current is selected to give adequate penetration and bead contour, while the minimum is set at a level sufficient to maintain a stable arc [2,3]. This permits arc energy to be used effectively to fuse a spot of controlled dimensions in a short time producing the weld as a series of overlap- ping nuggets. By contrast, in constant current welding, the heat required to melt the base material is supplied only during the peak current pulses allowing the heat to dissipate into the base material leading to narrower Heat *Corresponding author. Copyright © 2012 SciRes. JMMCE 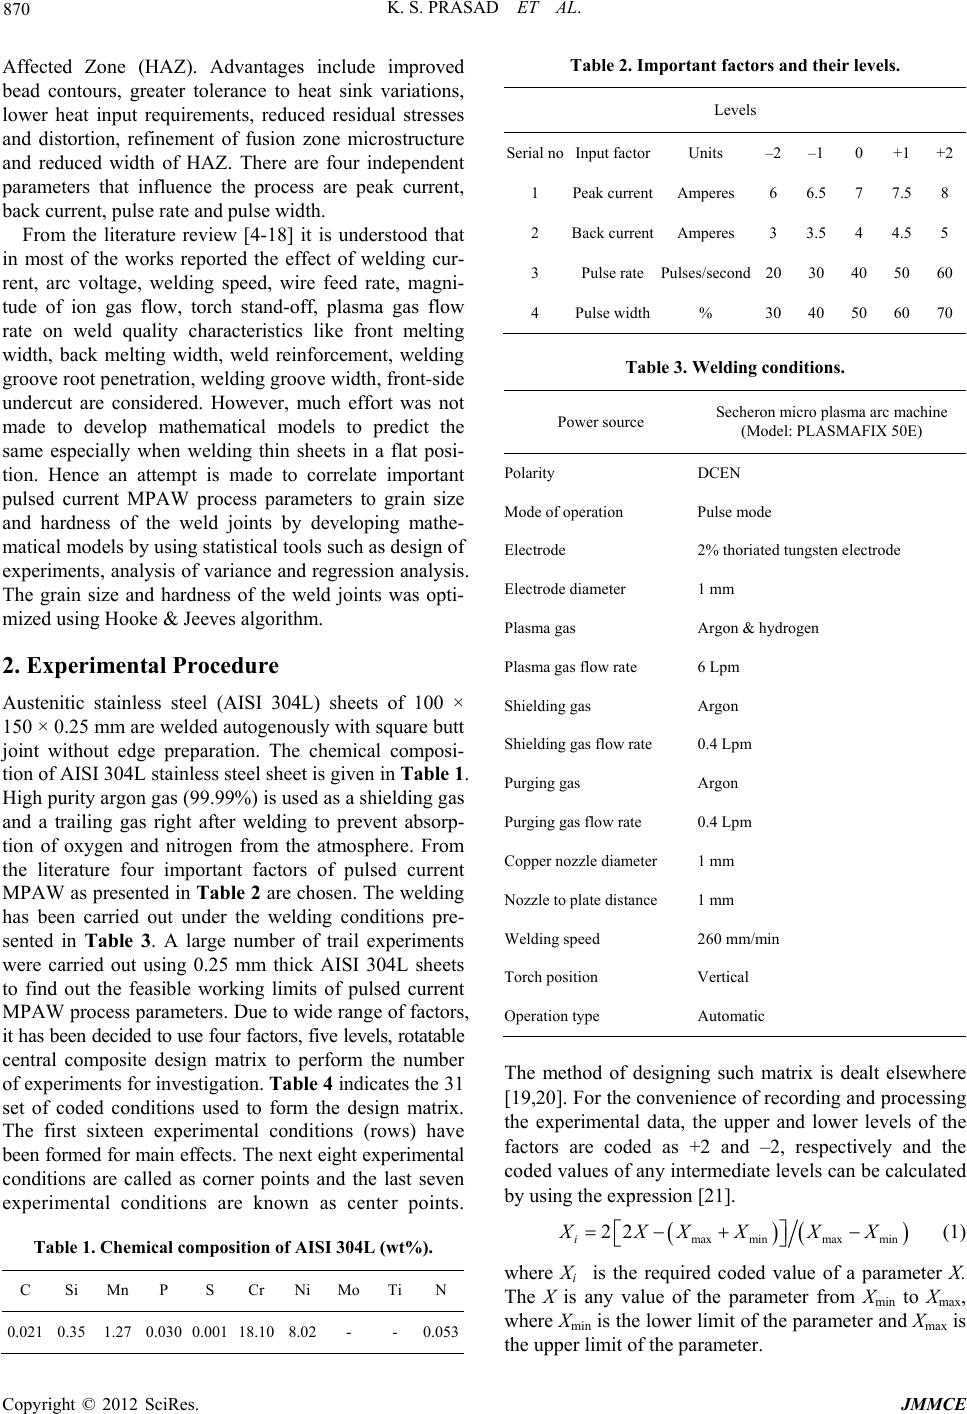 K. S. PRASAD ET AL. 870 Affected Zone (HAZ). Advantages include improved bead contours, greater tolerance to heat sink variations, lower heat input requirements, reduced residual stresses and distortion, refinement of fusion zone microstructure and reduced width of HAZ. There are four independent parameters that influence the process are peak current, back current, pulse rate and pulse width. From the literature review [4-18] it is understood that in most of the works reported the effect of welding cur- rent, arc voltage, welding speed, wire feed rate, magni- tude of ion gas flow, torch stand-off, plasma gas flow rate on weld quality characteristics like front melting width, back melting width, weld reinforcement, welding groove root penetration, welding groove width, front-side undercut are considered. However, much effort was not made to develop mathematical models to predict the same especially when welding thin sheets in a flat posi- tion. Hence an attempt is made to correlate important pulsed current MPAW process parameters to grain size and hardness of the weld joints by developing mathe- matical models by using statistical tools such as design of experiments, analysis of variance and regression analysis. The grain size and hardness of the weld joints was opti- mized using Hooke & Jeeves algorithm. 2. Experimental Procedure Austenitic stainless steel (AISI 304L) sheets of 100 × 150 × 0.25 mm are welded autogenously with square butt joint without edge preparation. The chemical composi- tion of AISI 304L stainless steel sheet is given in Table 1. High purity argon gas (99.99%) is used as a shielding gas and a trailing gas right after welding to prevent absorp- tion of oxygen and nitrogen from the atmosphere. From the literature four important factors of pulsed current MPAW as presented in Table 2 are chosen. The welding has been carried out under the welding conditions pre- sented in Table 3. A large number of trail experiments were carried out using 0.25 mm thick AISI 304L sheets to find out the feasible working limits of pulsed current MPAW process parameters. Due to wide range of factors, it has been decided to use four factors, five levels, rotatable central composite design matrix to perform the number of experiments for investigation. Table 4 indicates the 31 set of coded conditions used to form the design matrix. The first sixteen experimental conditions (rows) have been formed for main effects. The next eight experimental conditions are called as corner points and the last seven experimental conditions are known as center points. Table 1. Chemical composition of AISI 304L (wt%). C Si Mn P S Cr Ni Mo Ti N 0.021 0.35 1.27 0.030 0.001 18.10 8.02 - - 0.053 Table 2. Important factors and their levels. Levels Serial noInput factorUnits –2 –1 0 +1+2 1 Peak currentAmperes 6 6.5 7 7.5 8 2 Back currentAmperes 3 3.5 4 4.5 5 3 Pulse ratePulses/second 20 30 40 50 60 4 Pulse width% 30 40 50 60 70 Table 3. Welding conditions. Power source Secheron micro plasma arc machine (Model: PLASMAFIX 50E) Polarity DCEN Mode of operation Pulse mode Electrode 2% thoriated tungsten electrode Electrode diameter 1 mm Plasma gas Argon & hydrogen Plasma gas flow rate 6 Lpm Shielding gas Argon Shielding gas flow rate 0.4 Lpm Purging gas Argon Purging gas flow rate 0.4 Lpm Copper nozzle diameter 1 mm Nozzle to plate distance 1 mm Welding speed 260 mm/min Torch position Vertical Operation type Automatic The method of designing such matrix is dealt elsewhere [19,20]. For the convenience of recording and processing the experimental data, the upper and lower levels of the factors are coded as +2 and –2, respectively and the coded values of any intermediate levels can be calculated by using the expression [21]. max minmax min 22 i XXXXXX (1) where Xi is the required coded value of a parameter X. The X is any value of the parameter from Xmin to Xmax, where Xmin is the lower limit of the parameter and Xmax is the upper limit of the parameter. Copyright © 2012 SciRes. JMMCE 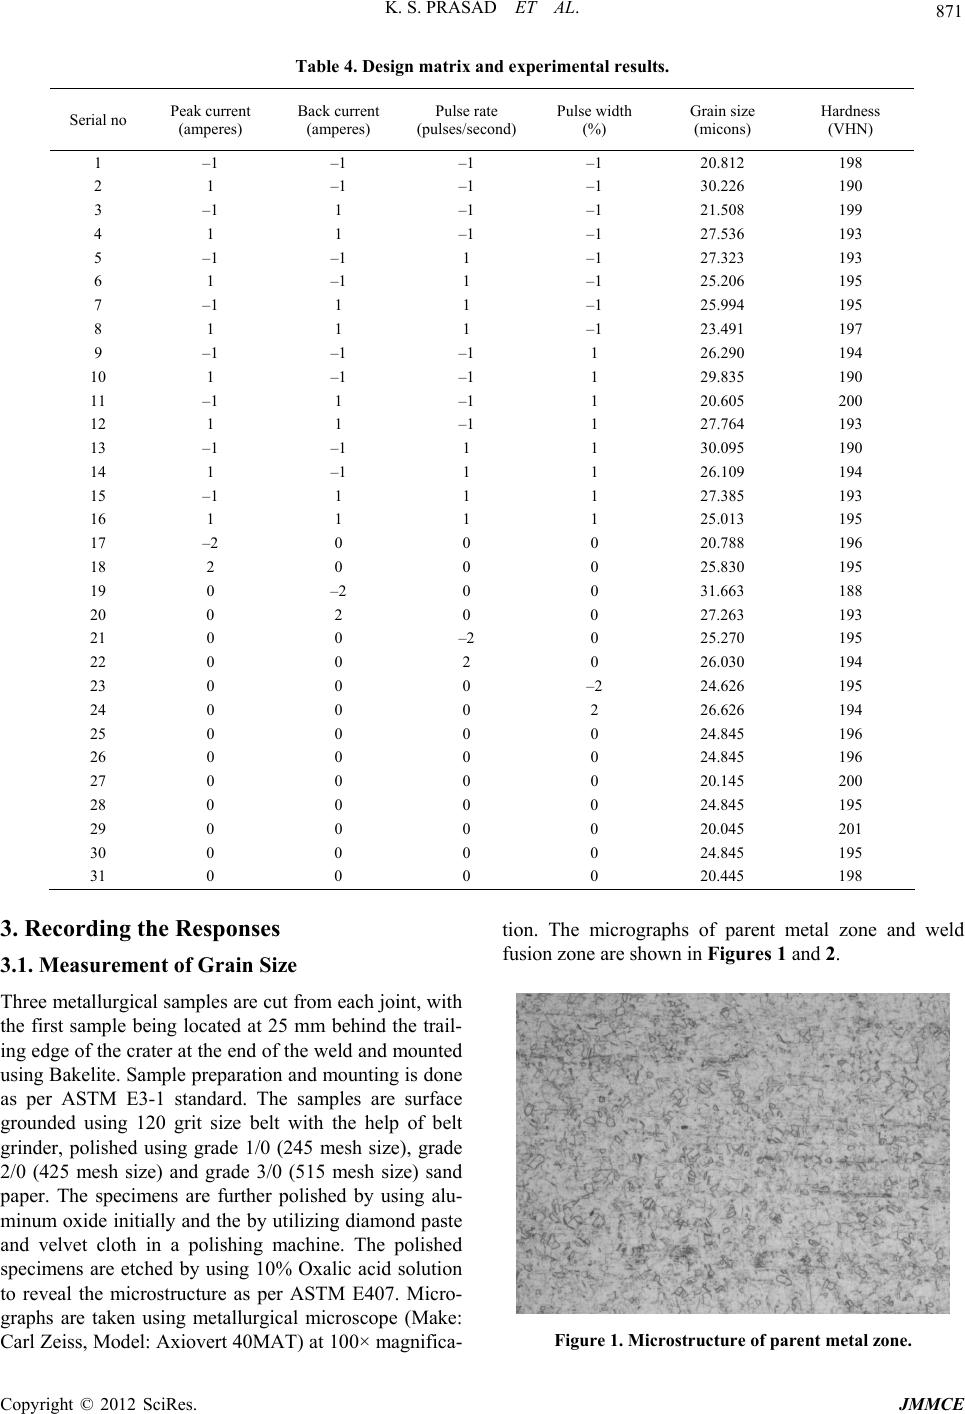 K. S. PRASAD ET AL. Copyright © 2012 SciRes. JMMCE 871 Table 4. Design matrix and experimental results. Serial no Peak current (amperes) Back current (amperes) Pulse rate (pulses/second) Pulse width (%) Grain size (micons) Hardness (VHN) 1 –1 –1 –1 –1 20.812 198 2 1 –1 –1 –1 30.226 190 3 –1 1 –1 –1 21.508 199 4 1 1 –1 –1 27.536 193 5 –1 –1 1 –1 27.323 193 6 1 –1 1 –1 25.206 195 7 –1 1 1 –1 25.994 195 8 1 1 1 –1 23.491 197 9 –1 –1 –1 1 26.290 194 10 1 –1 –1 1 29.835 190 11 –1 1 –1 1 20.605 200 12 1 1 –1 1 27.764 193 13 –1 –1 1 1 30.095 190 14 1 –1 1 1 26.109 194 15 –1 1 1 1 27.385 193 16 1 1 1 1 25.013 195 17 –2 0 0 0 20.788 196 18 2 0 0 0 25.830 195 19 0 –2 0 0 31.663 188 20 0 2 0 0 27.263 193 21 0 0 –2 0 25.270 195 22 0 0 2 0 26.030 194 23 0 0 0 –2 24.626 195 24 0 0 0 2 26.626 194 25 0 0 0 0 24.845 196 26 0 0 0 0 24.845 196 27 0 0 0 0 20.145 200 28 0 0 0 0 24.845 195 29 0 0 0 0 20.045 201 30 0 0 0 0 24.845 195 31 0 0 0 0 20.445 198 3. Recording the Responses 3.1. Measurement of Grain Size Three metallurgical samples are cut from each joint, with the first sample being located at 25 mm behind the trail- ing edge of the crater at the end of the weld and mounted using Bakelite. Sample preparation and mounting is done as per ASTM E3-1 standard. The samples are surface grounded using 120 grit size belt with the help of belt grinder, polished using grade 1/0 (245 mesh size), grade 2/0 (425 mesh size) and grade 3/0 (515 mesh size) sand paper. The specimens are further polished by using alu- minum oxide initially and the by utilizing diamond paste and velvet cloth in a polishing machine. The polished specimens are etched by using 10% Oxalic acid solution to reveal the microstructure as per ASTM E407. Micro- graphs are taken using metallurgical microscope (Make: Carl Zeiss, Model: Axiovert 40MAT) at 100× magnifica- tion. The micrographs of parent metal zone and weld fusion zone are shown in Figures 1 and 2. Figure 1. Microstructure of parent metal zone. 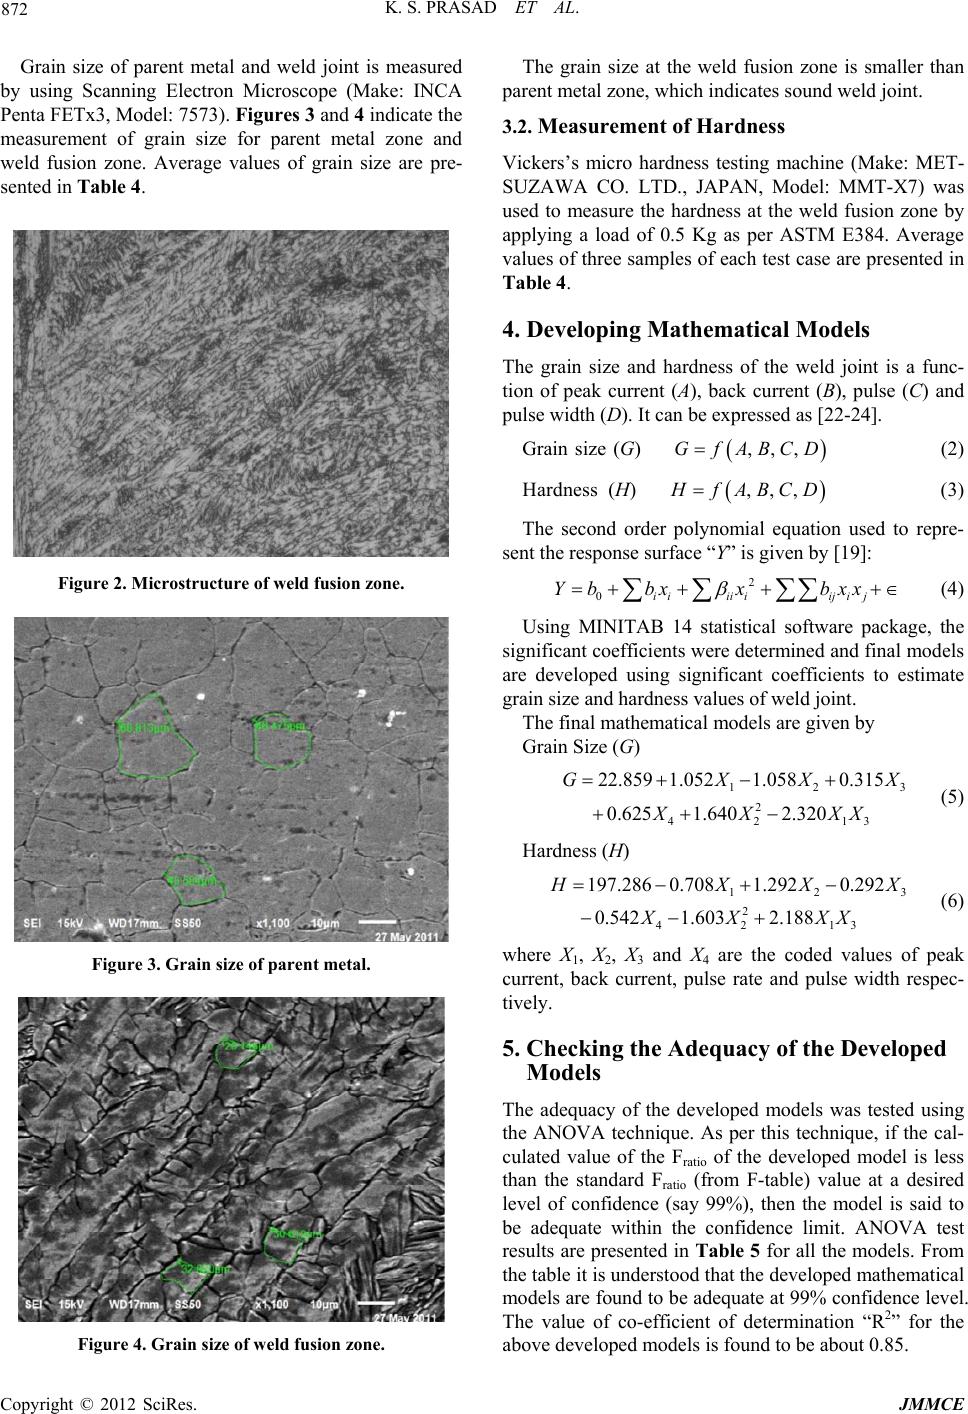 K. S. PRASAD ET AL. 872 Grain size of parent metal and weld joint is measured by using Scanning Electron Microscope (Make: INCA Penta FETx3, Model: 7573). Figures 3 and 4 indicate the measurement of grain size for parent metal zone and weld fusion zone. Average values of grain size are pre- sented in Table 4. Figure 2. Microstructure of weld fusion zone. Figure 3. Grain size of parent metal. Figure 4. Grain size of weld fusion zone. The grain size at the weld fusion zone is smaller than parent metal zone, which indicates sound weld joint. 3.2. Measurement of Hardness Vickers’s micro hardness testing machine (Make: MET- SUZAWA CO. LTD., JAPAN, Model: MMT-X7) was used to measure the hardness at the weld fusion zone by applying a load of 0.5 Kg as per ASTM E384. Average values of three samples of each test case are presented in Table 4. 4. Developing Mathematical Models The grain size and hardness of the weld joint is a func- tion of peak current (A), back current (B), pulse (C) and pulse width (D). It can be expressed as [22-24]. Grain size (G) ,,,GfABCD (2) Hardness (H) ,,, H fABCD (3) The second order polynomial equation used to repre- sent the response surface “Y” is given by [19]: 2 0iiiiiiji j Yb bxxbxx (4) Using MINITAB 14 statistical software package, the significant coefficients were determined and final models are developed using significant coefficients to estimate grain size and hardness values of weld joint. The final mathematical models are given by Grain Size (G) 12 2 42 13 22.859 1.0521.0580.315 0.625 1.6402.320 GXX XX XX 3 X 3 (5) Hardness (H) 12 2 42 13 197.286 0.7081.2920.292 0.542 1.6032.188 H XX XX XX X (6) where X1, X2, X3 and X4 are the coded values of peak current, back current, pulse rate and pulse width respec- tively. 5. Checking the Adequacy of the Developed Models The adequacy of the developed models was tested using the ANOVA technique. As per this technique, if the cal- culated value of the Fratio of the developed model is less than the standard Fratio (from F-table) value at a desired level of confidence (say 99%), then the model is said to be adequate within the confidence limit. ANOVA test results are presented in Table 5 for all the models. From the table it is understood that the developed mathematical models are found to be adequate at 99% confidence level. The value of co-efficient of determination “R2” for the above developed models is found to be about 0.85. Copyright © 2012 SciRes. JMMCE 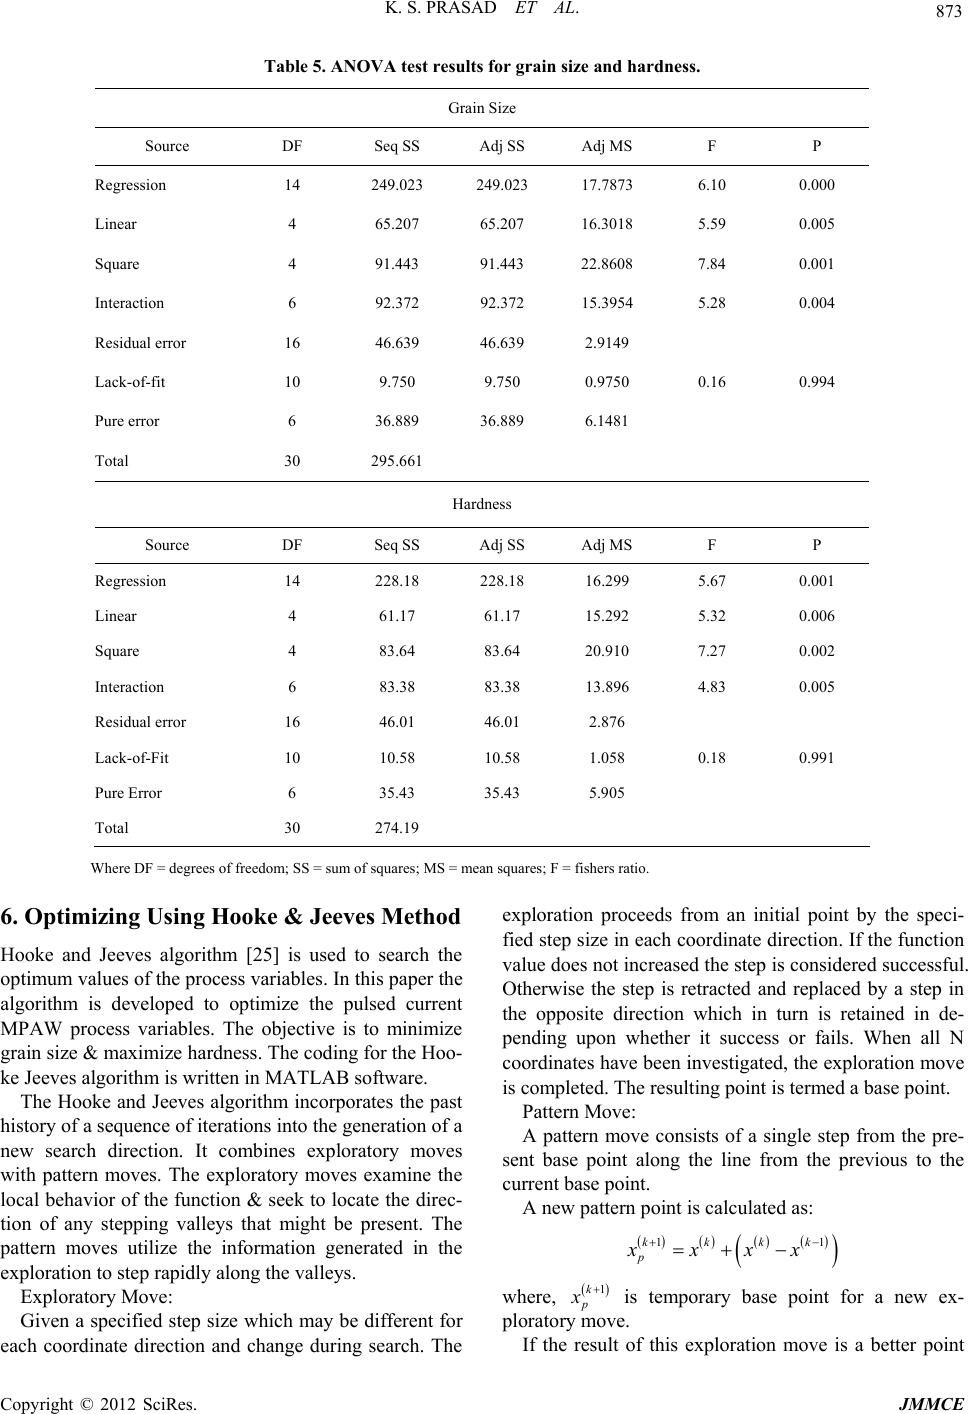 K. S. PRASAD ET AL. Copyright © 2012 SciRes. JMMCE 873 Table 5. ANOVA test results for grain size and hardness. Grain Size Source DF Seq SS Adj SS Adj MS F P Regression 14 249.023 249.023 17.7873 6.10 0.000 Linear 4 65.207 65.207 16.3018 5.59 0.005 Square 4 91.443 91.443 22.8608 7.84 0.001 Interaction 6 92.372 92.372 15.3954 5.28 0.004 Residual error 16 46.639 46.639 2.9149 Lack-of-fit 10 9.750 9.750 0.9750 0.16 0.994 Pure error 6 36.889 36.889 6.1481 Total 30 295.661 Hardness Source DF Seq SS Adj SS Adj MS F P Regression 14 228.18 228.18 16.299 5.67 0.001 Linear 4 61.17 61.17 15.292 5.32 0.006 Square 4 83.64 83.64 20.910 7.27 0.002 Interaction 6 83.38 83.38 13.896 4.83 0.005 Residual error 16 46.01 46.01 2.876 Lack-of-Fit 10 10.58 10.58 1.058 0.18 0.991 Pure Error 6 35.43 35.43 5.905 Total 30 274.19 Where DF = degrees of freedom; SS = sum of squares; MS = mean squares; F = fishers ratio. 6. Optimizing Using Hooke & Jeeves Method Hooke and Jeeves algorithm [25] is used to search the optimum values of the process variables. In this paper the algorithm is developed to optimize the pulsed current MPAW process variables. The objective is to minimize grain size & maximize hardness. The coding for the Hoo- ke Jeeves algorithm is written in MATLAB software. The Hooke and Jeeves algorithm incorporates the past history of a sequence of iterations into the generation of a new search direction. It combines exploratory moves with pattern moves. The exploratory moves examine the local behavior of the function & seek to locate the direc- tion of any stepping valleys that might be present. The pattern moves utilize the information generated in the exploration to step rapidly along the valleys. Exploratory Move: Given a specified step size which may be different for each coordinate direction and change during search. The exploration proceeds from an initial point by the speci- fied step size in each coordinate direction. If the function value does not increased the step is considered successful. Otherwise the step is retracted and replaced by a step in the opposite direction which in turn is retained in de- pending upon whether it success or fails. When all N coordinates have been investigated, the exploration move is completed. The resulting point is termed a base point. Pattern Move: A pattern move consists of a single step from the pre- sent base point along the line from the previous to the current base point. A new pattern point is calculated as: 11kkkk p xxxx where, 1k p x is temporary base point for a new ex- ploratory move. If the result of this exploration move is a better point 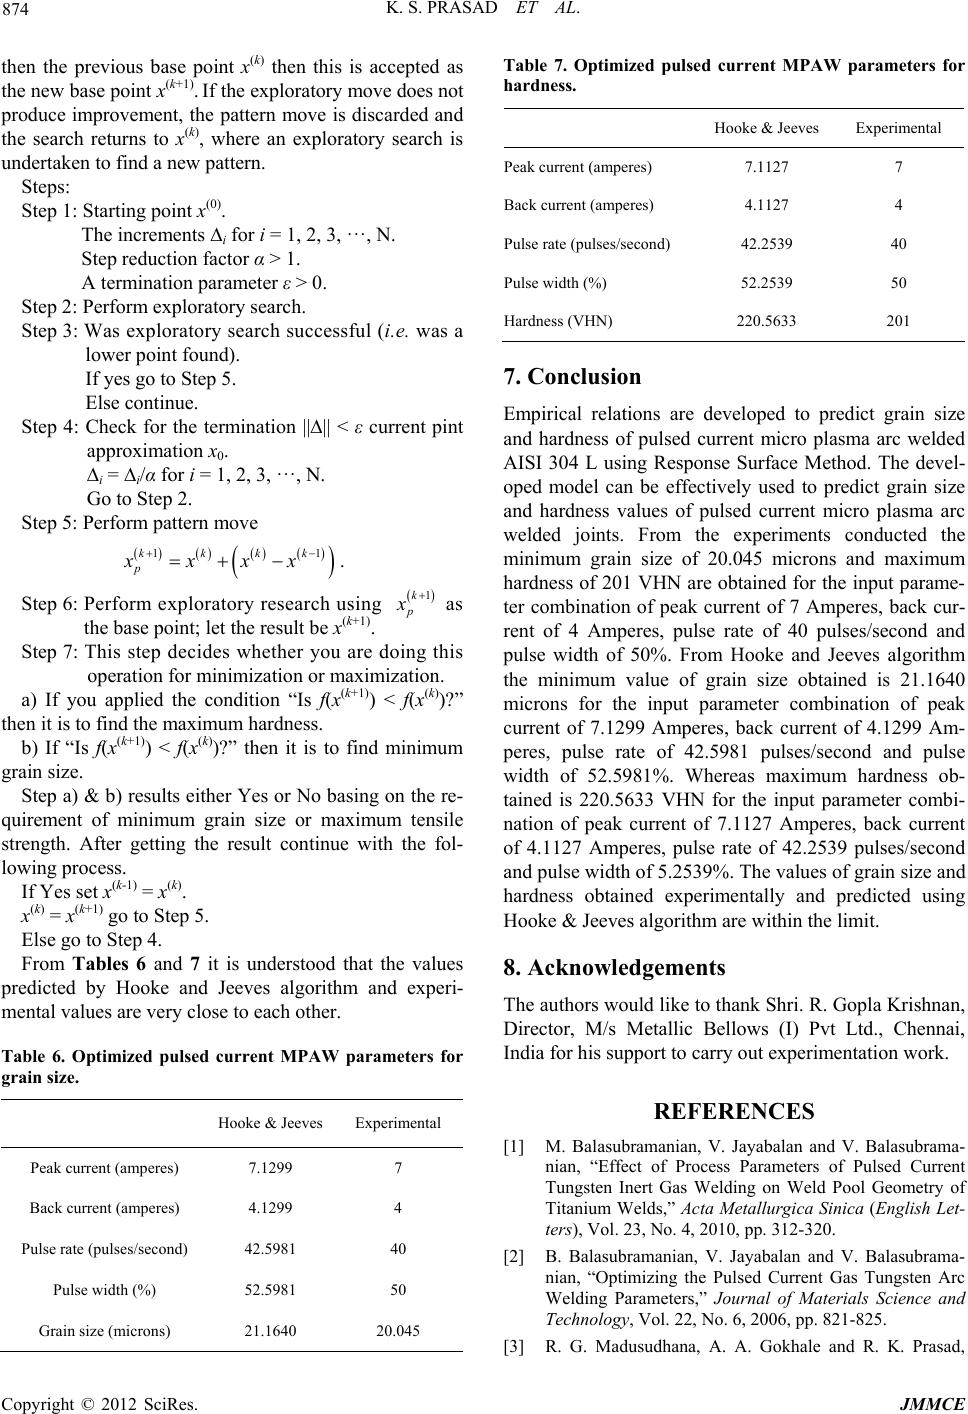 K. S. PRASAD ET AL. 874 then the previous base point x(k) then this is accepted as the new base point x(k+1). If the exploratory move does not produce improvement, the pattern move is discarded and the search returns to x(k), where an exploratory search is undertaken to find a new pattern. Steps: Step 1: Starting point x(0). The increments ∆i for i = 1, 2, 3, ···, N. Step reduction factor α > 1. A termination parameter ε > 0. Step 2: Perform exploratory search. Step 3: Was exploratory search successful (i.e. was a lower point found). If yes go to Step 5. Else continue. Step 4: Check for the termination ||∆|| < ε current pint approximation x0. ∆i = ∆i/α for i = 1, 2, 3, ···, N. Go to Step 2. Step 5: Perform pattern move 11kkkk p xxxx . Step 6: Perform exploratory research using 1k p x as the base point; let the result be x(k+1). Step 7: This step decides whether you are doing this operation for minimization or maximization. a) If you applied the condition “Is f(x(k+1)) < f(x(k))?” then it is to find the maximum hardness. b) If “Is f(x(k+1)) < f(x(k))?” then it is to find minimum grain size. Step a) & b) results either Yes or No basing on the re- quirement of minimum grain size or maximum tensile strength. After getting the result continue with the fol- lowing process. If Yes set x(k-1) = x(k). x(k) = x(k+1) go to Step 5. Else go to Step 4. From Tables 6 and 7 it is understood that the values predicted by Hooke and Jeeves algorithm and experi- mental values are very close to each other. Table 6. Optimized pulsed current MPAW parameters for grain size. Hooke & Jeeves Experimental Peak current (amperes) 7.1299 7 Back current (amperes) 4.1299 4 Pulse rate (pulses/second) 42.5981 40 Pulse width (%) 52.5981 50 Grain size (microns) 21.1640 20.045 Table 7. Optimized pulsed current MPAW parameters for hardness. Hooke & Jeeves Experimental Peak current (amperes) 7.1127 7 Back current (amperes) 4.1127 4 Pulse rate (pulses/second) 42.2539 40 Pulse width (%) 52.2539 50 Hardness (VHN) 220.5633 201 7. Conclusion Empirical relations are developed to predict grain size and hardness of pulsed current micro plasma arc welded AISI 304 L using Response Surface Method. The devel- oped model can be effectively used to predict grain size and hardness values of pulsed current micro plasma arc welded joints. From the experiments conducted the minimum grain size of 20.045 microns and maximum hardness of 201 VHN are obtained for the input parame- ter combination of peak current of 7 Amperes, back cur- rent of 4 Amperes, pulse rate of 40 pulses/second and pulse width of 50%. From Hooke and Jeeves algorithm the minimum value of grain size obtained is 21.1640 microns for the input parameter combination of peak current of 7.1299 Amperes, back current of 4.1299 Am- peres, pulse rate of 42.5981 pulses/second and pulse width of 52.5981%. Whereas maximum hardness ob- tained is 220.5633 VHN for the input parameter combi- nation of peak current of 7.1127 Amperes, back current of 4.1127 Amperes, pulse rate of 42.2539 pulses/second and pulse width of 5.2539%. The values of grain size and hardness obtained experimentally and predicted using Hooke & Jeeves algorithm are within the limit. 8. Acknowledgements The authors would like to thank Shri. R. Gopla Krishnan, Director, M/s Metallic Bellows (I) Pvt Ltd., Chennai, India for his support to carry out experimentation work. REFERENCES [1] M. Balasubramanian, V. Jayabalan and V. Balasubrama- nian, “Effect of Process Parameters of Pulsed Current Tungsten Inert Gas Welding on Weld Pool Geometry of Titanium Welds,” Acta Metallurgica Sinica (English Let- ters), Vol. 23, No. 4, 2010, pp. 312-320. [2] B. Balasubramanian, V. Jayabalan and V. Balasubrama- nian, “Optimizing the Pulsed Current Gas Tungsten Arc Welding Parameters,” Journal of Materials Science and Technology, Vol. 22, No. 6, 2006, pp. 821-825. [3] R. G. Madusudhana, A. A. Gokhale and R. K. Prasad, Copyright © 2012 SciRes. JMMCE 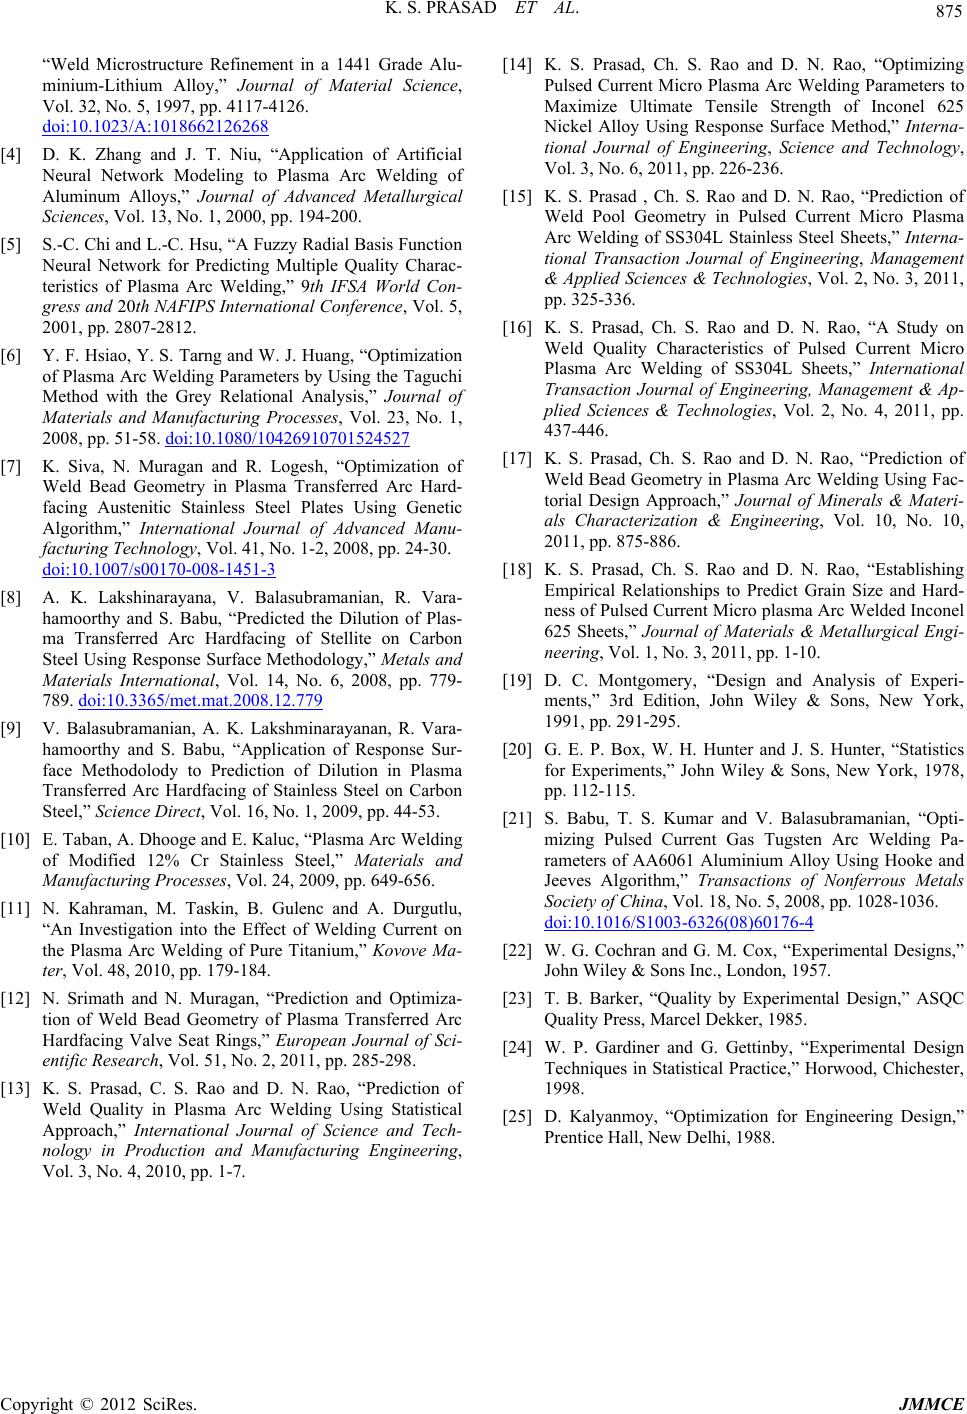 K. S. PRASAD ET AL. Copyright © 2012 SciRes. JMMCE 875 “Weld Microstructure Refinement in a 1441 Grade Alu- minium-Lithium Alloy,” Journal of Material Science, Vol. 32, No. 5, 1997, pp. 4117-4126. doi:10.1023/A:1018662126268 [4] D. K. Zhang and J. T. Niu, “Application of Artificial Neural Network Modeling to Plasma Arc Welding of Aluminum Alloys,” Journal of Advanced Metallurgical Sciences, Vol. 13, No. 1, 2000, pp. 194-200. [5] S.-C. Chi and L.-C. Hsu, “A Fuzzy Radial Basis Function Neural Network for Predicting Multiple Quality Charac- teristics of Plasma Arc Welding,” 9th IFSA World Con- gress and 20th NAFIPS International Conference, Vol. 5, 2001, pp. 2807-2812. [6] Y. F. Hsiao, Y. S. Tarng and W. J. Huang, “Optimization of Plasma Arc Welding Parameters by Using the Taguchi Method with the Grey Relational Analysis,” Journal of Materials and Manufacturing Processes, Vol. 23, No. 1, 2008, pp. 51-58. doi:10.1080/10426910701524527 [7] K. Siva, N. Muragan and R. Logesh, “Optimization of Weld Bead Geometry in Plasma Transferred Arc Hard- facing Austenitic Stainless Steel Plates Using Genetic Algorithm,” International Journal of Advanced Manu- facturing Technology, Vol. 41, No. 1-2, 2008, pp. 24-30. doi:10.1007/s00170-008-1451-3 [8] A. K. Lakshinarayana, V. Balasubramanian, R. Vara- hamoorthy and S. Babu, “Predicted the Dilution of Plas- ma Transferred Arc Hardfacing of Stellite on Carbon Steel Using Response Surface Methodology,” Metals and Materials International, Vol. 14, No. 6, 2008, pp. 779- 789. doi:10.3365/met.mat.2008.12.779 [9] V. Balasubramanian, A. K. Lakshminarayanan, R. Vara- hamoorthy and S. Babu, “Application of Response Sur- face Methodolody to Prediction of Dilution in Plasma Transferred Arc Hardfacing of Stainless Steel on Carbon Steel,” Science Direct, Vol. 16, No. 1, 2009, pp. 44-53. [10] E. Taban, A. Dhooge and E. Kaluc, “Plasma Arc Welding of Modified 12% Cr Stainless Steel,” Materials and Manufacturing Processes, Vol. 24, 2009, pp. 649-656. [11] N. Kahraman, M. Taskin, B. Gulenc and A. Durgutlu, “An Investigation into the Effect of Welding Current on the Plasma Arc Welding of Pure Titanium,” Kovove Ma- ter, Vol. 48, 2010, pp. 179-184. [12] N. Srimath and N. Muragan, “Prediction and Optimiza- tion of Weld Bead Geometry of Plasma Transferred Arc Hardfacing Valve Seat Rings,” European Journal of Sci- entific Research, Vol. 51, No. 2, 2011, pp. 285-298. [13] K. S. Prasad, C. S. Rao and D. N. Rao, “Prediction of Weld Quality in Plasma Arc Welding Using Statistical Approach,” International Journal of Science and Tech- nology in Production and Manufacturing Engineering, Vol. 3, No. 4, 2010, pp. 1-7. [14] K. S. Prasad, Ch. S. Rao and D. N. Rao, “Optimizing Pulsed Current Micro Plasma Arc Welding Parameters to Maximize Ultimate Tensile Strength of Inconel 625 Nickel Alloy Using Response Surface Method,” Interna- tional Journal of Engineering, Science and Technology, Vol. 3, No. 6, 2011, pp. 226-236. [15] K. S. Prasad , Ch. S. Rao and D. N. Rao, “Prediction of Weld Pool Geometry in Pulsed Current Micro Plasma Arc Welding of SS304L Stainless Steel Sheets,” Interna- tional Transaction Journal of Engineering, Management & Applied Sciences & Technologies, Vol. 2, No. 3, 2011, pp. 325-336. [16] K. S. Prasad, Ch. S. Rao and D. N. Rao, “A Study on Weld Quality Characteristics of Pulsed Current Micro Plasma Arc Welding of SS304L Sheets,” International Transaction Journal of Engineering, Management & Ap- plied Sciences & Technologies, Vol. 2, No. 4, 2011, pp. 437-446. [17] K. S. Prasad, Ch. S. Rao and D. N. Rao, “Prediction of Weld Bead Geometry in Plasma Arc Welding Using Fac- torial Design Approach,” Journal of Minerals & Materi- als Characterization & Engineering, Vol. 10, No. 10, 2011, pp. 875-886. [18] K. S. Prasad, Ch. S. Rao and D. N. Rao, “Establishing Empirical Relationships to Predict Grain Size and Hard- ness of Pulsed Current Micro plasma Arc Welded Inconel 625 Sheets,” Journal of Materials & Metallurgical Engi- neering, Vol. 1, No. 3, 2011, pp. 1-10. [19] D. C. Montgomery, “Design and Analysis of Experi- ments,” 3rd Edition, John Wiley & Sons, New York, 1991, pp. 291-295. [20] G. E. P. Box, W. H. Hunter and J. S. Hunter, “Statistics for Experiments,” John Wiley & Sons, New York, 1978, pp. 112-115. [21] S. Babu, T. S. Kumar and V. Balasubramanian, “Opti- mizing Pulsed Current Gas Tugsten Arc Welding Pa- rameters of AA6061 Aluminium Alloy Using Hooke and Jeeves Algorithm,” Transactions of Nonferrous Metals Society of China, Vol. 18, No. 5, 2008, pp. 1028-1036. doi:10.1016/S1003-6326(08)60176-4 [22] W. G. Cochran and G. M. Cox, “Experimental Designs,” John Wiley & Sons Inc., London, 1957. [23] T. B. Barker, “Quality by Experimental Design,” ASQC Quality Press, Marcel Dekker, 1985. [24] W. P. Gardiner and G. Gettinby, “Experimental Design Techniques in Statistical Practice,” Horwood, Chichester, 1998. [25] D. Kalyanmoy, “Optimization for Engineering Design,” Prentice Hall, New Delhi, 1988. |