

Paper Menu >>
Journal Menu >>
 Advances in Microbiology, 2012, 2, 358-363 http://dx.doi.org/10.4236/aim.2012.23044 Published Online September 2012 (http://www.SciRP.org/journal/aim) Acid Tolerance of Lactobacillus acidophilus LA-K as Influenced by Various Pulsed Electric Field Conditions Olga Cueva1, Kayanush J. Aryana1,2 1School of Animal Sciences, Louisiana State University Agricultural Center, Baton Rouge, USA 2Department of Food Science, Louisiana State University Agricultural Center, Baton Rouge, USA Email: [email protected] Received June 29, 2012; revised July 29, 2012; accepted August 10, 2012 ABSTRACT Pulsed electric field (PEF) processing involves the application of pulses of voltage for less than one second to fluid foods placed between two electrodes. Lactobacillus acidophilus is an important probiotic bacterium used for the pro- duction of fermented dairy products. Acid tolerance is an important probiotic characteristic. The influence of PEF on acid tolerance of Lactobacillus acidophilus is not known. Objective of this study was to elucidate the influence of cer- tain PEF conditions on the acid to lerance of Lactobacillu s acidophilus LA-K. Freshly thawed Lactobacillus acidophilus LA-K was suspended in sterile peptone 0.1% w/v distilled water and treated in a pilot plant PEF system. The treatments were pulse width (3, 6 and 9 µs), pulse period (10,000; 20,000 and 30,000 µs) and voltage (5, 15 and 25 kV/cm). Con- trol was run through PEF system at 60 mL/min without receiving any pulsed electric field condition. Data were ana- lyzed using the PROC GLM of the Statistical Analysis Systems (SAS). Differences of least square means were used to determine significant differences at P < 0.05. The control and the three different bipolar pulse widths studied were sig- nificantly different from each other. The acid tolerance of the control was significantly the highest, followed by the acid tolerance of the culture subjected to 3 µs and 6 µs. The acid tolerance of culture subjected to 9 µs was the lowest. The acid tolerance of the contro l was significantly the highest, followed by the acid tolerances subjected to the pulse period of 30,000 and 20,000 µs. The acid tolerance of culture subjected to pulse period 10,000 µs was significan tly the lowest. The acid tolerance of the control was significantly the highest followed by the acid tolerances of culture subjected to electric field strength of 5 and 15 kV/cm. The acid tolerance of culture subjected to 25 kV/cm was significantly the lowest. Acid tolerance of Lactobacillus acidophilus LA-K lowered by increasing pulse widths and voltages but lower- ing puls e pe riods. Keywords: Lactobacillus acidophilus; Pulsed Electric Field; Probiotic 1. Introduction This High intensity pulsed electric field (PEF) processing involves the application of pulses of high voltage (typi- cally 20 - 80 kV/cm) for short time periods (less than 1 second) to fluid foods places between two electrodes [1]. Application of PEF is restricted to foods products that can withstand high electric fields, have low electrical conductivity, and do not contain or form bubbles (e.g., liquid foods as milk or fruit juices) [2]. PEF technology is considered better than heat treatment of foods because it achieves high microbial inactivation, avoids or greatly reduces detrimental changes in the sensory and physical properties of food, and inactivates some enzymes [3]. Pulsed electric field is more energy efficient than thermal pasteurization. This nonthermal technology would add only $0.03 - $0.07 to final food costs [4]. Several theo- ries have been proposed to explain microbial inactivation by PEF. The most commonly accepted theory is electro- poration, which is the phenomenon in which the lipid bilayer and proteins of cell membrane exposed to high intensity electric field pulses are temporarily destabilized [5]. Lactobacillus acidophilus is a bacterium with several health benefits, including enhancement of immune sys- tem, reduction of various types of diarrhea in humans, alleviation of Crohn’s disease, lower cholesterol, im- prove symptoms of lactose intolerance, and balancing of intestinal microflora through the growth modulation of bacteria present in the gastrointestinal tract [6]. Lactoba- cillus acidophilus is used extensively for the production of fermented dairy products and is increasingly applied in the area of health improvement, as probiotics, in the form of yogurts and dietary supp lements. Several PEF process factors namely electric field strength, pulse waveshape, treatment time and treatment temperature influence microbial inactivation [7]. Influ- C opyright © 2012 SciRes. AiM 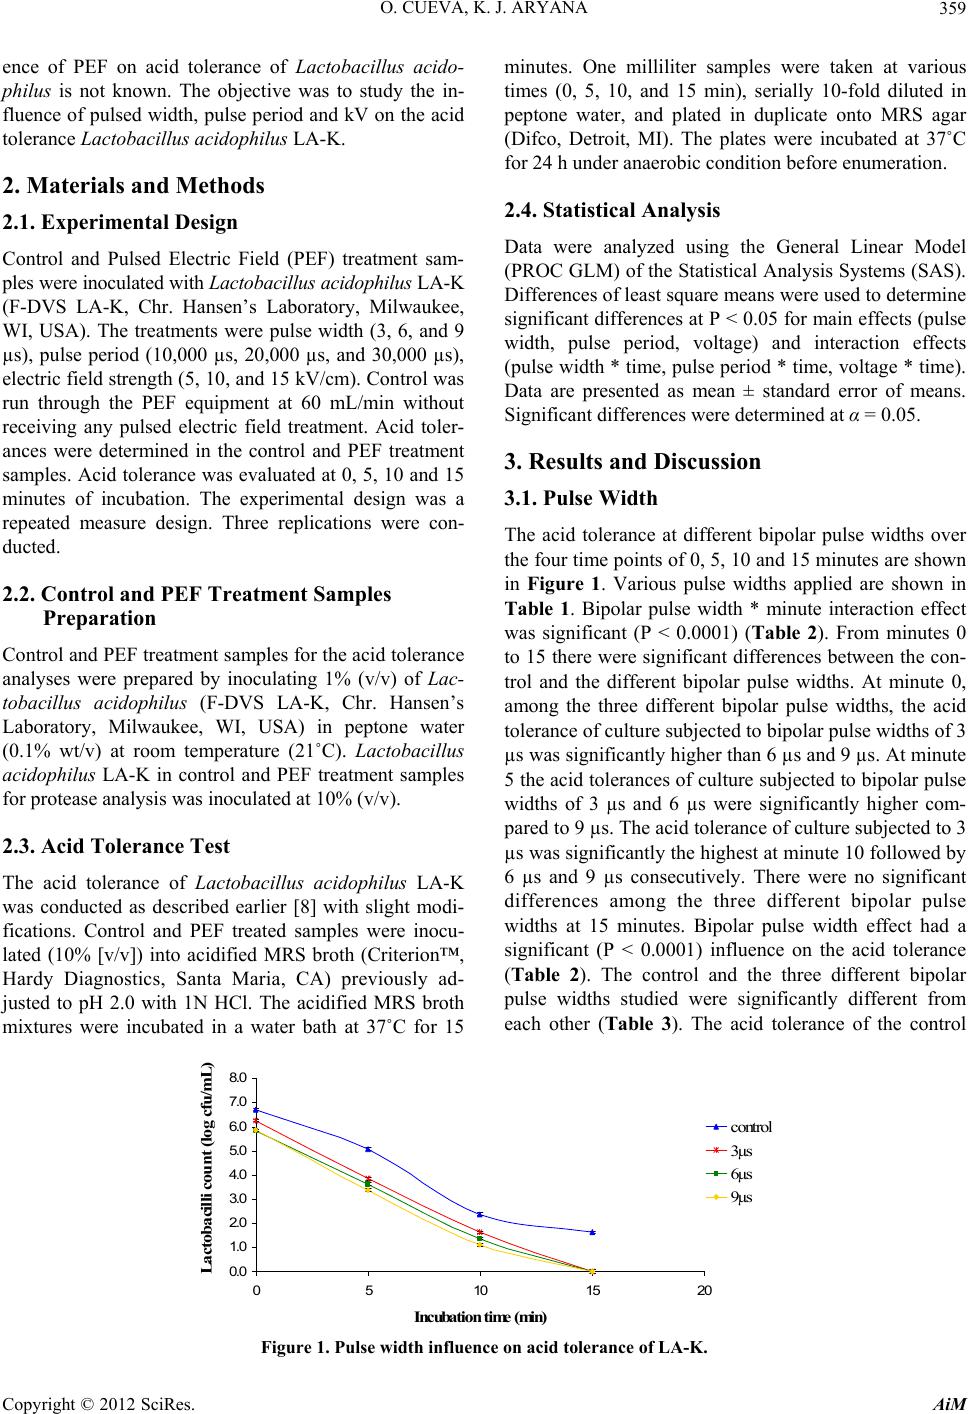 O. CUEVA, K. J. ARYANA 359 ence of PEF on acid tolerance of Lactobacillus acido- philus is not known. The objective was to study the in- fluence of pulsed width, pulse period and kV on the acid tolerance Lactobacillus acidophilus LA-K. 2. Materials and Methods 2.1. Experimental Design Control and Pulsed Electric Field (PEF) treatment sam- ples were inoculated with Lactobacillus acidophilus LA-K (F-DVS LA-K, Chr. Hansen’s Laboratory, Milwaukee, WI, USA). The treatments were pulse width (3, 6, and 9 µs), pulse period (10,000 µs, 20,000 µs, and 30,000 µs), electric field strength (5 , 10, and 15 kV /cm). Control was run through the PEF equipment at 60 mL/min without receiving any pulsed electric field treatment. Acid toler- ances were determined in the control and PEF treatment samples. Acid tolerance was evaluated at 0, 5, 10 and 15 minutes of incubation. The experimental design was a repeated measure design. Three replications were con- ducted. 2.2. Control and PEF Treatment Samples Preparation Control and PEF treatment samples for the acid to lerance analyses were prepared by inoculating 1% (v/v) of Lac- tobacillus acidophilus (F-DVS LA-K, Chr. Hansen’s Laboratory, Milwaukee, WI, USA) in peptone water (0.1% wt/v) at room temperature (21˚C). Lactobacillus acidophilus LA-K in control and PEF treatment samples for protease analysis was inoc ulated at 10% (v/v). 2.3. Acid Tolerance Test The acid tolerance of Lactobacillus acidophilus LA-K was conducted as described earlier [8] with slight modi- fications. Control and PEF treated samples were inocu- lated (10% [v/v]) into acidified MRS broth (Criterion™, Hardy Diagnostics, Santa Maria, CA) previously ad- justed to pH 2.0 with 1N HCl. The acidified MRS broth mixtures were incubated in a water bath at 37˚C for 15 minutes. One milliliter samples were taken at various times (0, 5, 10, and 15 min), serially 10-fold diluted in peptone water, and plated in duplicate onto MRS agar (Difco, Detroit, MI). The plates were incubated at 37˚C for 24 h under anaerobic condition before enumeration. 2.4. Statistical Analysis Data were analyzed using the General Linear Model (PROC GLM) of the Statistical Analysis Systems (SAS). Differences of least square means were used to determine significant differences at P < 0.05 for main effects (pulse width, pulse period, voltage) and interaction effects (pulse width * time, pulse period * time, voltage * time). Data are presented as mean ± standard error of means. Significant differences were determined at α = 0.05. 3. Results and Discussion 3.1. Pulse Width The acid tolerance at different bipolar pulse widths over the four time points of 0, 5, 10 and 15 minutes are shown in Figure 1. Various pulse widths applied are shown in Table 1. Bipolar pulse width * minute interaction effect was significant (P < 0.0001) (Table 2). From minutes 0 to 15 there were significant differences between th e con- trol and the different bipolar pulse widths. At minute 0, among the three different bipolar pulse widths, the acid tolerance of culture subjected to b ipolar pulse widths of 3 µs was significantly higher than 6 µs and 9 µs. At minute 5 the acid tolerances of culture subjected to bipolar pulse widths of 3 µs and 6 µs were significantly higher com- pared to 9 µs. The acid tolerance of culture subjected to 3 µs was significantly the highest at minu te 10 followed by 6 µs and 9 µs consecutively. There were no significant differences among the three different bipolar pulse widths at 15 minutes. Bipolar pulse width effect had a significant (P < 0.0001) influence on the acid tolerance (Table 2). The control and the three different bipolar pulse widths studied were significantly different from each other (Table 3). The acid tolerance of the control 0.0 1.0 2.0 3.0 4.0 5.0 6.0 7.0 8.0 051015 20 In cuba tion time control 3µs 6µs 9µs Lac tobac illi count ( log cf u/mL) ( min ) Figure 1. Pulse width influenc e on acid tolerance of LA-K. Copyright © 2012 SciRes. AiM 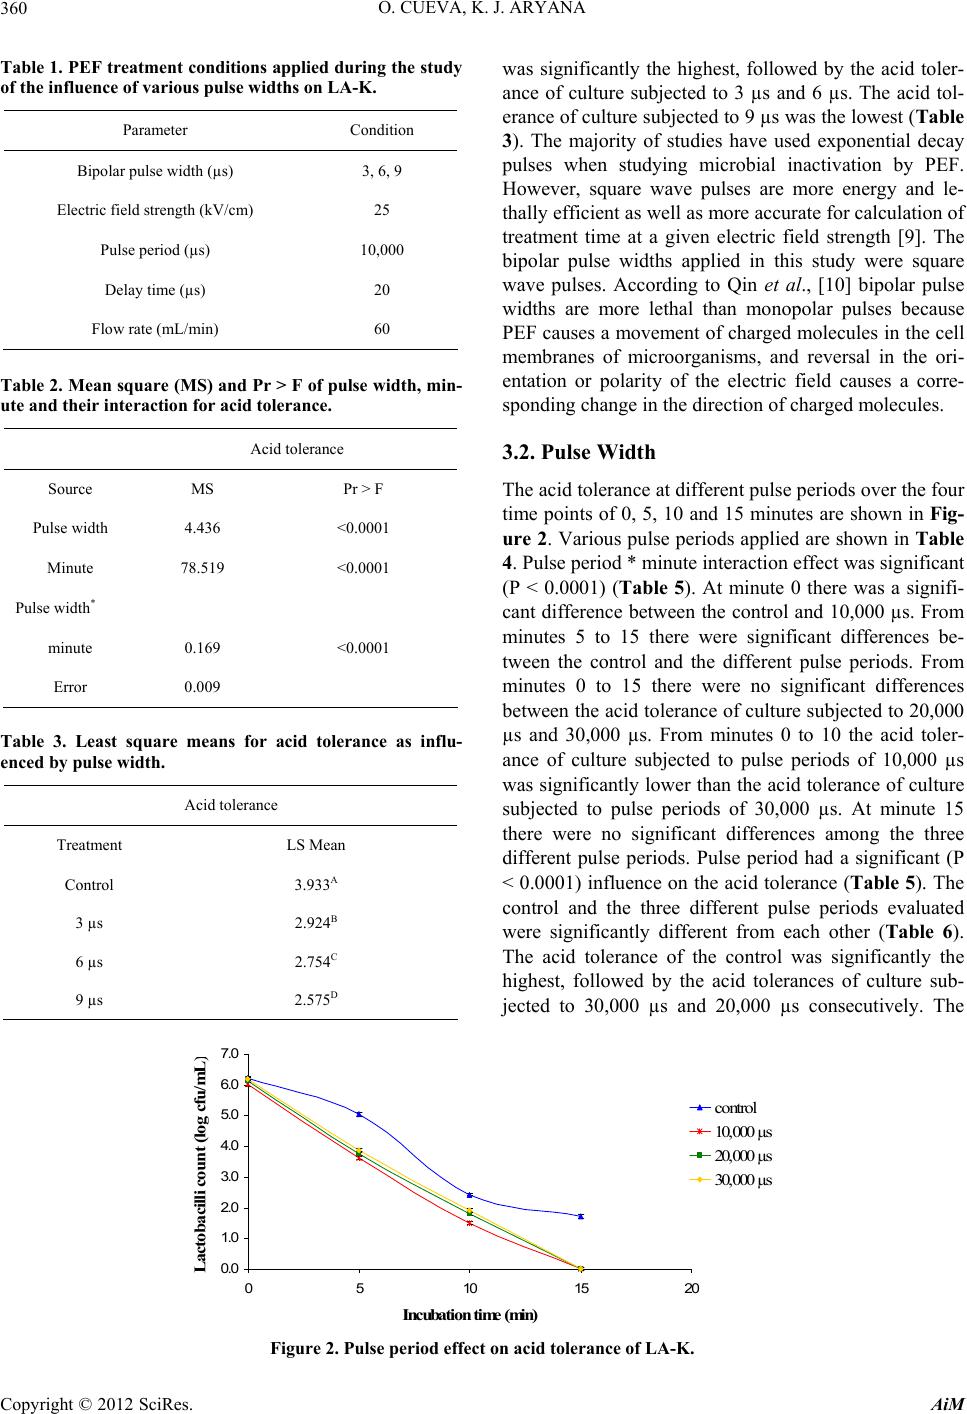 O. CUEVA, K. J. ARYANA 360 Table 1. PEF treatment co nditions applied during the study of the influence of various pulse widths on LA-K. Parameter Condition Bipolar pulse width (µs) 3, 6, 9 Electric field strength (kV/cm) 25 Pulse period (µs) 10,000 Delay time (µs) 20 Flow rate (mL/min) 60 Table 2. Mean square (MS) and Pr > F of pulse width, min- ute and their interaction for acid tolerance. Acid tolerance Source MS Pr > F Pulse width 4.436 <0.0001 Minute 78.519 <0.0001 Pulse width* minute 0.169 <0.0001 Error 0.009 Table 3. Least square means for acid tolerance as influ- enced by pulse width. Acid tolerance Treatment LS Mean Control 3.933A 3 µs 2.924B 6 µs 2.754C 9 µs 2.575D was significantly the highest, followed by the acid toler- ance of culture subjected to 3 µs and 6 µs. The acid tol- erance of culture subjected to 9 µs was the lowest (Table 3). The majority of studies have used exponential decay pulses when studying microbial inactivation by PEF. However, square wave pulses are more energy and le- thally efficient as well as more accurate for calculation of treatment time at a given electric field strength [9]. The bipolar pulse widths applied in this study were square wave pulses. According to Qin et al., [10] bipolar pulse widths are more lethal than monopolar pulses because PEF causes a movement of charged molecules in the cell membranes of microorganisms, and reversal in the ori- entation or polarity of the electric field causes a corre- sponding change in the direction of charged molecules. 3.2. Pulse Width The acid tolerance at different pulse periods over the four time points of 0, 5, 10 and 15 minutes are shown in Fig- ure 2. Various pulse periods applied are shown in Table 4. Pulse period * minute interaction effect was significant (P < 0.0001) (Table 5). At minute 0 there was a signifi- cant difference between the control and 10,000 µs. From minutes 5 to 15 there were significant differences be- tween the control and the different pulse periods. From minutes 0 to 15 there were no significant differences between the acid to lerance of culture subjected to 20,000 µs and 30,000 µs. From minutes 0 to 10 the acid toler- ance of culture subjected to pulse periods of 10,000 µs was significantly lower than the acid tolerance of culture subjected to pulse periods of 30,000 µs. At minute 15 there were no significant differences among the three different pulse periods. Pulse period had a significant (P < 0.0001) influence on the acid tolerance (Table 5). The control and the three different pulse periods evaluated were significantly different from each other (Table 6). The acid tolerance of the control was significantly the highest, followed by the acid tolerances of culture sub- jected to 30,000 µs and 20,000 µs consecutively. The 0.0 1.0 2.0 3.0 4.0 5.0 6.0 7.0 05101520 In cu ba tion time (min ) control 10,000 µs 20,000 µs 30,000 µs Lactob acilli count ( l og cfu/ mL ) Figure 2. Pulse period effect on acid tolerance of LA-K. Copyright © 2012 SciRes. AiM 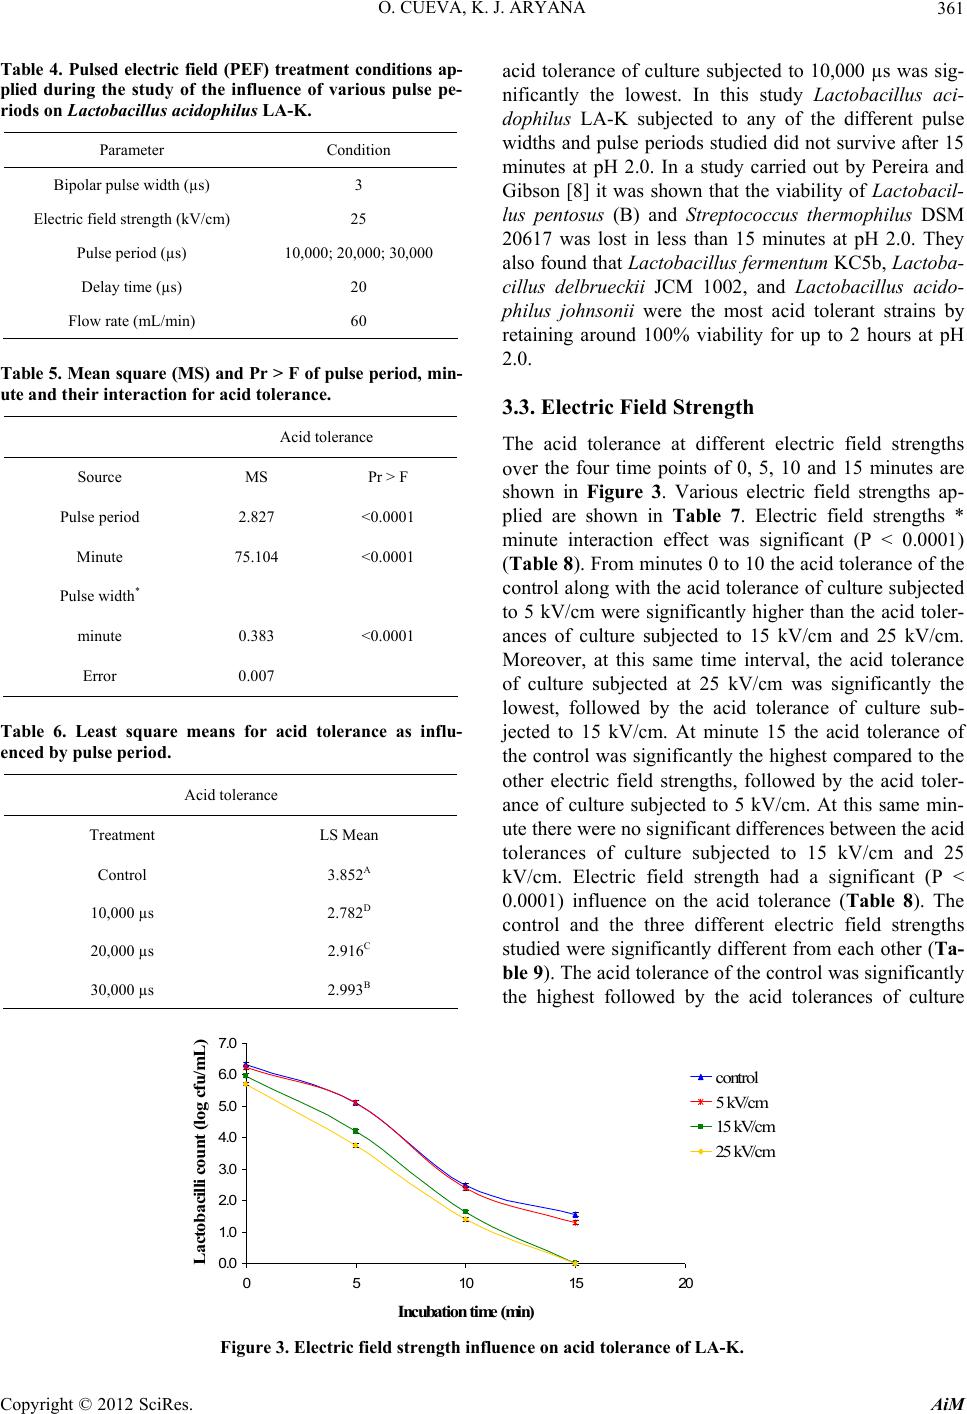 O. CUEVA, K. J. ARYANA 361 able 4. Pulsed electric field (PEF Parameter Condition T) treatment conditions ap- plied during the study of the influence of various pulse pe- riods on Lactobacillus acidophilus LA-K. Bipolarµs) pulse width (3 Electri) 2 10,000; 200,000 Flow r) c field strength (kV/cm5 Pulse period (µs) ,000; 3 Delay time (µs) 20 ate (mL/min60 able 5. Mean square (MS) and Pr > F of pulse period, min- Acid tolerance T ute and their interaction for acid tolerance. Source MS Pr > F Pulse period 2.827 <0.0001 Minute 75.104 <0.0001 Pulse width* minute 0.383 <0.0001 Error 0.007 able 6. Least square means for acid tolerance as influ- Acid tolerance T enced by pulse period. Treatment LS Mean Control 3.852 10,000 µs 2.782D 20,000 µs 2.916C 30,000 µs 2.993B A acid tolerance of culture subjected to 10,000 µs was sig- 3.3. Electric Field Strength electric field strengths nificantly the lowest. In this study Lactobacillus aci- dophilus LA-K subjected to any of the different pulse widths and pulse periods studied did not survive after 15 minutes at pH 2.0. In a study carried out by Pereira and Gibson [8] it was shown that the viability of Lactobacil- lus pentosus (B) and Streptococcus thermophilus DSM 20617 was lost in less than 15 minutes at pH 2.0. They also found that Lactobacillus fermentum KC5b, Lactoba- cillus delbrueckii JCM 1002, and Lactobacillus acido- philus johnsonii were the most acid tolerant strains by retaining around 100% viability for up to 2 hours at pH 2.0. The acid tolerance at different over the four time points of 0, 5, 10 and 15 minutes are shown in Figure 3. Various electric field strengths ap- plied are shown in Table 7. Electric field strengths * minute interaction effect was significant (P < 0.0001) (Table 8). From minutes 0 to 10 the acid tolerance of the control along with the acid tolerance of culture subjected to 5 kV/cm were significantly higher than the acid toler- ances of culture subjected to 15 kV/cm and 25 kV/cm. Moreover, at this same time interval, the acid tolerance of culture subjected at 25 kV/cm was significantly the lowest, followed by the acid tolerance of culture sub- jected to 15 kV/cm. At minute 15 the acid tolerance of the control was significantly the highest compared to the other electric field strengths, followed by the acid toler- ance of culture subjected to 5 kV/cm. At this same min- ute there were no significant differences between the acid tolerances of culture subjected to 15 kV/cm and 25 kV/cm. Electric field strength had a significant (P < 0.0001) influence on the acid tolerance (Table 8). The control and the three different electric field strengths studied were significantly different from each other (Ta- ble 9). The acid tolerance of the control was significantly the highest followed by the acid tolerances of culture 0.0 1.0 2.0 3.0 4.0 5.0 6.0 7.0 0510 15 20 Incubation time (min ) control 5 kV /cm 15 kV /cm 25 kV /cm Lactobacilli count (log cf u/m L ) Figure 3. Electric field strength influence on acid tolerance of LA-K. Copyright © 2012 SciRes. AiM  O. CUEVA, K. J. ARYANA 362 able 7. Pulsed electric fie Parameter Condition Tld (PEF) treatment conditions applied during the study of the influence of various electric field strengths on Lactobacillus acidophilus LA-K. Bipolar pulse width (µs) 3 Electric field strength (kV/cm) 5, 15, 25 in) Pulse period (µs) 30,000 Delay time (µs) 20 Flow rate (mL /m60 able 8. Mean square (MS) and Pr > F of electric field Acid tolerance T strength, minute and their interaction for acid tolerance. Source MS Pr > F Electric field strength 3.981 <0.0001 Minute 70.209 <0.0001 Electric field strength* minute 0.198 <0.0001 Error 0.012 able 9. Least square means for acid tolerance as in Acid tolerance T flu- enced by voltage. Treatment LS Mean Control 3.871 5 kV/cm 3.756B 15 kV/cm 2.952C 25 kV/cm 2.716D A bjected to 5 kV/cm. The acid tolerance of culture sub- ycles, compared with 3.16 h and pulse period significantly low- . Voltage significantly influenced acid REFERENCES [1] G. V. Barbosgora Nieto, U. R. Pothakamury servation of Foods nson, “Transmission Electron Microscopy of Lis- su jected to 25 kV/cm was the lowest followed by the acid tolerance of culture subjected to 15 kV/cm. Different lactobacilli strains were studied for their ability to grow on MRS broth at pH 2.0 [11]. In this study it was found that L. acidophilus ATCC 4962, L. casei ASCC 290 and L. casei ASCC 292 were the most acid tolerant strains with more than 107 cfu/mL after incubation for 2 hours at pH 2.0, while L. casei ASCC 1520, L. casei ASCC 15 21, L. casei ASCC 279, L. casei 15820 and L. casei CSCC 2607 were the least acid tolerant with only 104 total cfu/mL after the 2 hours of incubation. They also found that strains of L. acidophilus showed greater acid toler- ance over the entire incubation period, and their counts and 6.20 log cycles for L. case i. decreased by 2.66 to 4.38 log c 4. Conclusion Bipolar pulse widt ered acid tolerance tolerance. Acid tolerance of the control LA-K was sig- nificantly higher than the acid tolerance of LA-K sub- jected to any of the three voltages studied. The highest the voltage applied resulted in the lowest the acid toler- ance of LA-K. Acid tolerance of LA-K lowered by in- creasing pulse widths and voltages but lowering pulse periods. a-Cánovas, M. M. Gón and B. G. Swanson, “Pre with Pulsed Electric Fields,” Academic Press, San Diego, 1999. [2] M. L. Calderon-Miranda, G. V. Barbosa-Cánovas and B. G. Swa teria innocua Treated by Pulsed Electric Fields and Nisin in Skimmed Milk,” International Journal of Food Micro- biology, Vol. 51, No. 1, 1999, pp. 31-38. doi:10.1016/S0168-1605(99)00071-9 [3] D. W. Quass, “Pulsed Electric Field Pr Food Industry,” A Status Report on PEocessing in the F. Palo Alto, Elec- Sheet for demic n Health,” Journal of Nutrition, Using a Pulsed tric Power Research Institute, Palo Alto, 1997. [4] R. Ramaswamy, T. Jin, V. M. Balasubramaniam and H. Zhang, “Pulsed Electric Field Processing. Fact Food Processors,” Department of Food Science and Tech- nology, The Ohio State University, Extension Service. 2008. http://ohioline.osu.edu/fse-fact/pdf/0002.pdf [5] D. C . C hang, B . M. Chas sy, J. A . Saunde r s and A . E. So wer s , “Guide to Electroporation and Electrofusion,” Aca Press, San Diego, 1992. [6] M. E. Sanders, “Considerations for Use of Probiotic bac- teria to Modulate Huma Vol. 130, No. 2, 2000, pp. 384S-390S. [7] B. L. Qin, G. V. Barbosa-Cánovas, B. G. Swanson and P. D. Pedrow, “Inactivating Microorganism Electric Field Continuous Treatment System,” IEEE Tran- sactions on Industry Applications, Vol. 34, No. 1, 1998, pp. 43-49. doi:10.1109/28.658715 [8] D. I. A. Pereira and G. R. Gibson, “Cholesterol Assimila- tion by Lactic Acid Bacteria and Bifidobacteria Isolated from the Human Gut,” Applied and Environmental Mi- crobiology, Vol. 68, No. 9, 2002, pp. 4689-4693. doi:10.1128/AEM.68.9.4689-4693.2002 [9] P. C. Wouters, I. Alvarez and J. Raso, “Critical F Determining Inactivation Kinetics by Pulsactors ed Electric Food Processing,” Trends in Food Science and Technology, Vol. 12, No. 3-4, 2001, pp. 112-121. doi:10.1016/S0924-2244(01)00067-X [10] B. L. Qin, Q. Zhang and G. V. Barbosa-Cánovas, “Inac- Copyright © 2012 SciRes. AiM  O. CUEVA, K. J. ARYANA 363 tivation of Microorganisms by Pulsed Electric Fields of Different Voltage Waveforms,” IEEE Transactions on Die- lectrics and Electrical Insulation, Vol. 6, No. 1, 1994, pp. 1047-1057. doi:10.1109/94.368658 [11] M. T. Liong and N. P. Shah, “Acid and Bile Tolerance and Cholesterol Removal Ability of Lactobacilli strains,” Journal of Dairy Science, Vol. 88, No. 1, 2005, pp. 55-56. doi:10.3168/jds.S0022-0302(05)72662-X Copyright © 2012 SciRes. AiM |