

Paper Menu >>
Journal Menu >>
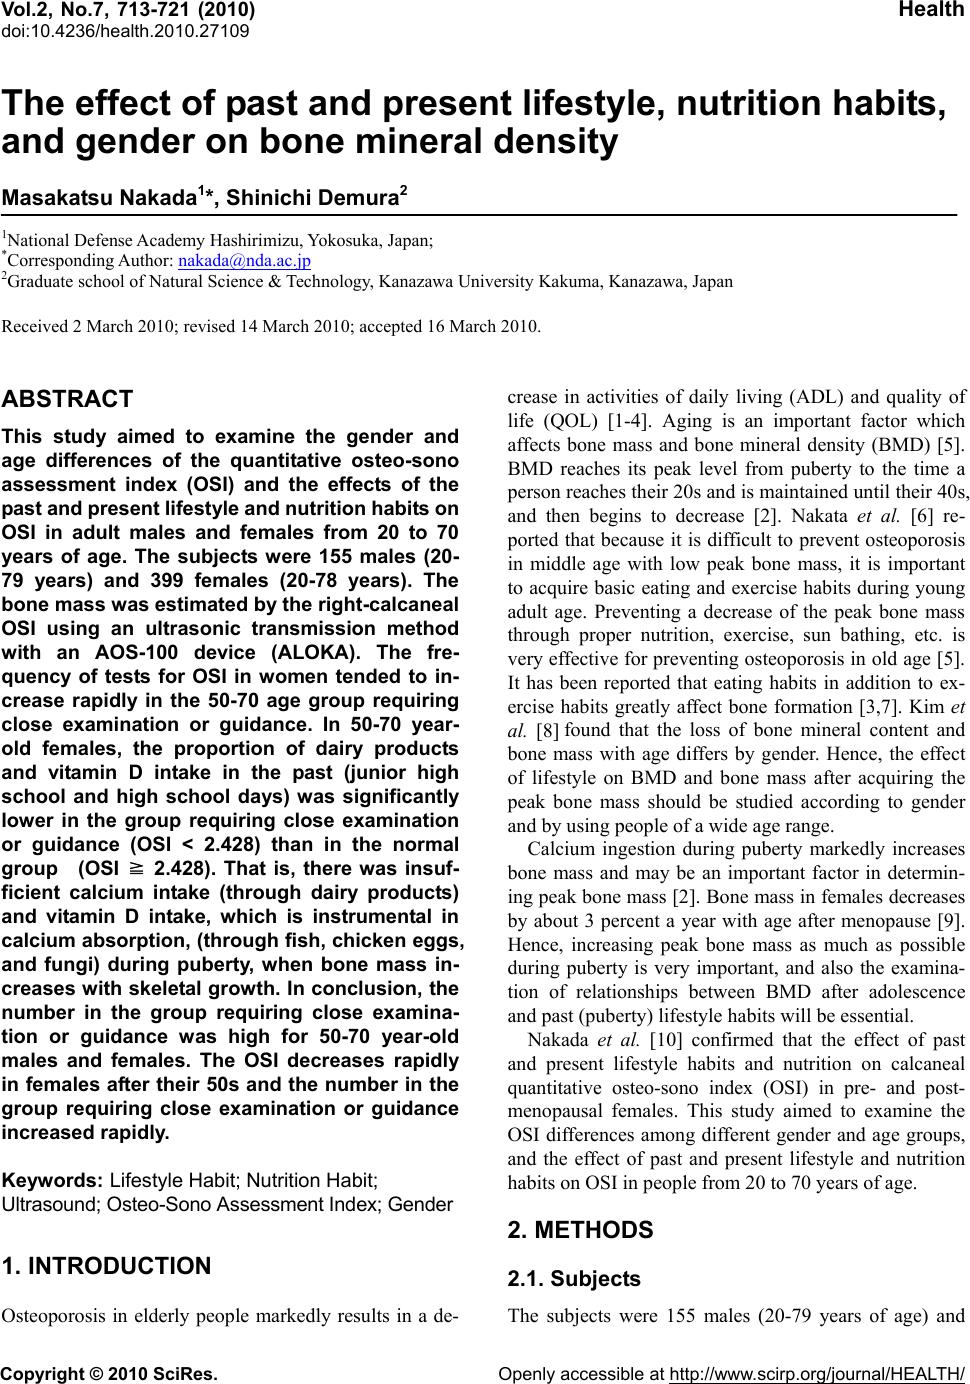 Vol.2, No.7, 713-721 (2010)h doi:10.4236/health.2010.27109 Copyright © 2010 SciRes. Openly accessible at http://www.scirp.org/jo urna l/HEALTH/ Healt The effect of past and present lifestyle, nutrition habits, and gender on bone mineral density Masakatsu Nakada1*, Shinichi Demura2 1National Defense Academy Hashirimizu, Yokosuka, Japan; *Corresponding Author: [email protected] 2Graduate school of Natural Science & Technology, Kanazawa University Kakuma, Kanazawa, Japan Received 2 March 2010; revised 14 March 2010; accepted 16 March 2010. ABSTRACT This study aimed to examine the gender and age differences of the quantitative osteo-sono assessment index (OSI) and the effects of the p ast and present lifesty le and nutrition habit s on OSI in adult males and females from 20 to 70 years of age. The subjects were 155 males (20- 79 years) and 399 females (20-78 years). The bone mass was estimated by the right-calcaneal OSI using an ultrasonic transmission method with an AOS-100 device (ALOKA). The fre- quency of tests for OSI in women tended to in- crease rapidly in the 50-70 age group requiring close examination or guidance. In 50-70 year- old females, the proportion of dairy products and vitamin D intake in the past (junior high school and high school days) was significantly lower in the group requiring close examination or guidance (OSI < 2.428) than in the normal group (OSI ≧ 2.428). That is, there was insuf- ficient calcium intake (through dairy products) and vitamin D intake, which is instrumental in calcium absorption, (through fish, chicken eggs, and fungi) during puberty, when bone mass in- creases with skeletal growth. In conclusion, the number in the group requiring close examina- tion or guidance was high for 50-70 year-old males and females. The OSI decreases rapidly in females after their 50s and the number in the group requiring close examination or guidance increased rapidly. Keywords: Lifestyle Habit; Nutrition Habit; Ultrasound; Osteo-Sono Assessment Index; Gender 1. INTRODUCTION Osteoporosis in elderly people markedly results in a de- crease in activities of daily living (ADL) and quality of life (QOL) [1-4]. Aging is an important factor which affects bone mass and bone mineral density (BMD) [5]. BMD reaches its peak level from puberty to the time a person reaches their 20s and is maintained until their 40s, and then begins to decrease [2]. Nakata et al. [6] re- ported that because it is difficult to prevent osteoporosis in middle age with low peak bone mass, it is important to acquire basic eating and exercise habits during young adult age. Preventing a decrease of the peak bone mass through proper nutrition, exercise, sun bathing, etc. is very effective for preventing osteoporosis in old age [5]. It has been reported that eating habits in addition to ex- ercise habits greatly affect bone formation [3,7]. Kim et al. [8] found that the loss of bone mineral content and bone mass with age differs by gender. Hence, the effect of lifestyle on BMD and bone mass after acquiring the peak bone mass should be studied according to gender and by using people of a wide age range. Calcium ingestion during puberty markedly increases bone mass and may be an important factor in determin- ing peak bone mass [2]. Bone mass in females decreases by about 3 percent a year with age after menopause [9]. Hence, increasing peak bone mass as much as possible during puberty is very important, and also the examina- tion of relationships between BMD after adolescence and past (puberty) lifestyle habits will be essential. Nakada et al. [10] confirmed that the effect of past and present lifestyle habits and nutrition on calcaneal quantitative osteo-sono index (OSI) in pre- and post- menopausal females. This study aimed to examine the OSI differences among different gender and age groups, and the effect of past and present lifestyle and nutrition habits on OSI in people from 20 to 70 years of age. 2. METHODS 2.1. Subjects The subjects were 155 males (20-79 years of age) and 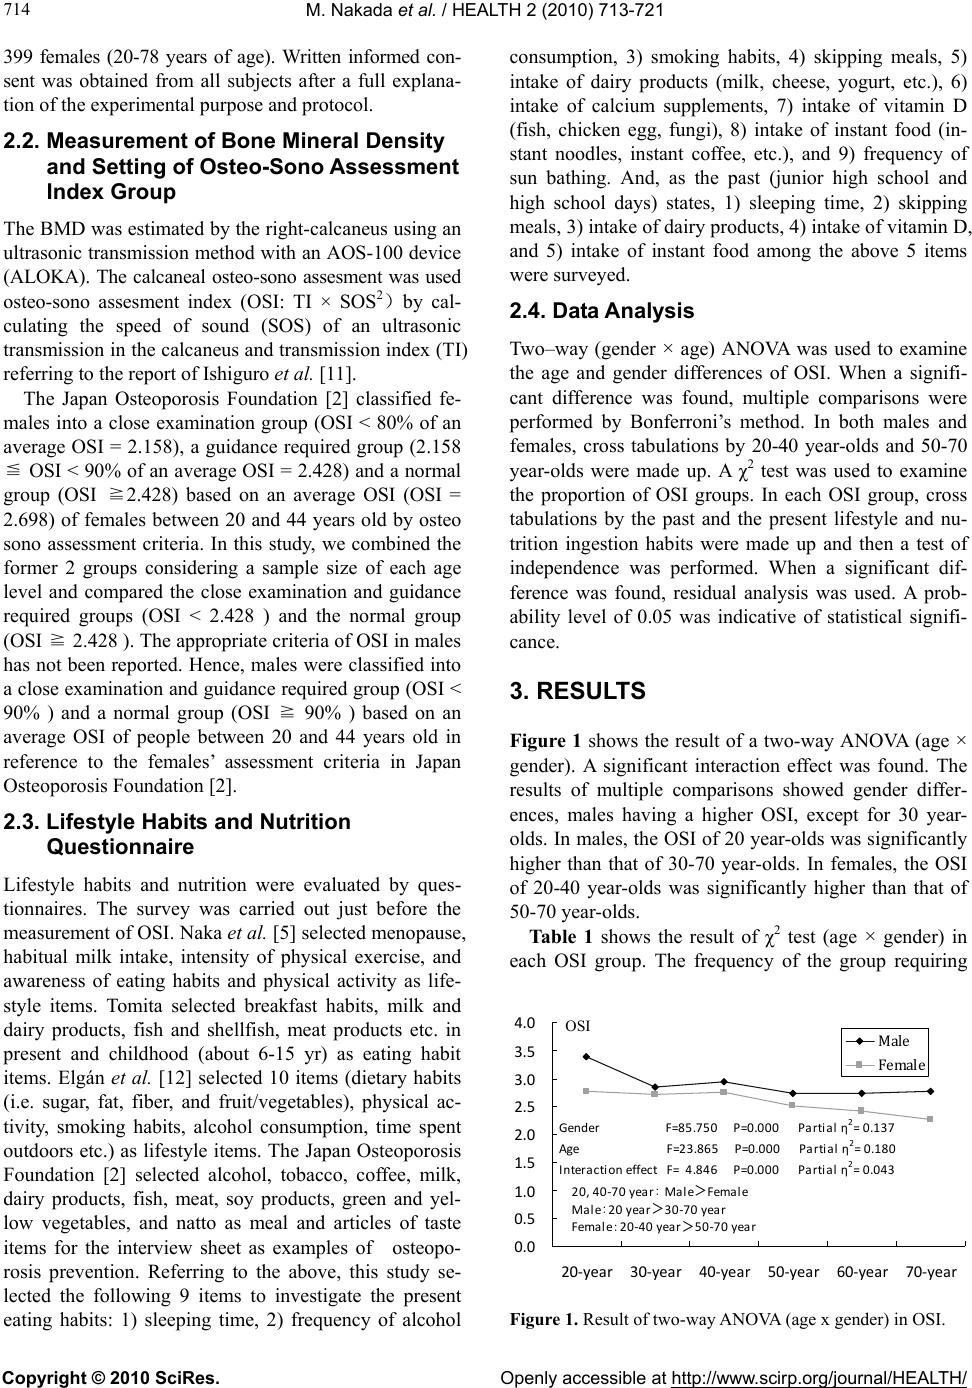 M. Nakada et al. / HEALTH 2 (2010) 713-721 Copyright © 2010 SciRes. Openly accessible at http://www.scirp.org/journa l/HEALTH/ 714 399 females (20-78 years of age). Written informed con- sent was obtained from all subjects after a full explana- tion of the experimental purpose and protocol. 2.2. Measurement of Bone Mineral Density and Setting of Osteo-Sono Assessment Index Group The BMD was estimated by the right-calcaneus using an ultrasonic transmission method with an AOS-100 device (ALOKA). The calcaneal osteo-sono assesment was used osteo-sono assesment index (OSI: TI × SOS2)by cal- culating the speed of sound (SOS) of an ultrasonic transmission in the calcaneus and transmission index (TI) referring to the report of Ishiguro et al. [11]. The Japan Osteoporosis Foundation [2] classified fe- males into a close examination group (OSI < 80% of an average OSI = 2.158), a guidance required group (2.158 ≦ OSI < 90% of an average OSI = 2.428) and a normal group (OSI ≧2.428) based on an average OSI (OSI = 2.698) of females between 20 and 44 years old by osteo sono assessment criteria. In this study, we combined the former 2 groups considering a sample size of each age level and compared the close examination and guidance required groups (OSI < 2.428 ) and the normal group (OSI ≧ 2.428 ). The appropriate criteria of OSI in males has not been reported. Hence, males were classified into a close examination and guidance required group (OSI < 90% ) and a normal group (OSI ≧ 90% ) based on an average OSI of people between 20 and 44 years old in reference to the females’ assessment criteria in Japan Osteoporosis Foundation [2]. 2.3. Lifestyle Habits and Nutrition Questionnaire Lifestyle habits and nutrition were evaluated by ques- tionnaires. The survey was carried out just before the measurement of OSI. Naka et al. [5] selected menopause, habitual milk intake, intensity of physical exercise, and awareness of eating habits and physical activity as life- style items. Tomita selected breakfast habits, milk and dairy products, fish and shellfish, meat products etc. in present and childhood (about 6-15 yr) as eating habit items. Elgán et al. [12] selected 10 items (dietary habits (i.e. sugar, fat, fiber, and fruit/vegetables), physical ac- tivity, smoking habits, alcohol consumption, time spent outdoors etc.) as lifestyle items. The Japan Osteoporosis Foundation [2] selected alcohol, tobacco, coffee, milk, dairy products, fish, meat, soy products, green and yel- low vegetables, and natto as meal and articles of taste items for the interview sheet as examples of osteopo- rosis prevention. Referring to the above, this study se- lected the following 9 items to investigate the present eating habits: 1) sleeping time, 2) frequency of alcohol consumption, 3) smoking habits, 4) skipping meals, 5) intake of dairy products (milk, cheese, yogurt, etc.), 6) intake of calcium supplements, 7) intake of vitamin D (fish, chicken egg, fungi), 8) intake of instant food (in- stant noodles, instant coffee, etc.), and 9) frequency of sun bathing. And, as the past (junior high school and high school days) states, 1) sleeping time, 2) skipping meals, 3) intake of dairy products, 4) intake of vitamin D, and 5) intake of instant food among the above 5 items were surveyed. 2.4. Data Analysis Two–way (gender × age) ANOVA was used to examine the age and gender differences of OSI. When a signifi- cant difference was found, multiple comparisons were performed by Bonferroni’s method. In both males and females, cross tabulations by 20-40 year-olds and 50-70 year-olds were made up. A χ2 test was used to examine the proportion of OSI groups. In each OSI group, cross tabulations by the past and the present lifestyle and nu- trition ingestion habits were made up and then a test of independence was performed. When a significant dif- ference was found, residual analysis was used. A prob- ability level of 0.05 was indicative of statistical signifi- cance. 3. RESULTS Figure 1 shows the result of a two-way ANOVA (age × gender). A significant interaction effect was found. The results of multiple comparisons showed gender differ- ences, males having a higher OSI, except for 30 year- olds. In males, the OSI of 20 year-olds was significantly higher than that of 30-70 year-olds. In females, the OSI of 20-40 year-olds was significantly higher than that of 50-70 year-olds. Ta bl e 1 shows the result of χ2 test (age × gender) in each OSI group. The frequency of the group requiring 0.0 0.5 1.0 1.5 2.0 2.5 3.0 3.5 4.0 20‐year 30‐year 40‐year 50‐year 60‐year70‐year Male Female Gender F=85.750P=0.000 Partia lη 2 =0.137 AgeF=23.865P=0.000 Partialη 2 =0.180 Interactioneff ectF=4.846P=0.000 Par tia l η 2 =0.043 20,40‐70year :Male>Female Male:20year >30‐70year Female:20‐40year>50‐70year OSI Figure 1. Result of two-way ANOVA (age x gender) in OSI. 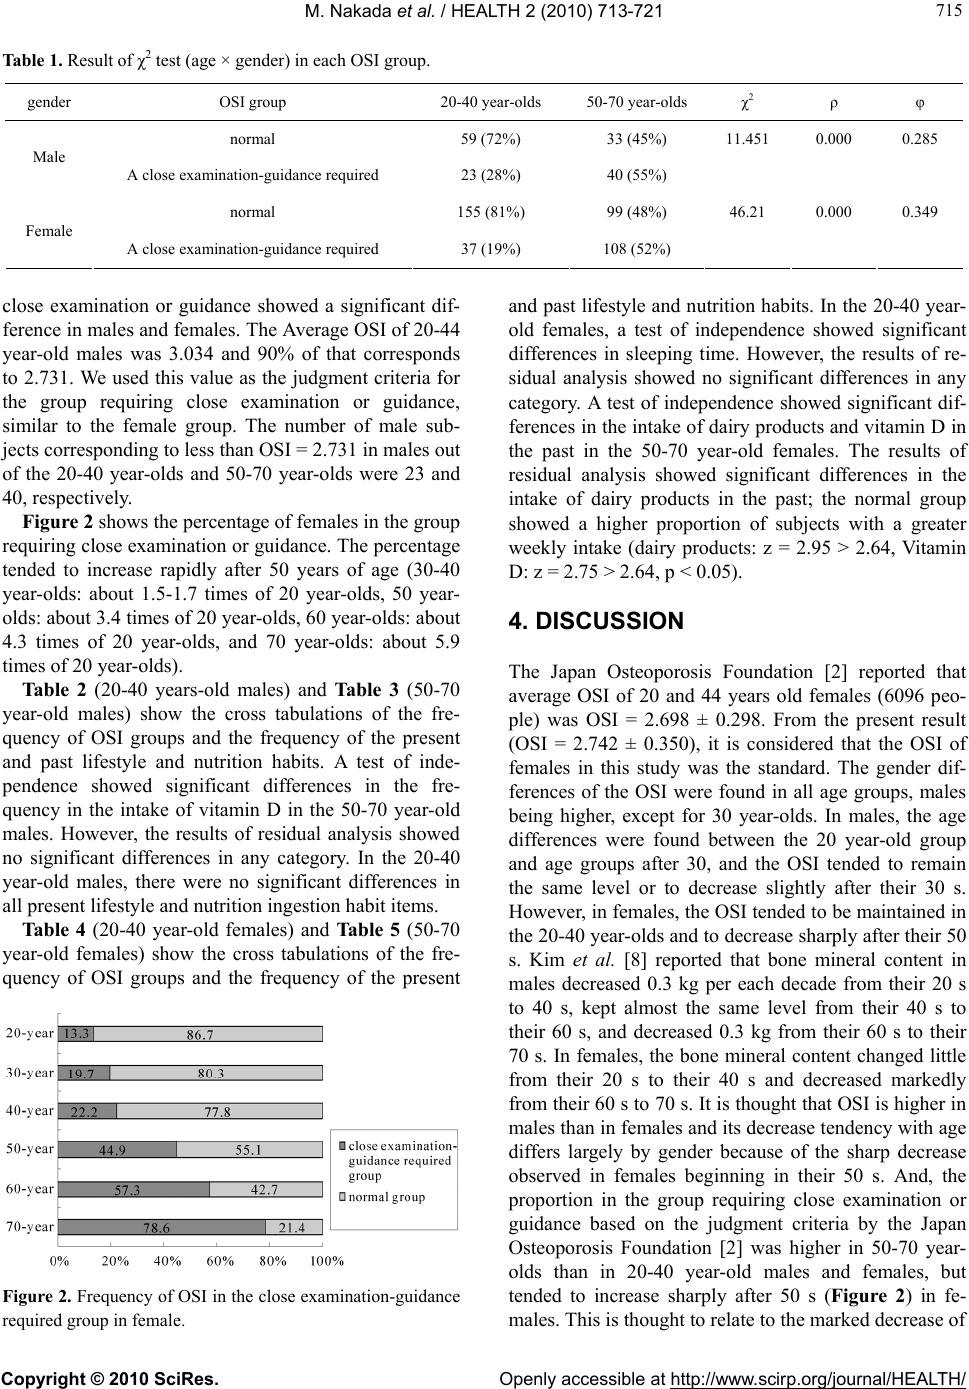 M. Nakada et al. / HEALTH 2 (2010) 713-721 Copyright © 2010 SciRes. Openly accessible at http://www.scirp.org/journa l/HEALTH/ 715 715 Table 1. Result of χ2 test (age × gender) in each OSI group. gender OSI group 20-40 year-olds 50-70 year-olds χ2 ρ φ normal 59 (72%) 33 (45%) 11.451 0.000 0.285 Male A close examination-guidance required 23 (28%) 40 (55%) normal 155 (81%) 99 (48%) 46.21 0.000 0.349 Female A close examination-guidance required 37 (19%) 108 (52%) close examination or guidance showed a significant dif- ference in males and females. The Average OSI of 20-44 year-old males was 3.034 and 90% of that corresponds to 2.731. We used this value as the judgment criteria for the group requiring close examination or guidance, similar to the female group. The number of male sub- jects corresponding to less than OSI = 2.731 in males out of the 20-40 year-olds and 50-70 year-olds were 23 and 40, respectively. and past lifestyle and nutrition habits. In the 20-40 year- old females, a test of independence showed significant differences in sleeping time. However, the results of re- sidual analysis showed no significant differences in any category. A test of independence showed significant dif- ferences in the intake of dairy products and vitamin D in the past in the 50-70 year-old females. The results of residual analysis showed significant differences in the intake of dairy products in the past; the normal group showed a higher proportion of subjects with a greater weekly intake (dairy products: z = 2.95 > 2.64, Vitamin D: z = 2.75 > 2.64, p < 0.05). Figure 2 shows the percentage of females in the group requiring close examination or guidance. The percentage tended to increase rapidly after 50 years of age (30-40 year-olds: about 1.5-1.7 times of 20 year-olds, 50 year- olds: about 3.4 times of 20 year-olds, 60 year-olds: about 4.3 times of 20 year-olds, and 70 year-olds: about 5.9 times of 20 year-olds). 4. DISCUSSION The Japan Osteoporosis Foundation [2] reported that average OSI of 20 and 44 years old females (6096 peo- ple) was OSI = 2.698 ± 0.298. From the present result (OSI = 2.742 ± 0.350), it is considered that the OSI of females in this study was the standard. The gender dif- ferences of the OSI were found in all age groups, males being higher, except for 30 year-olds. In males, the age differences were found between the 20 year-old group and age groups after 30, and the OSI tended to remain the same level or to decrease slightly after their 30 s. However, in females, the OSI tended to be maintained in the 20-40 year-olds and to decrease sharply after their 50 s. Kim et al. [8] reported that bone mineral content in males decreased 0.3 kg per each decade from their 20 s to 40 s, kept almost the same level from their 40 s to their 60 s, and decreased 0.3 kg from their 60 s to their 70 s. In females, the bone mineral content changed little from their 20 s to their 40 s and decreased markedly from their 60 s to 70 s. It is thought that OSI is higher in males than in females and its decrease tendency with age differs largely by gender because of the sharp decrease observed in females beginning in their 50 s. And, the proportion in the group requiring close examination or guidance based on the judgment criteria by the Japan Osteoporosis Foundation [2] was higher in 50-70 year- olds than in 20-40 year-old males and females, but tended to increase sharply after 50 s (Figure 2) in fe- ales. This is thought to relate to the marked decrease of Tab le 2 (20-40 years-old males) and Tab le 3 (50-70 year-old males) show the cross tabulations of the fre- quency of OSI groups and the frequency of the present and past lifestyle and nutrition habits. A test of inde- pendence showed significant differences in the fre- quency in the intake of vitamin D in the 50-70 year-old males. However, the results of residual analysis showed no significant differences in any category. In the 20-40 year-old males, there were no significant differences in all present lifestyle and nutrition ingestion habit items. Ta bl e 4 (20-40 year-old females) and Ta bl e 5 (50-70 year-old females) show the cross tabulations of the fre- quency of OSI groups and the frequency of the present Figure 2. Frequency of OSI in the close examination-guidance required group in female. m 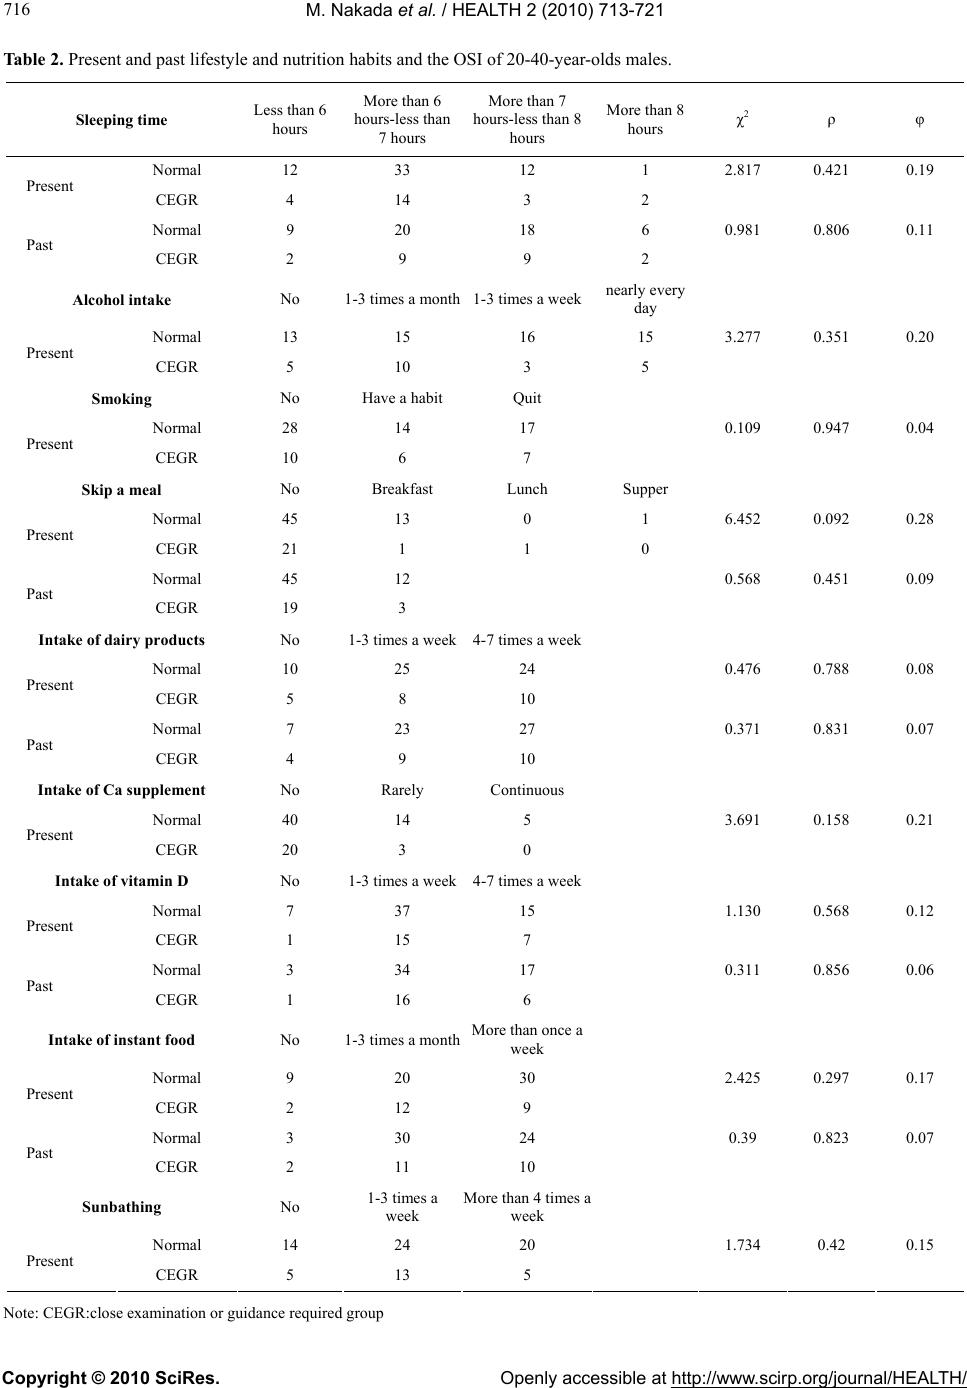 M. Nakada et al. / HEALTH 2 (2010) 713-721 Copyright © 2010 SciRes. Openly accessible at http://www.scirp.org/journa l/HEALTH/ 716 Table 2. Present and past lifestyle and nutrition habits and the OSI of 20-40-year-olds males. Sleeping time Less than 6 hours More than 6 hours-less than 7 hours More than 7 hours-less than 8 hours More than 8 hours χ2 ρ φ Normal 12 33 12 1 2.817 0.421 0.19 Present CEGR 4 14 3 2 Normal 9 20 18 6 0.981 0.806 0.11 Past CEGR 2 9 9 2 Alcohol intake No 1-3 times a month1-3 times a weeknearly every day Normal 13 15 16 15 3.277 0.351 0.20 Present CEGR 5 10 3 5 Smoking No Have a habit Quit Normal 28 14 17 0.109 0.947 0.04 Present CEGR 10 6 7 Skip a meal No Breakfast Lunch Supper Normal 45 13 0 1 6.452 0.092 0.28 Present CEGR 21 1 1 0 Normal 45 12 0.568 0.451 0.09 Past CEGR 19 3 Intake of dairy products No 1-3 times a week4-7 times a week Normal 10 25 24 0.476 0.788 0.08 Present CEGR 5 8 10 Normal 7 23 27 0.371 0.831 0.07 Past CEGR 4 9 10 Intake of Ca supplement No Rarely Continuous Normal 40 14 5 3.691 0.158 0.21 Present CEGR 20 3 0 Intake of vitamin D No 1-3 times a week4-7 times a week Normal 7 37 15 1.130 0.568 0.12 Present CEGR 1 15 7 Normal 3 34 17 0.311 0.856 0.06 Past CEGR 1 16 6 Intake of instant food No 1-3 times a monthMore than once a week Normal 9 20 30 2.425 0.297 0.17 Present CEGR 2 12 9 Normal 3 30 24 0.39 0.823 0.07 Past CEGR 2 11 10 Sunbathing No 1-3 times a week More than 4 times a week Normal 14 24 20 1.734 0.42 0.15 Present CEGR 5 13 5 Note: CEGR:close examination or guidance required group 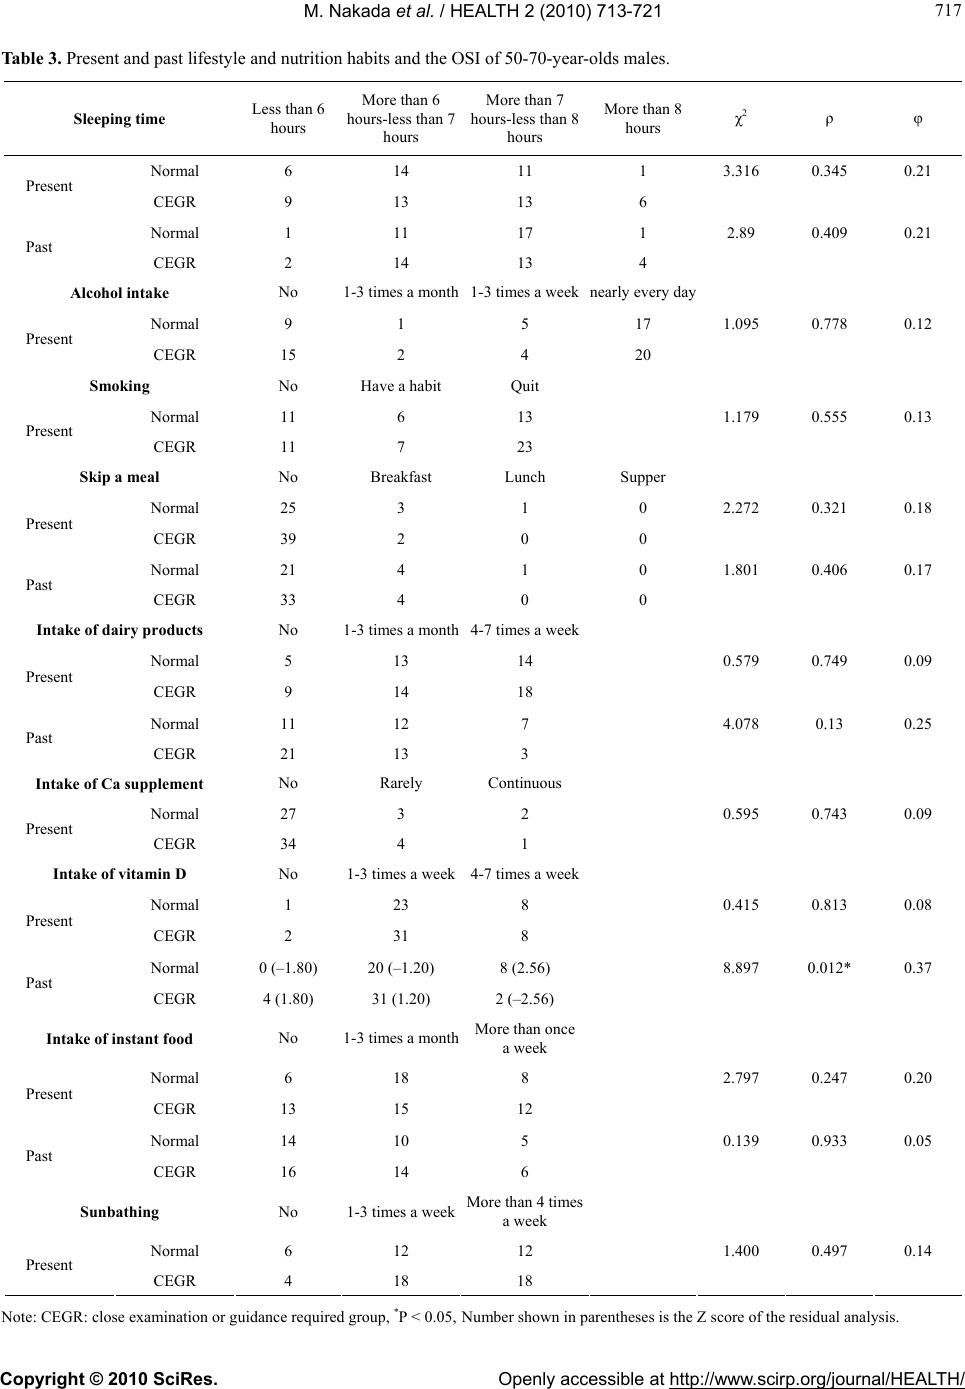 M. Nakada et al. / HEALTH 2 (2010) 713-721 Copyright © 2010 SciRes. Openly accessible at http://www.scirp.org/journa l/HEALTH/ 717 717 Table 3. Present and past lifestyle and nutrition habits and the OSI of 50-70-year-olds males. Sleeping time Less than 6 hours More than 6 hours-less than 7 hours More than 7 hours-less than 8 hours More than 8 hours χ2 ρ φ Normal 6 14 11 1 3.316 0.345 0.21 Present CEGR 9 13 13 6 Normal 1 11 17 1 2.89 0.409 0.21 Past CEGR 2 14 13 4 Alcohol intake No 1-3 times a month1-3 times a weeknearly every day Normal 9 1 5 17 1.095 0.778 0.12 Present CEGR 15 2 4 20 Smoking No Have a habit Quit Normal 11 6 13 1.179 0.555 0.13 Present CEGR 11 7 23 Skip a meal No Breakfast Lunch Supper Normal 25 3 1 0 2.272 0.321 0.18 Present CEGR 39 2 0 0 Normal 21 4 1 0 1.801 0.406 0.17 Past CEGR 33 4 0 0 Intake of dairy products No 1-3 times a month4-7 times a week Normal 5 13 14 0.579 0.749 0.09 Present CEGR 9 14 18 Normal 11 12 7 4.078 0.13 0.25 Past CEGR 21 13 3 Intake of Ca supplement No Rarely Continuous Normal 27 3 2 0.595 0.743 0.09 Present CEGR 34 4 1 Intake of vitamin D No 1-3 times a week4-7 times a week Normal 1 23 8 0.415 0.813 0.08 Present CEGR 2 31 8 Normal 0 (–1.80) 20 (–1.20) 8 (2.56) 8.897 0.012* 0.37 Past CEGR 4 (1.80) 31 (1.20) 2 (–2.56) Intake of instant food No 1-3 times a monthMore than once a week Normal 6 18 8 2.797 0.247 0.20 Present CEGR 13 15 12 Normal 14 10 5 0.139 0.933 0.05 Past CEGR 16 14 6 Sunbathing No 1-3 times a weekMore than 4 times a week Normal 6 12 12 1.400 0.497 0.14 Present CEGR 4 18 18 Note: CEGR: close examination or guidance required group, *P < 0.05, Number shown in parentheses is the Z score of the residual analysis. 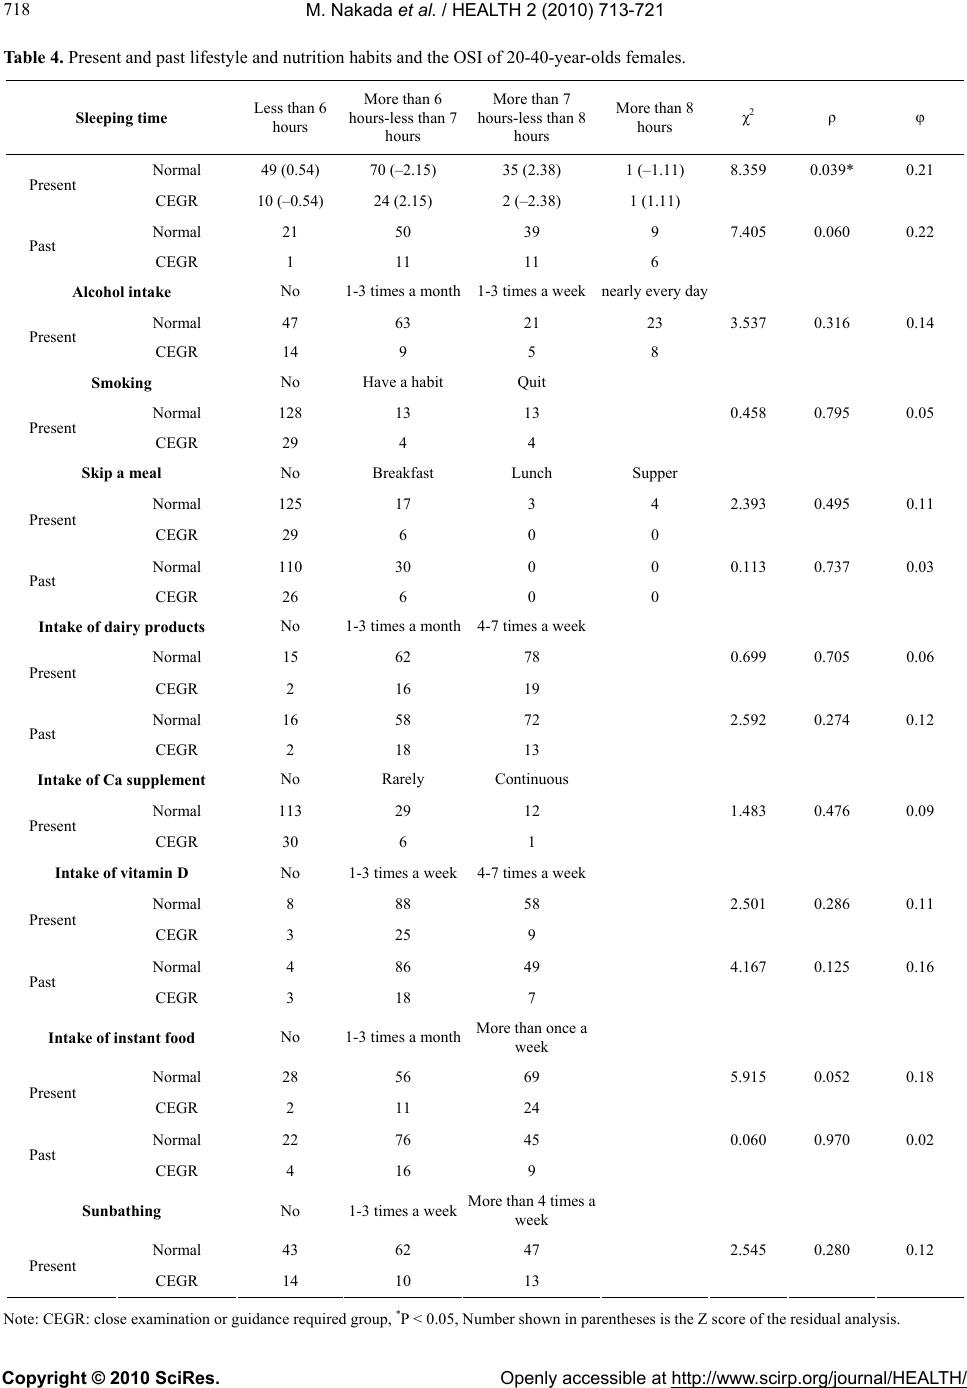 M. Nakada et al. / HEALTH 2 (2010) 713-721 Copyright © 2010 SciRes. Openly accessible at http://www.scirp.org/journa l/HEALTH/ 718 Table 4. Present and past lifestyle and nutrition habits and the OSI of 20-40-year-olds females. Sleeping time Less than 6 hours More than 6 hours-less than 7 hours More than 7 hours-less than 8 hours More than 8 hours χ2 ρ φ Normal 49 (0.54) 70 (–2.15) 35 (2.38) 1 (–1.11) 8.359 0.039* 0.21 Present CEGR 10 (–0.54) 24 (2.15) 2 (–2.38) 1 (1.11) Normal 21 50 39 9 7.405 0.060 0.22 Past CEGR 1 11 11 6 Alcohol intake No 1-3 times a month1-3 times a weeknearly every day Normal 47 63 21 23 3.537 0.316 0.14 Present CEGR 14 9 5 8 Smoking No Have a habit Quit Normal 128 13 13 0.458 0.795 0.05 Present CEGR 29 4 4 Skip a meal No Breakfast Lunch Supper Normal 125 17 3 4 2.393 0.495 0.11 Present CEGR 29 6 0 0 Normal 110 30 0 0 0.113 0.737 0.03 Past CEGR 26 6 0 0 Intake of dairy products No 1-3 times a month4-7 times a week Normal 15 62 78 0.699 0.705 0.06 Present CEGR 2 16 19 Normal 16 58 72 2.592 0.274 0.12 Past CEGR 2 18 13 Intake of Ca supplement No Rarely Continuous Normal 113 29 12 1.483 0.476 0.09 Present CEGR 30 6 1 Intake of vitamin D No 1-3 times a week4-7 times a week Normal 8 88 58 2.501 0.286 0.11 Present CEGR 3 25 9 Normal 4 86 49 4.167 0.125 0.16 Past CEGR 3 18 7 Intake of instant food No 1-3 times a monthMore than once a week Normal 28 56 69 5.915 0.052 0.18 Present CEGR 2 11 24 Normal 22 76 45 0.060 0.970 0.02 Past CEGR 4 16 9 Sunbathing No 1-3 times a weekMore than 4 times a week Normal 43 62 47 2.545 0.280 0.12 Present CEGR 14 10 13 Note: CEGR: close examination or guidance required group, *P < 0.05, Number shown in parentheses is the Z score of the residual analysis. 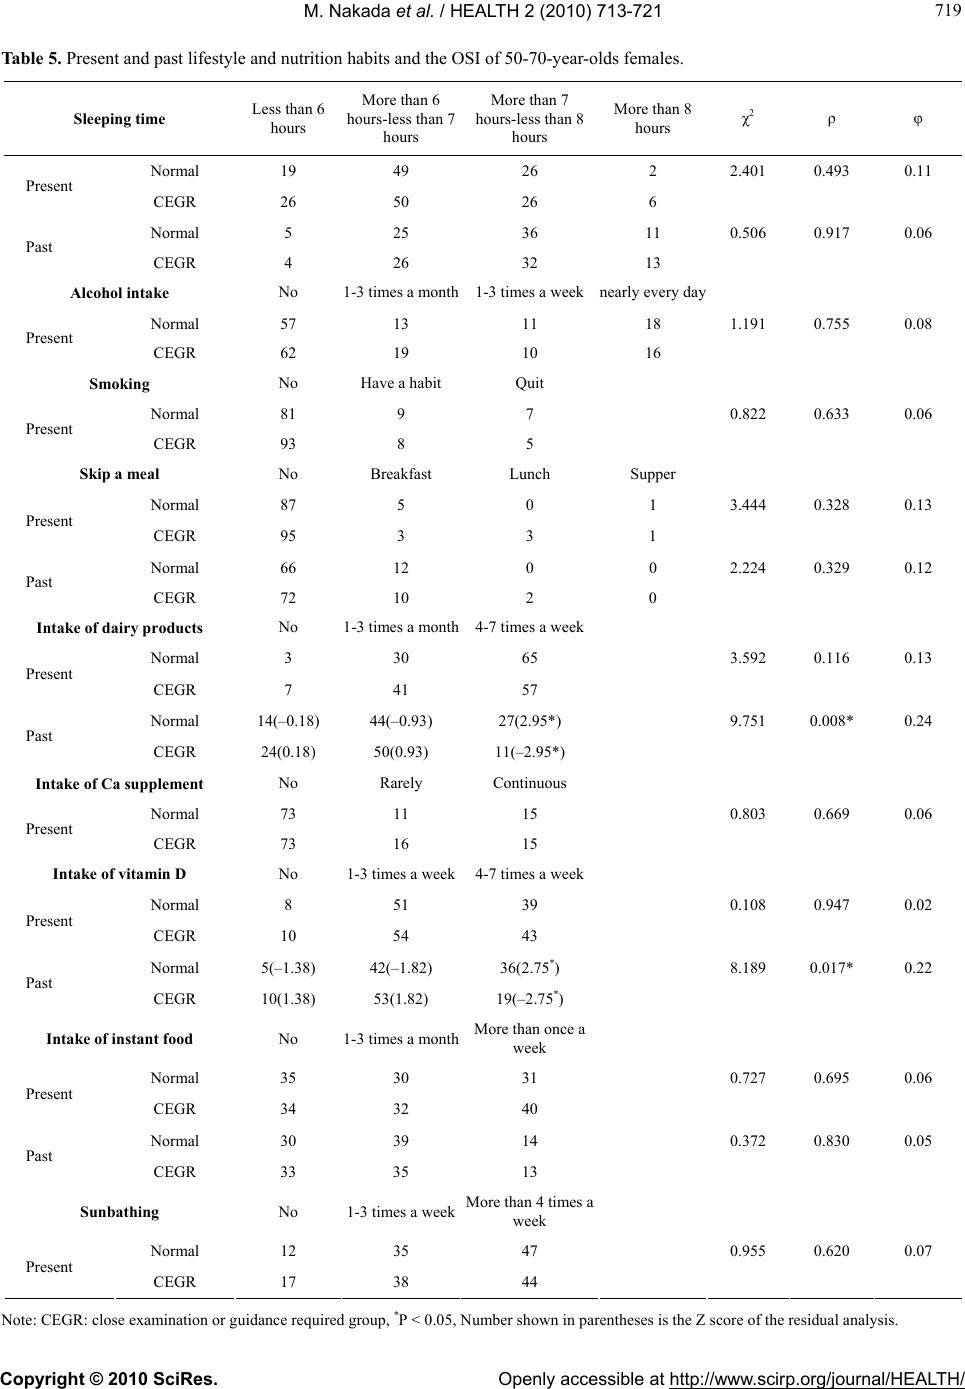 M. Nakada et al. / HEALTH 2 (2010) 713-721 Copyright © 2010 SciRes. Openly accessible at http://www.scirp.org/journa l/HEALTH/ 719 719 Table 5. Present and past lifestyle and nutrition habits and the OSI of 50-70-year-olds females. Sleeping time Less than 6 hours More than 6 hours-less than 7 hours More than 7 hours-less than 8 hours More than 8 hours χ2 ρ φ Normal 19 49 26 2 2.401 0.493 0.11 Present CEGR 26 50 26 6 Normal 5 25 36 11 0.506 0.917 0.06 Past CEGR 4 26 32 13 Alcohol intake No 1-3 times a month1-3 times a weeknearly every day Normal 57 13 11 18 1.191 0.755 0.08 Present CEGR 62 19 10 16 Smoking No Have a habit Quit Normal 81 9 7 0.822 0.633 0.06 Present CEGR 93 8 5 Skip a meal No Breakfast Lunch Supper Normal 87 5 0 1 3.444 0.328 0.13 Present CEGR 95 3 3 1 Normal 66 12 0 0 2.224 0.329 0.12 Past CEGR 72 10 2 0 Intake of dairy products No 1-3 times a month4-7 times a week Normal 3 30 65 3.592 0.116 0.13 Present CEGR 7 41 57 Normal 14(–0.18) 44(–0.93) 27(2.95*) 9.751 0.008* 0.24 Past CEGR 24(0.18) 50(0.93) 11(–2.95*) Intake of Ca supplement No Rarely Continuous Normal 73 11 15 0.803 0.669 0.06 Present CEGR 73 16 15 Intake of vitamin D No 1-3 times a week4-7 times a week Normal 8 51 39 0.108 0.947 0.02 Present CEGR 10 54 43 Normal 5(–1.38) 42(–1.82) 36(2.75*) 8.189 0.017* 0.22 Past CEGR 10(1.38) 53(1.82) 19(–2.75*) Intake of instant food No 1-3 times a monthMore than once a week Normal 35 30 31 0.727 0.695 0.06 Present CEGR 34 32 40 Normal 30 39 14 0.372 0.830 0.05 Past CEGR 33 35 13 Sunbathing No 1-3 times a weekMore than 4 times a week Normal 12 35 47 0.955 0.620 0.07 Present CEGR 17 38 44 N ote: CEGR: close examination or guidance required group, *P < 0.05, Number shown in parentheses is the Z score of the residual analysis. 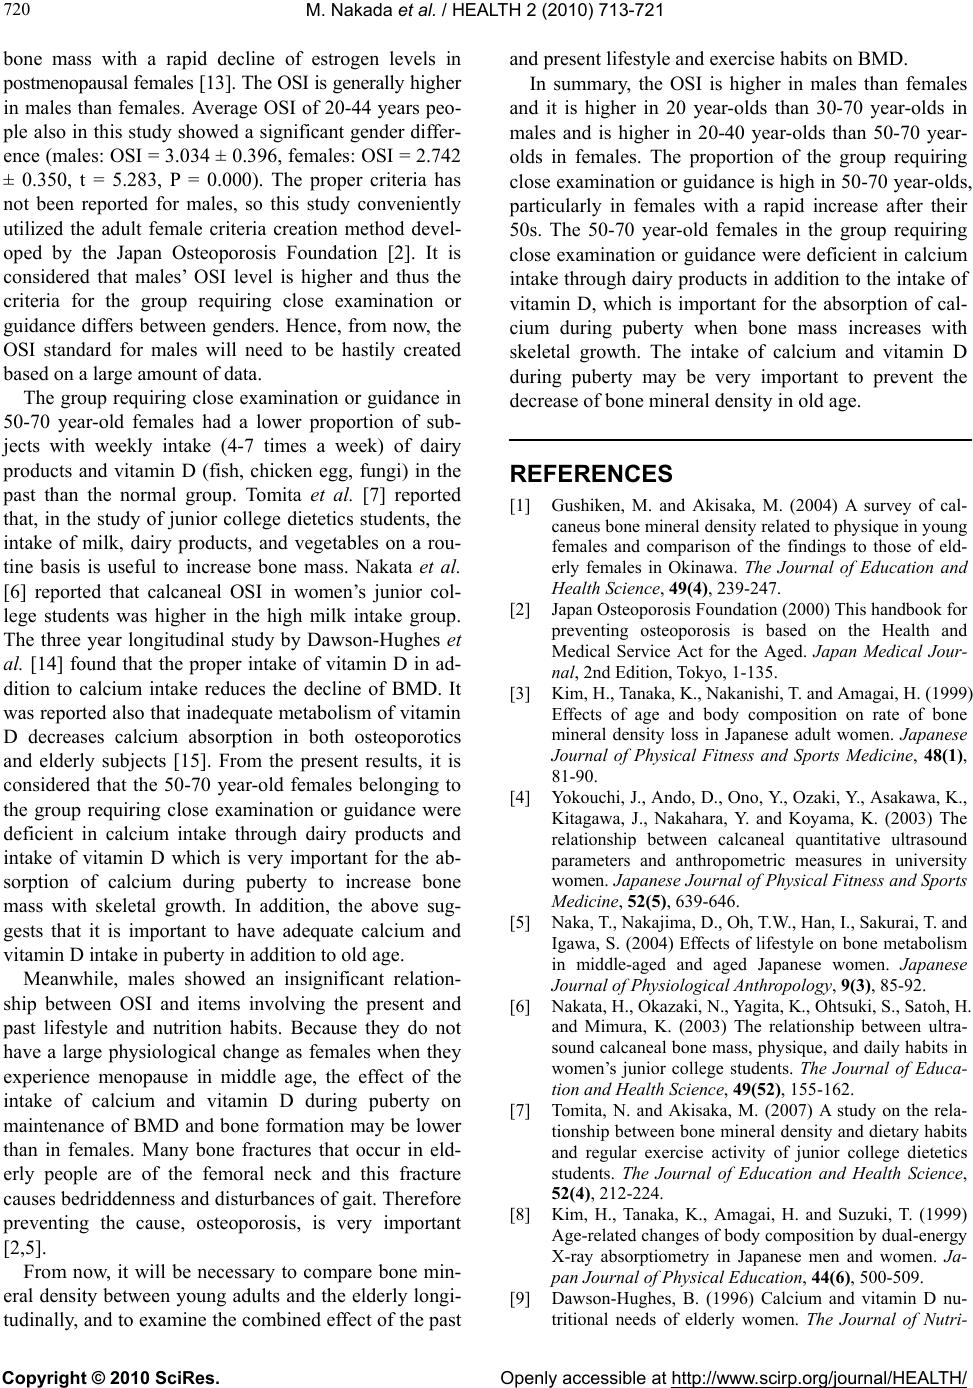 M. Nakada et al. / HEALTH 2 (2010) 713-721 Copyright © 2010 SciRes. Openly accessible at http://www.scirp.org/journa l/HEALTH/ 720 bone mass with a rapid decline of estrogen levels in postmenopausal females [13]. The OSI is generally higher in males than females. Average OSI of 20-44 years peo- ple also in this study showed a significant gender differ- ence (males: OSI = 3.034 ± 0.396, females: OSI = 2.742 ± 0.350, t = 5.283, P = 0.000). The proper criteria has not been reported for males, so this study conveniently utilized the adult female criteria creation method devel- oped by the Japan Osteoporosis Foundation [2]. It is considered that males’ OSI level is higher and thus the criteria for the group requiring close examination or guidance differs between genders. Hence, from now, the OSI standard for males will need to be hastily created based on a large amount of data. The group requiring close examination or guidance in 50-70 year-old females had a lower proportion of sub- jects with weekly intake (4-7 times a week) of dairy products and vitamin D (fish, chicken egg, fungi) in the past than the normal group. Tomita et al. [7] reported that, in the study of junior college dietetics students, the intake of milk, dairy products, and vegetables on a rou- tine basis is useful to increase bone mass. Nakata et al. [6] reported that calcaneal OSI in women’s junior col- lege students was higher in the high milk intake group. The three year longitudinal study by Dawson-Hughes et al. [14] found that the proper intake of vitamin D in ad- dition to calcium intake reduces the decline of BMD. It was reported also that inadequate metabolism of vitamin D decreases calcium absorption in both osteoporotics and elderly subjects [15]. From the present results, it is considered that the 50-70 year-old females belonging to the group requiring close examination or guidance were deficient in calcium intake through dairy products and intake of vitamin D which is very important for the ab- sorption of calcium during puberty to increase bone mass with skeletal growth. In addition, the above sug- gests that it is important to have adequate calcium and vitamin D intake in puberty in addition to old age. Meanwhile, males showed an insignificant relation- ship between OSI and items involving the present and past lifestyle and nutrition habits. Because they do not have a large physiological change as females when they experience menopause in middle age, the effect of the intake of calcium and vitamin D during puberty on maintenance of BMD and bone formation may be lower than in females. Many bone fractures that occur in eld- erly people are of the femoral neck and this fracture causes bedriddenness and disturbances of gait. Therefore preventing the cause, osteoporosis, is very important [2,5]. From now, it will be necessary to compare bone min- eral density between young adults and the elderly longi- tudinally, and to examine the combined effect of the past and present lifestyle and exercise habits on BMD. In summary, the OSI is higher in males than females and it is higher in 20 year-olds than 30-70 year-olds in males and is higher in 20-40 year-olds than 50-70 year- olds in females. The proportion of the group requiring close examination or guidance is high in 50-70 year-olds, particularly in females with a rapid increase after their 50s. The 50-70 year-old females in the group requiring close examination or guidance were deficient in calcium intake through dairy products in addition to the intake of vitamin D, which is important for the absorption of cal- cium during puberty when bone mass increases with skeletal growth. The intake of calcium and vitamin D during puberty may be very important to prevent the decrease of bone mineral density in old age. REFERENCES [1] Gushiken, M. and Akisaka, M. (2004) A survey of cal- caneus bone mineral density related to physique in young females and comparison of the findings to those of eld- erly females in Okinawa. The Journal of Education and Health Science, 49(4), 239-247. [2] Japan Osteoporosis Foundation (2000) This handbook for preventing osteoporosis is based on the Health and Medical Service Act for the Aged. Japan Medical Jour- nal, 2nd Edition, Tokyo, 1-135. [3] Kim, H., Tanaka, K., Nakanishi, T. and Amagai, H. (1999) Effects of age and body composition on rate of bone mineral density loss in Japanese adult women. Japanese Journal of Physical Fitness and Sports Medicine, 48(1), 81-90. [4] Yokouchi, J., Ando, D., Ono, Y., Ozaki, Y., Asakawa, K., Kitagawa, J., Nakahara, Y. and Koyama, K. (2003) The relationship between calcaneal quantitative ultrasound parameters and anthropometric measures in university women. Japanese Journal of Physical Fitness and Sports Medicine, 52(5), 639-646. [5] Naka, T., Nakajima, D., Oh, T.W., Han, I., Sakurai, T. and Igawa, S. (2004) Effects of lifestyle on bone metabolism in middle-aged and aged Japanese women. Japanese Journal of Physiological Anthropology, 9(3), 85-92. [6] Nakata, H., Okazaki, N., Yagita, K., Ohtsuki, S., Satoh, H. and Mimura, K. (2003) The relationship between ultra- sound calcaneal bone mass, physique, and daily habits in women’s junior college students. The Journal of Educa- tion and Health Science, 49(52), 155-162. [7] Tomita, N. and Akisaka, M. (2007) A study on the rela- tionship between bone mineral density and dietary habits and regular exercise activity of junior college dietetics students. The Journal of Education and Health Science, 52(4), 212-224. [8] Kim, H., Tanaka, K., Amagai, H. and Suzuki, T. (1999) Age-related changes of body composition by dual-energy X-ray absorptiometry in Japanese men and women. Ja- pan Journal of Physical Education, 44(6), 500-509. [9] Dawson-Hughes, B. (1996) Calcium and vitamin D nu- tritional needs of elderly women. The Journal of Nutri-  M. Nakada et al. / HEALTH 2 (2010) 713-721 Copyright © 2010 SciRes. Openly accessible at http://www.scirp.org/journa l/HEALTH/ 721 721 tion, 126(Suppl 4), 1165s-1167s. [10] Nakada, M. and Demura, S. (2010) Effect of past and present lifestyle habits and nutrition on calcaneal quanti- tative osteo-sono index in pre- and post-menopausal fe- males. Health, 2(2), 124-130. [11] Ishiguro, N., Miyatani, M., Kanehisa, H., Kuno, S. and Fukunaga, T. (2003) Relationship between walking steps during daily life and both the bone intensity of calcaneus and muscle thickness of the lower leg in elderly men and women. Japanese Journal of Physical Fitness and Sports Medicine, 52, 127-132. [12] Elgán, C. and Fridlund, B. (2006) Bone mineral density in relation to body mass index among young women: A prospective cohort study. International Journal of Nurs- ing Studies, 43(6), 663-672. [13] Kameda, T., Mano, H., Yuasa, T., Mori, Y., Miyazawa, K., Shiokawa, M., Nakamaru, Y., Hiroi, E., Hiura, K., Ka- meda, A., Yang, N.N., Hakeda, Y. and Kumegawa, M. (1997) Estrogen inhibits bone resorption by directly in- ducing apoptosis of the bone-resorbing osteoclasts. The Journal of Experimental Medicine, 186(4), 489-495. [14] Dawson-Hughes, B., Harris, S.S., Krall, E.A. and Dallal, G.E. (1997) Effect of calcium and vitamin D supplemen- tation on bone density in men and women 65 years of age or older. The New England Journal of Medicine, 337(10), 670-676. [15] Gallagher, J.C., Riggs, B.L., Eisman, J., Hamstra, A., Arnaud, S.B. and DeLuca, H.F. (1979) Intestinal calcium absorption and serum vitamin D metabolites in normal subjects and osteoporotic patients: Effect of age and die- tary calcium. The Journal of Clinical Investigation, 64(3), 729-736. |