

Paper Menu >>
Journal Menu >>
 World Journal of AIDS, 2012, 2, 252-258 doi:10.4236/wja.2012.23033 Published Online September 2012 (http://www.SciRP.org/journal/wja) 249 The Effect of Antiretroviral Therapy (ART) on Body Composition and Clinical Markers of Lipodystrophy in HIV-Infected Children Assessed in Follow-Up Study Agnieszka B. Dzwonek1, Vas Novelli1, C. Smith2, Margaret Lawson3 1Clinical Infectious Diseases Unit, Great Ormond Street Children’s Hospital NHS Trust, London, UK; 2Research Department of In- fection and Population Health, University College London Medical School, London, UK; 3Childhood Nutrition Research Centre, Institute of Child Health, University College London, London, UK. Email: Vas. [email protected] Received April 16th, 2012; revised May 16th, 2012; accepted June 1st, 2012 ABSTRACT Objectives: An tiretroviral therapy (ART) has been associated with lipodystrophy in childr en. We evaluated chang es in various anthropometric measurements for the assessment of lipodystrophy and assessed whether there was an associa- tion with use of protease inhibitors (PI), non-PI containing ART and/or stavudine (d4T). Methods: Eighty-five HIV-infected children attending the HIV clinic at Great Ormond Street Hospital (GOSH) were included. The average follow-up was 8.4 months (range 3 - 12 months). Body fat redistribution was assessed by anthropometric measurements including skinfold thickness and circumferences of upper and lower limbs. Measurements were converted to age- and sex- adjusted z-scores through development stages including puberty. Results: Sixty children had taken ART; 37 re- ceived PI-containing; 38 received d4T; 25 had never been treated. In the studied population, clinically important changes with decreases in biceps (BSF), subscapular skinfolds and total body fat (4SFT) over period of 12 months were observed. Some increase was noticed in triceps skinfolds (TSF). Limbs circumferences remained at the same level. Further we looked at 4 months basis changes in anthropometric measurements stratified by baseline ART. Generally z-scores of anthropometric measurements were lower in therapy naive children when compared to ART groups. PI-based ART regimens resulted in significant increases in BSF with a trend towards increases in TSF, suprailiac and 4SFT. Mid-arm and thigh circumferences were higher in PI compared to naive group. Similarly, significant changes in BSF z-scores were associated with d4T use. Increases were seen in TSF and mid-arm circumference and decreases were observed in subscapular skinfolds and calf circumference z-scores. Conclusions: Body fat redistribution in HIV-in- fected children with sub-clinical lipodystrophy could be detected by anthropometric measurements, particularly when PI or d4T is included in ART. Over time, changes with increase in arm and trunk fat, and no change or decrease in leg fat were more pronounced among ART-receiving children. Keywords: Body Fat Redistribution; Anthropometric Measurements; HIV; Children; Art 1. Introduction Although survival in HIV-infected children has greatly improved with the introduction of antiretroviral therapy (ART), a lipodystrophy syndrome has emerged [1-6]. This encompasses abnormal distribution of adipose tissue, peripheral wasting, insulin-resistance and dyslipidaemia. Children may be more vulnerable than adults because of the potential impact of growth, as well as children’s likely greater cumulative exposure [7]. The lipodystrophy syndrome has been mostly studied via cross-sectional studies [2-6,8,9 ]. Determination of the prevalence of lipodystrophy has b een compli cated by the lack of an objective case definition for use in children. Further, assessment of lipodystrophy is complicated by the different methodologies used to assess its components across studies. The recent European Collaborative Study estimated a 42% prevalence of body fat abnormality in 426 HIV- infected children and adolescents based on clinical ob- servation (peripheral lipoatrophy and/or central lipo- hypertrophy) [8]. A prevalence of fat abnormality in this study was substantially higher than the proportion of about 25% reported in other previous paediatric studies [2-4,6,10]. Clinical lipodystrophy, metabolic changes and insu- lin-resistance have been reported to worsen at puberty. Some studies have shown that ethnicity, clinical condi- tion, duration of HIV infection, nucleoside reverse tran- Copyright © 2012 SciRes. WJA  The Effect of Antiretroviral Therapy (ART) on Body Composition and Clinical Markers of Lipodystrophy in HIV-Infected Children Assessed in Follow-Up Study 253 scriptase inhibitor (NRTI) and protease inhibitor (PI) treatment were associated with lipodystrophy [9-12]. The objectives of this observational follow up study were to investigate changes in anthropometric measure- ments in a cohort of HIV-infected children on different ART regimens over study period and to assess whether there was an association between PI and d4T use with these measurements. 2. Methods 2.1. Patients Population We studied HIV-infected children older than three years attending the HIV Family Clinic at Great Ormond Street Children’s Hospital (GOSH) NHS Trust, London, UK between 2002 and 2004. Relevant ethical approval was granted by the Institute of Child Health and GOSH Re- search Ethics Committee and Informed consent was ob- tained. Recent steroid therapy or wasting from other causes (e.g. disuse atrophy) were criteria for exclusion. Of the 128 HIV-infected children identified as eligible during the study period, 113 (88%) participated but only those with follow-up visits (n = 85) were included in the analysis. Clinical details and drug history were extracted from the Collaborative HIV Paediatric Study (CHIPS) database. The HIV clinic at GOSH follows Paediatric European Network for Treatment of AIDS (PENTA) guidelines for initiating antiretroviral therapy [13]. Gen- erally, ART is started in p atients with persistently low or declining CD4 counts, or with clinical deterioration. 2.2. Anthropometric Measurements After study enrolment, measurements were taken at clinic visits scheduled every three to four months. Trained phy- sician for taking anthropometric measurements (AD) collected data over 3 year’s period and all children who attended HIV Family Clinic and who agreed on that par- ticular visit to participate in the study were included in the analysis. Before anthropometric measurements were obtained, all children had a general physical examination, including observation for clinical features of peripheral lipoatrophy and central lipohypertrophy. Weight and height were recorded, and body mass index (BMI: kg/m2) was calculated. Skinfold thickness, triceps (TSF), biceps (BSF), subscapular and suprailiac, were measured using the Harpenden Skinfold Calliper (Holtain Ltd., Crymych UK). The sum of these four skinfold sites was calculated as an indication of total body fat. Peripheral adiposity was assessed by measuring midupper arm (MAC), thigh and calf circumferences using a narrow one-metre tape (Chasmors Ltd., London UK). Triplicate skinfold and circumference measurements were undertaken by the same trained researcher (AD). The mean value of the three measurements was used in the analysis. Skinfold and circumference measurements were converted to age- and sex-adjusted z-scores (the distance of the value from the age- and sex-appropriate mean) using Dutch refer- ence data and a SPSS programme developed at the Insti- tute of Child Health, UCL, described previously [9,14]. 2.3. Statistical Analyses The dates of the first anthropometric measurements per- formed on each child were defined as baseline. The 4- month measurements of the anthropometric markers were found by creating a window 2 months either side (i.e. from 2 - 6 months), and the nearest measurement that took place within this window was taken as the four month measurement. Similar approach was used for 8 and 12 months. The median and interquartile range val- ues at baseline, 4, 8 and 12 months for each anthro- pometric measurement were calculated. Furthermore, the change from baseline at 4, 8 and 12 months was also calculated. This analysis was then repeated stratified by antiretroviral regimen at baseline and compared using a Kruskall Wallis test. Analyses were performed using SAS version 9.0 (SAS Institute Inc., Cary, NC, USA). 3. Results Amongst 113 children enrolled in the study between 2002 and 2004, 85 children had follow up anthropomet- ric measurements. Their median (range) age was 9.7 years (3.0 - 15.7 years). All had vertically acquired HIV- 1 infection and 90% were of black Sub-Saharan African origin. Eighty five children included in analyses had two or more visits. The majority (n = 38) had three visits, with 34 children having 2 visits and 13 having four or more. These resulted in total of 237 clinic visits when measurements were taken over study period. The average time of observation was 0.7 years ranging from 3 to 12 months. Characteristics of the studied group are pre- sented in Table 1. At enrolment, 51 children (60%) were receiving ART therapy. Of these, 24 children (47%) were receiving a protease inhibitor (PI) based regimen. Forty one per cent of currently treated (21/51) children with ART at the entry to the study received d4T, including 8 children who were receiving both a PI-s and d4T therapy. Thirty-four children (40%) were not on any treatment at enrolment, including 9 who had been previously treated, but had stopped therapy in the 6 months before entry. Twenty five children had never been treated with ART. In the past, 37 children had been exposed to PI-based ART and 38 children to d4T. 3.1. Study Population The median (range) age- and sex-adjusted z-scores at the Copyright © 2012 SciRes. WJA 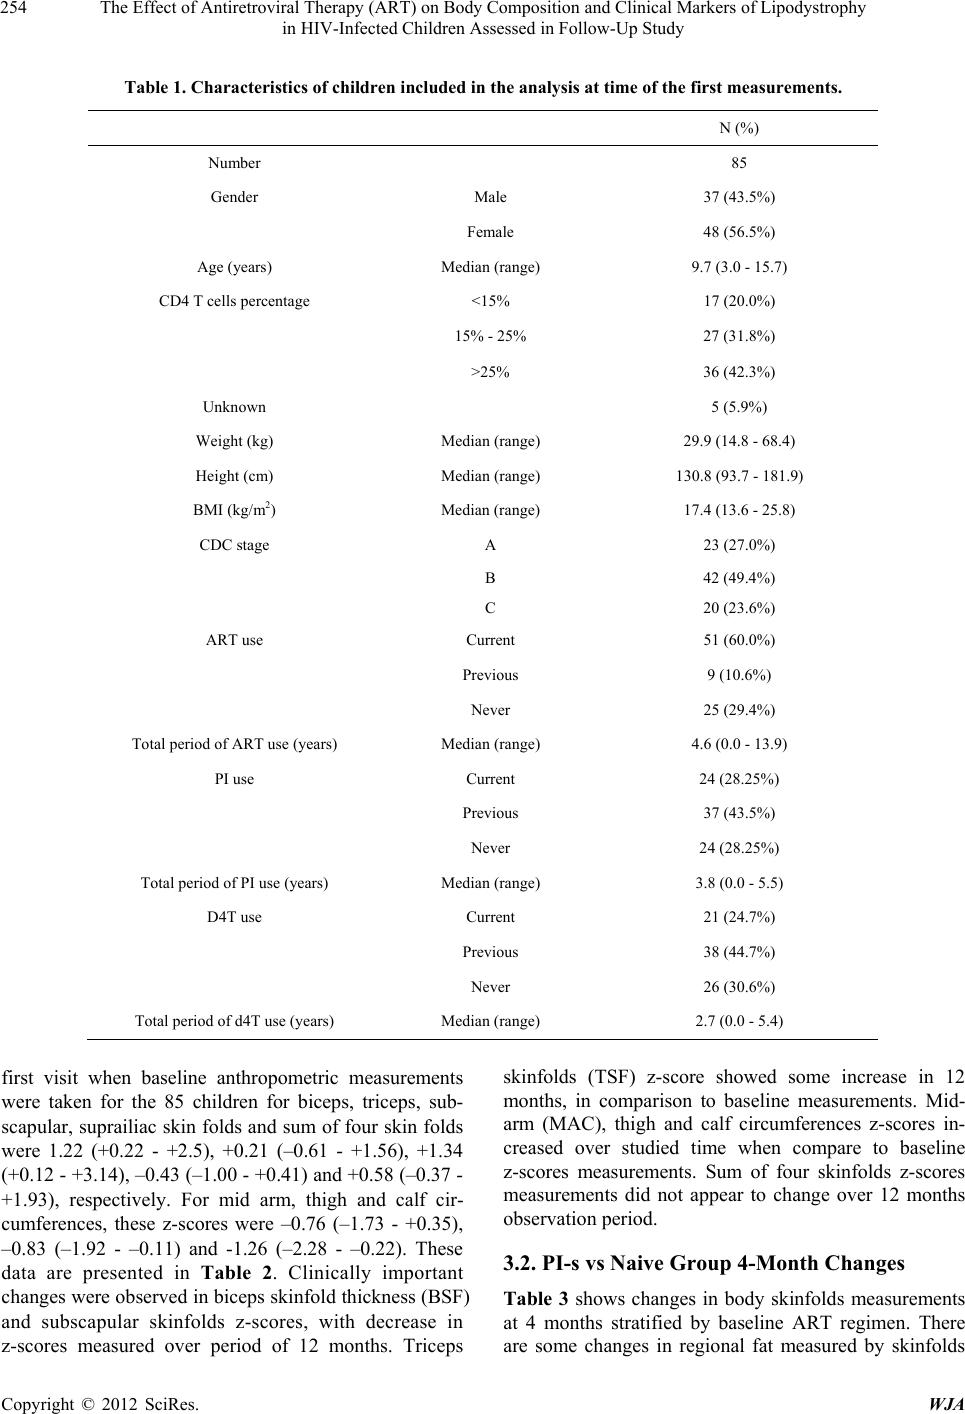 The Effect of Antiretroviral Therapy (ART) on Body Composition and Clinical Markers of Lipodystrophy in HIV-Infected Children Assessed in Follow-Up Study Copyright © 2012 SciRes. WJA 254 Table 1. Characteristics of children included in the analysis at time of the first measurements. N (%) Number 85 Gender Male 37 (43.5%) Female 48 (56.5%) Age (years) Median (range) 9.7 (3.0 - 15.7) CD4 T cells percentage <15% 17 (20.0%) 15% - 25% 27 (31.8%) >25% 36 (42.3%) Unknown 5 (5.9%) Weight (kg) Median (range) 29.9 (14.8 - 68.4) Height (cm) Median (range) 130.8 (93.7 - 181.9) BMI (kg/m2) Median (range) 17.4 (13.6 - 25.8) CDC stage A 23 (27.0%) B 42 (49.4%) C 20 (23.6%) ART use Current 51 (60.0%) Previous 9 (10.6%) Never 25 (29.4%) Total period of ART use (years) Median (range) 4.6 (0.0 - 13.9) PI use Current 24 (28.25%) Previous 37 (43.5%) Never 24 (28.25%) Total period of P I use (years) Median (range) 3.8 (0.0 - 5.5) D4T use Current 21 (24.7%) Previous 38 (44.7%) Never 26 (30.6%) Total period of d4T use (years) Median (range) 2.7 (0.0 - 5.4) first visit when baseline anthropometric measurements were taken for the 85 children for biceps, triceps, sub- scapular, suprailiac skin folds and sum of four skin folds were 1.22 (+0.22 - +2.5), +0.21 (–0.61 - +1.56), +1.34 (+0.12 - +3.14) , –0.43 (–1.00 - +0 .41) and +0.58 (–0 .37 - +1.93), respectively. For mid arm, thigh and calf cir- cumferences, these z-scores were –0.76 (–1.73 - +0.35), –0.83 (–1.92 - –0.11) and -1.26 (–2.28 - –0.22). These data are presented in Table 2. Clinically important changes were observed in biceps skinfold thickness (BSF) and subscapular skinfolds z-scores, with decrease in z-scores measured over period of 12 months. Triceps skinfolds (TSF) z-score showed some increase in 12 months, in comparison to baseline measurements. Mid- arm (MAC), thigh and calf circumferences z-scores in- creased over studied time when compare to baseline z-scores measurements. Sum of four skinfolds z-scores measurements did not appear to change over 12 months observation period. 3.2. PI-s vs Naive Group 4-Month Changes Table 3 shows changes in body skinfolds measurements at 4 months stratified by baseline ART regimen. There are some changes in regional fat measured by skinfolds 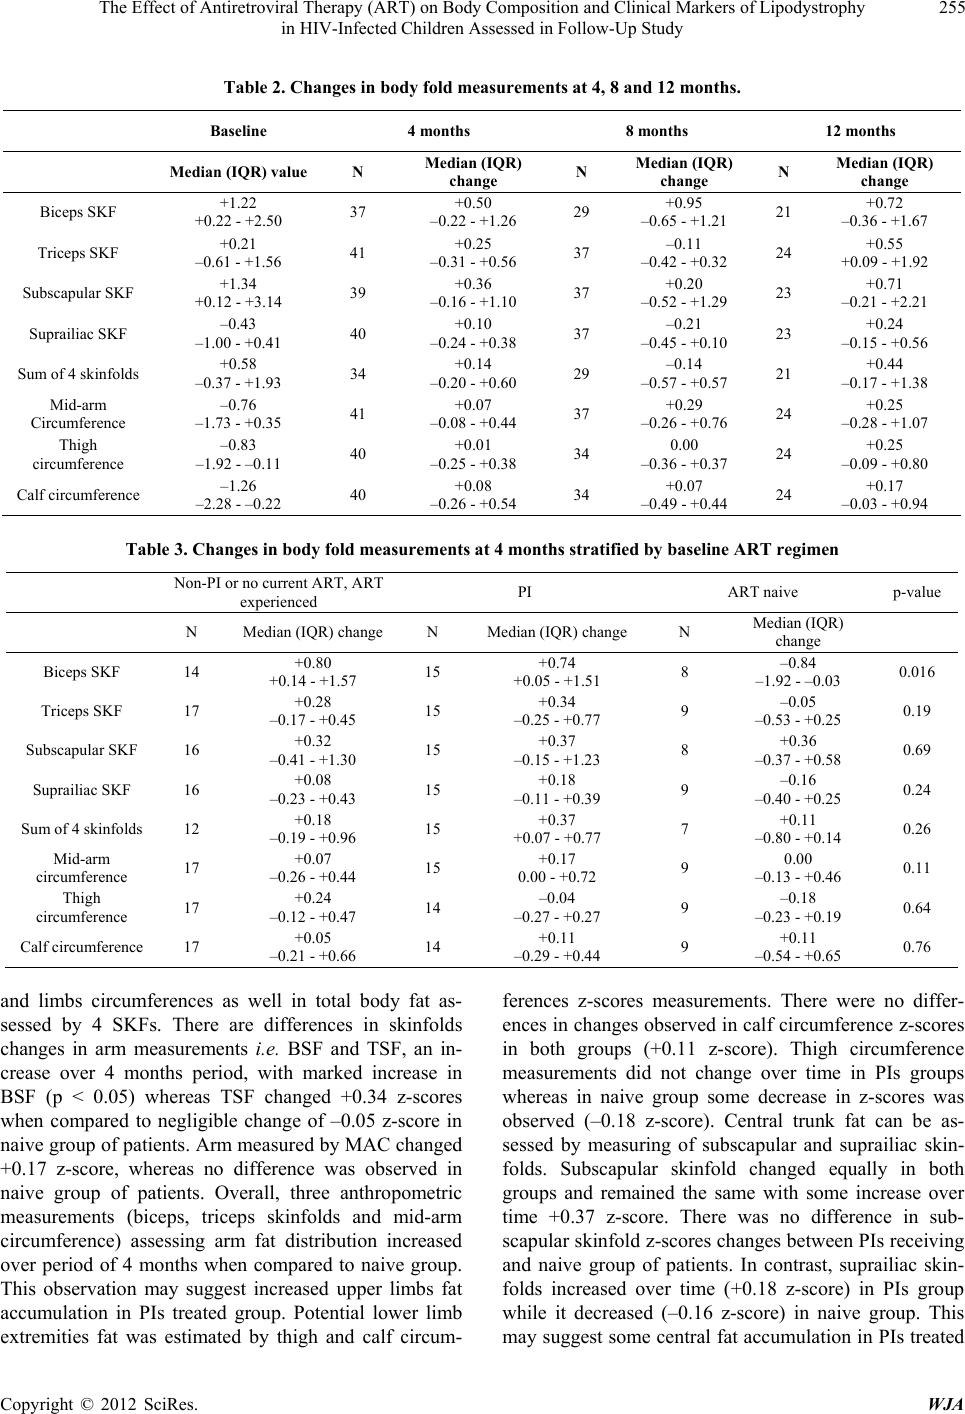 The Effect of Antiretroviral Therapy (ART) on Body Composition and Clinical Markers of Lipodystrophy in HIV-Infected Children Assessed in Follow-Up Study 255 Table 2. Changes in body fold measurements at 4, 8 and 12 months. Baseline 4 months 8 months 12 months Median (IQR) value N Median (IQR) change N Median (IQR) change N Median (IQR) change Biceps SKF +1.22 +0.22 - +2.50 37 +0.50 –0.22 - +1.26 29 +0.95 –0.65 - +1.21 21 +0.72 –0.36 - +1.67 Triceps SKF +0.21 –0.61 - +1.56 41 +0.25 –0.31 - +0.56 37 –0.11 –0.42 - +0.32 24 +0.55 +0.09 - +1.92 Subscapular SKF +1.34 +0.12 - +3.14 39 +0.36 –0.16 - +1.10 37 +0.20 –0.52 - +1.29 23 +0.71 –0.21 - +2.21 Suprailiac SKF –0.43 –1.00 - +0.41 40 +0.10 –0.24 - +0.38 37 –0.21 –0.45 - +0.10 23 +0.24 –0.15 - +0.56 Sum of 4 skinfolds +0.58 –0.37 - +1.93 34 +0.14 –0.20 - +0.60 29 –0.14 –0.57 - +0.57 21 +0.44 –0.17 - +1.38 Mid-arm Circumference –0.76 –1.73 - +0.35 41 +0.07 –0.08 - +0.44 37 +0.29 –0.26 - +0.76 24 +0.25 –0.28 - +1.07 Thigh circumference –0.83 –1.92 - –0.11 40 +0.01 –0.25 - +0.38 34 0.00 –0.36 - +0.37 24 +0.25 –0.09 - +0.80 Calf circumference –1.26 –2.28 - –0.22 40 +0.08 –0.26 - +0.54 34 +0.07 –0.49 - +0.44 24 +0.17 –0.03 - +0.94 Table 3. Changes in body fold measurements at 4 months stratified by baseline ART regimen Non-PI or no cur rent ART, ART experienced PI ART naive p-value N Median (IQR) change N Median (IQR) change N Median (IQR) change Biceps SKF 14 +0.80 +0.14 - +1.57 15 +0.74 +0.05 - +1.51 8 –0.84 –1.92 - –0.03 0.016 Triceps SKF 17 +0.28 –0.17 - +0.45 15 +0.34 –0.25 - +0.77 9 –0.05 –0.53 - +0.25 0.19 Subscapular SKF 16 +0.32 –0.41 - +1.30 15 +0.37 –0.15 - +1.23 8 +0.36 –0.37 - +0.58 0.69 Suprailiac SKF 16 +0.08 –0.23 - +0.43 15 +0.18 –0.11 - +0.39 9 –0.16 –0.40 - +0.25 0.24 Sum of 4 skinfolds 12 +0.18 –0.19 - +0.96 15 +0.37 +0.07 - +0.77 7 +0.11 –0.80 - +0.14 0.26 Mid-arm circumference 17 +0.07 –0.26 - +0.44 15 +0.17 0.00 - +0.72 9 0.00 –0.13 - +0.46 0.11 Thigh circumference 17 +0.24 –0.12 - +0.47 14 –0.04 –0.27 - +0.27 9 –0.18 –0.23 - +0.19 0.64 Calf circumference 17 +0.05 –0.21 - +0.66 14 +0.11 –0.29 - +0.44 9 +0.11 –0.54 - +0.65 0.76 and limbs circumferences as well in total body fat as- sessed by 4 SKFs. There are differences in skinfolds changes in arm measurements i.e. BSF and TSF, an in- crease over 4 months period, with marked increase in BSF (p < 0.05) whereas TSF changed +0.34 z-scores when compared to negligible change of –0.05 z-score in naive group of patients. Arm measured by MAC changed +0.17 z-score, whereas no difference was observed in naive group of patients. Overall, three anthropometric measurements (biceps, triceps skinfolds and mid-arm circumference) assessing arm fat distribution increased over period of 4 months when compared to naive group. This observation may suggest increased upper limbs fat accumulation in PIs treated group. Potential lower limb extremities fat was estimated by thigh and calf circum- ferences z-scores measurements. There were no differ- ences in changes observed in calf circumference z-scores in both groups (+0.11 z-score). Thigh circumference measurements did not change over time in PIs groups whereas in naive group some decrease in z-scores was observed (–0.18 z-score). Central trunk fat can be as- sessed by measuring of subscapular and suprailiac skin- folds. Subscapular skinfold changed equally in both groups and remained the same with some increase over time +0.37 z-score. There was no difference in sub- scapular skinfold z-scores changes between PIs receiving and naive group of patients. In contrast, suprailiac skin- folds increased over time (+0.18 z-score) in PIs group while it decreased (–0.16 z-score) in naive group. This may suggest some central fat accumulation in PIs treated Copyright © 2012 SciRes. WJA 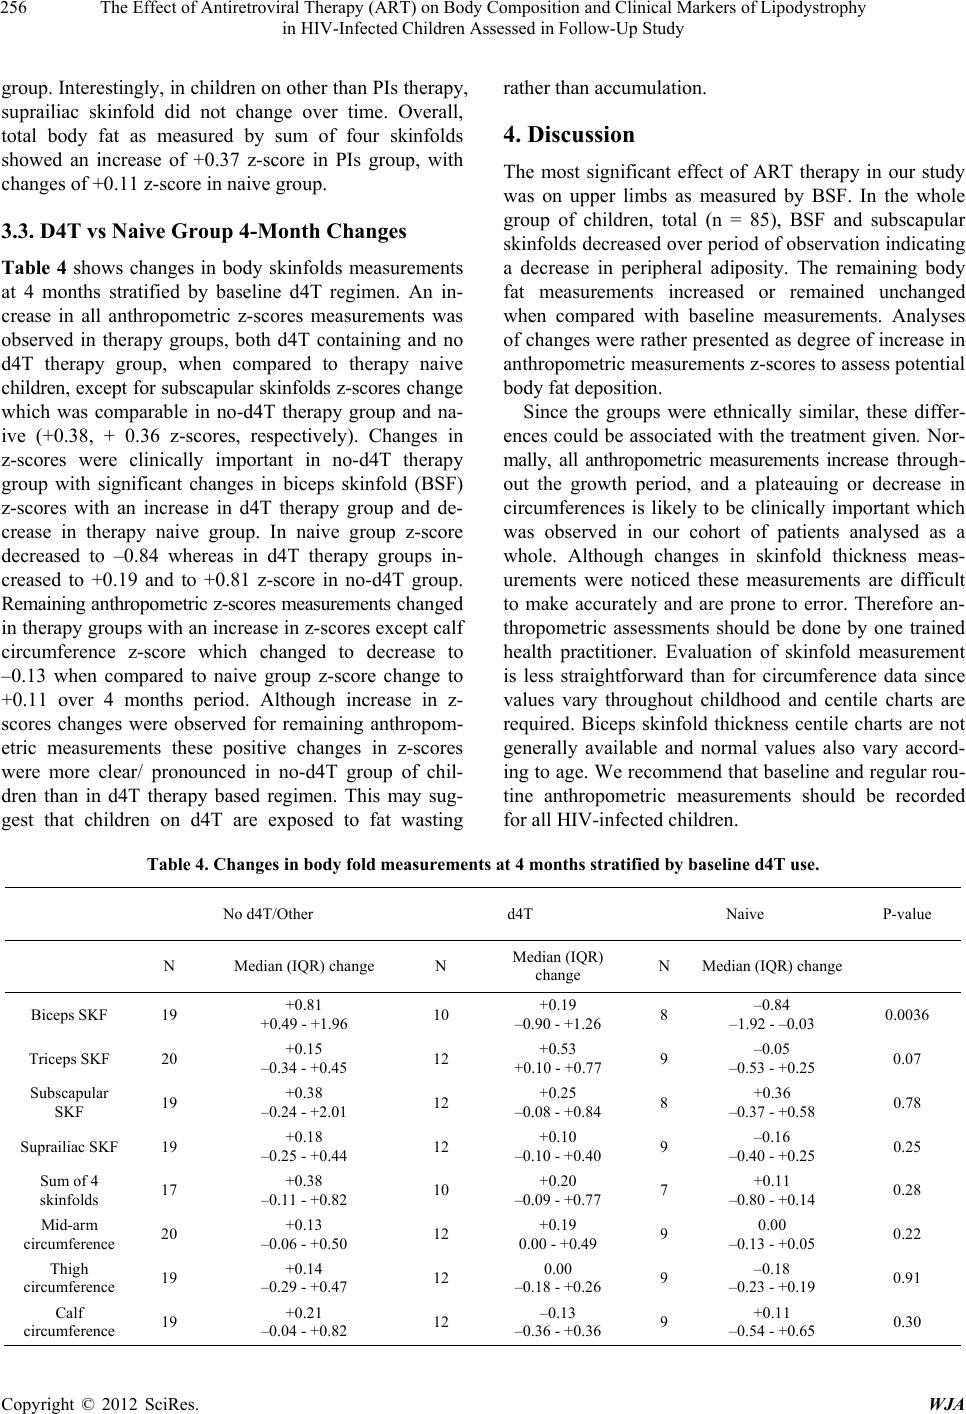 The Effect of Antiretroviral Therapy (ART) on Body Composition and Clinical Markers of Lipodystrophy in HIV-Infected Children Assessed in Follow-Up Study 256 group. Interestingly, in children on other than PIs therapy, suprailiac skinfold did not change over time. Overall, total body fat as measured by sum of four skinfolds showed an increase of +0.37 z-score in PIs group, with changes of +0.11 z-score in naive group. 3.3. D4T vs Naive Group 4-Month Changes Table 4 shows changes in body skinfolds measurements at 4 months stratified by baseline d4T regimen. An in- crease in all anthropometric z-scores measurements was observed in therapy groups, both d4T containing and no d4T therapy group, when compared to therapy naive children, except for subscapular skinfolds z-scores ch ange which was comparable in no-d4T therapy group and na- ive (+0.38, + 0.36 z-scores, respectively). Changes in z-scores were clinically important in no-d4T therapy group with significant changes in biceps skinfold (BSF) z-scores with an increase in d4T therapy group and de- crease in therapy naive group. In naive group z-score decreased to –0.84 whereas in d4T therapy groups in- creased to +0.19 and to +0.81 z-score in no-d4T group. Remaining anthropometric z-scores measurements ch an g ed in therapy group s with an increase in z-scores except calf circumference z-score which changed to decrease to –0.13 when compared to naive group z-score change to +0.11 over 4 months period. Although increase in z- scores changes were observed for remaining anthropom- etric measurements these positive changes in z-scores were more clear/ pronounced in no-d4T group of chil- dren than in d4T therapy based regimen. This may sug- gest that children on d4T are exposed to fat wasting rather than accumulation. 4. Discussion The most significant effect of ART therapy in our study was on upper limbs as measured by BSF. In the whole group of children, total (n = 85), BSF and subscapular skinfolds decreased over period of observation indicating a decrease in peripheral adiposity. The remaining body fat measurements increased or remained unchanged when compared with baseline measurements. Analyses of changes were rather presented as degree of increase in anthropometric measurements z-scores to assess potential body fat dep osition. Since the groups were ethnically similar, these differ- ences could be associated with the treatment given. Nor- mally, all anthropometric measurements increase through- out the growth period, and a plateauing or decrease in circumferences is likely to be clinically important which was observed in our cohort of patients analysed as a whole. Although changes in skinfold thickness meas- urements were noticed these measurements are difficult to make accurately and are prone to error. Therefore an- thropometric assessments should be done by one trained health practitioner. Evaluation of skinfold measurement is less straightforward than for circumference data since values vary throughout childhood and centile charts are required. Biceps skinfold thickness centile charts are not generally available and normal values also vary accord- ing to age. We recommend that baseline and regular rou- tine anthropometric measurements should be recorded for all HIV-infected children. Table 4. Changes in body fold measurements at 4 months stratified by baseline d4T use. No d4T/Other d4T Naive P-value N Median (IQR) change N Median (IQR) change N Median (IQR) change Biceps SKF 19 +0.81 +0.49 - +1.96 10 +0.19 –0.90 - +1.26 8 –0.84 –1.92 - –0.03 0.0036 Triceps SKF 20 +0.15 –0.34 - +0.45 12 +0.53 +0.10 - +0.77 9 –0.05 –0.53 - +0.25 0.07 Subscapular SKF 19 +0.38 –0.24 - +2.01 12 +0.25 –0.08 - +0.84 8 +0.36 –0.37 - +0.58 0.78 Suprailiac SKF 19 +0.18 –0.25 - +0.44 12 +0.10 –0.10 - +0.40 9 –0.16 –0.40 - +0.25 0.25 Sum of 4 skinfolds 17 +0.38 –0.11 - +0.82 10 +0.20 –0.09 - +0.77 7 +0.11 –0.80 - +0.14 0.28 Mid-arm circumference 20 +0.13 –0.06 - +0.50 12 +0.19 0.00 - +0.49 9 0.00 –0.13 - +0.05 0.22 Thigh circumference 19 +0.14 –0.29 - +0.47 12 0.00 –0.18 - +0.26 9 –0.18 –0.23 - +0.19 0.91 Calf circumference 19 +0.21 –0.04 - +0.82 12 –0.13 –0.36 - +0.36 9 +0.11 –0.54 - +0.65 0.30 Copyright © 2012 SciRes. WJA 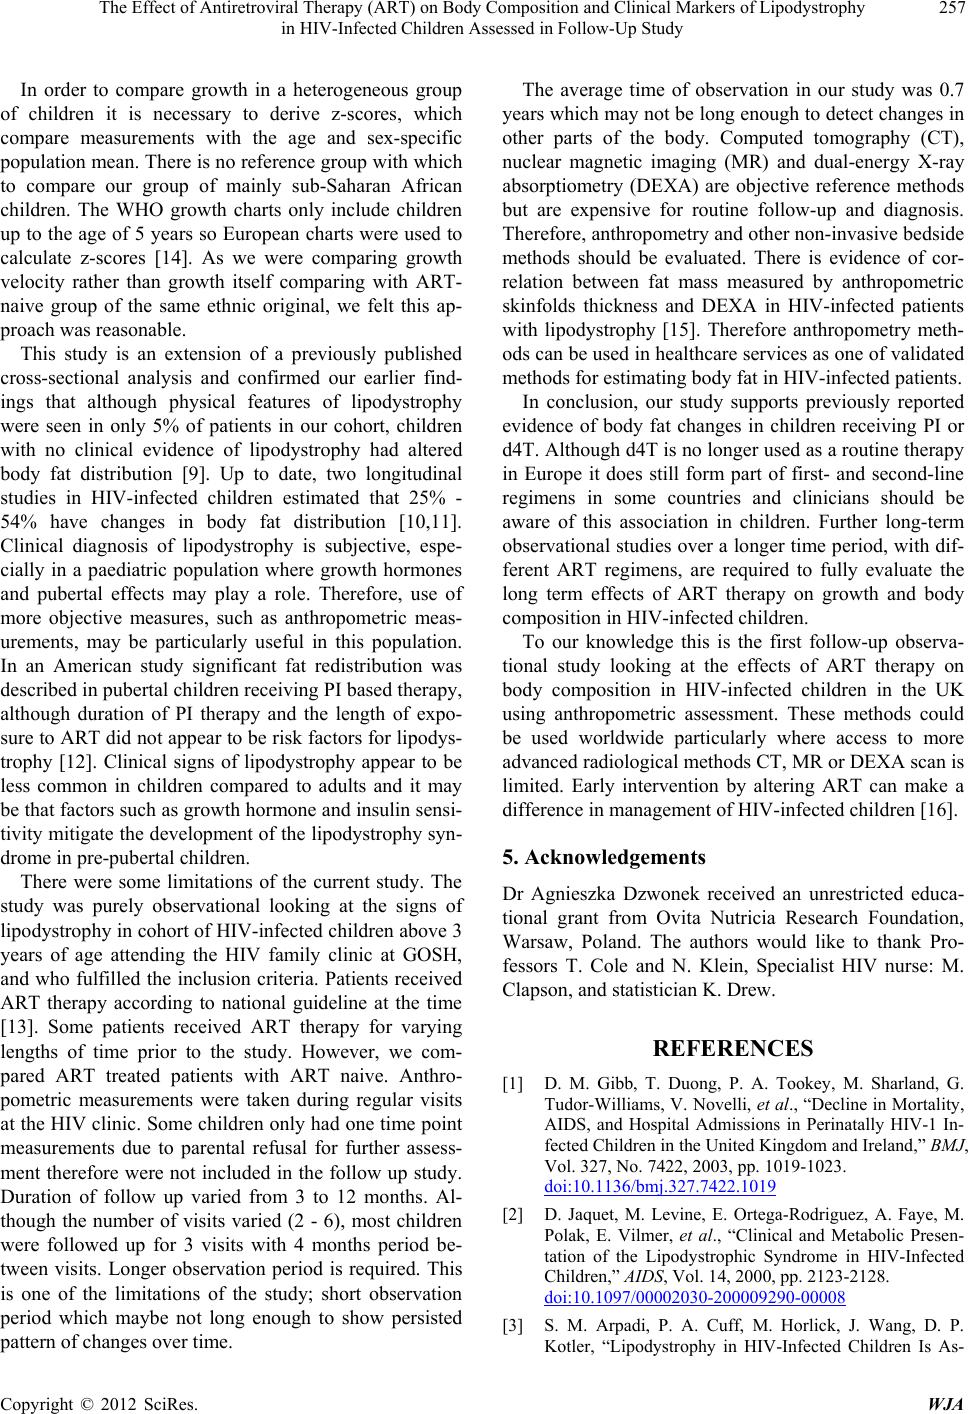 The Effect of Antiretroviral Therapy (ART) on Body Composition and Clinical Markers of Lipodystrophy in HIV-Infected Children Assessed in Follow-Up Study 257 In order to compare growth in a heterogeneous group of children it is necessary to derive z-scores, which compare measurements with the age and sex-specific population mean. Th ere is no reference group with which to compare our group of mainly sub-Saharan African children. The WHO growth charts only include children up to the age of 5 years so European charts were used to calculate z-scores [14]. As we were comparing growth velocity rather than growth itself comparing with ART- naive group of the same ethnic original, we felt this ap- proach wa s re asonabl e . This study is an extension of a previously published cross-sectional analysis and confirmed our earlier find- ings that although physical features of lipodystrophy were seen in only 5% of patients in our cohort, children with no clinical evidence of lipodystrophy had altered body fat distribution [9]. Up to date, two longitudinal studies in HIV-infected children estimated that 25% - 54% have changes in body fat distribution [10,11]. Clinical diagnosis of lipodystrophy is subjective, espe- cially in a paediatric population where growth hormones and pubertal effects may play a role. Therefore, use of more objective measures, such as anthropometric meas- urements, may be particularly useful in this population. In an American study significant fat redistribution was described in pubertal children receiving PI based therapy, although duration of PI therapy and the length of expo- sure to ART did not appear to be risk factors for lipodys- trophy [12]. Clinical signs of lipodystrophy appear to be less common in children compared to adults and it may be that factors such as growth hormone and insulin sensi- tivity mitigate the dev elopment of the lipodystrophy syn- drome in pre-pubertal children. There were some limitations of the current study. The study was purely observational looking at the signs of lipodystrophy in cohort of HIV-infected children above 3 years of age attending the HIV family clinic at GOSH, and who fulfilled the inclusion criteria. Patients received ART therapy according to national guideline at the time [13]. Some patients received ART therapy for varying lengths of time prior to the study. However, we com- pared ART treated patients with ART naive. Anthro- pometric measurements were taken during regular visits at the HIV clinic. Some children only had one time point measurements due to parental refusal for further assess- ment therefore were not included in the follow up study. Duration of follow up varied from 3 to 12 months. Al- though the number of visits varied (2 - 6), most children were followed up for 3 visits with 4 months period be- tween visits. Longer observation period is required. This is one of the limitations of the study; short observation period which maybe not long enough to show persisted pattern of changes over time. The average time of observation in our study was 0.7 years which may not be long enough to de tect changes in other parts of the body. Computed tomography (CT), nuclear magnetic imaging (MR) and dual-energy X-ray absorptiometry (DEXA) are objective reference methods but are expensive for routine follow-up and diagnosis. Therefore, anthropometry and other non-invasive bedside methods should be evaluated. There is evidence of cor- relation between fat mass measured by anthropometric skinfolds thickness and DEXA in HIV-infected patients with lipodystrophy [15]. Therefore anthropometry meth- ods can be used in healthcare services as one of validated methods for estimating body fat in HIV-infected patients. In conclusion, our study supports previously reported evidence of body fat changes in children receiving PI or d4T. Although d4T is no longer used as a routine th erapy in Europe it does still form part of first- and second-line regimens in some countries and clinicians should be aware of this association in children. Further long-term observational studies over a longer time period, with dif- ferent ART regimens, are required to fully evaluate the long term effects of ART therapy on growth and body composition in HIV-infected children. To our knowledge this is the first follow-up observa- tional study looking at the effects of ART therapy on body composition in HIV-infected children in the UK using anthropometric assessment. These methods could be used worldwide particularly where access to more advanced radiological methods CT, MR or DEXA scan is limited. Early intervention by altering ART can make a difference in management of HIV-infected children [16]. 5. Acknowledgements Dr Agnieszka Dzwonek received an unrestricted educa- tional grant from Ovita Nutricia Research Foundation, Warsaw, Poland. The authors would like to thank Pro- fessors T. Cole and N. Klein, Specialist HIV nurse: M. Clapson, and statistician K. Drew. REFERENCES [1] D. M. Gibb, T. Duong, P. A. Tookey, M. Sharland, G. Tudor-Williams, V. Novelli, et al., “Decline in Mortality, AIDS, and Hospital Admissions in Perinatally HIV-1 In- fected Children in the United Kingdom and Ireland,” BMJ, Vol. 327, No. 7422, 2003, pp. 1019-1023. doi:10.1136/bmj.327.7422.1019 [2] D. Jaquet, M. Levine, E. Ortega-Rodriguez, A. Faye, M. Polak, E. Vilmer, et al., “Clinical and Metabolic Presen- tation of the Lipodystrophic Syndrome in HIV-Infected Children,” AIDS, Vol. 14, 2000, pp. 2123-2128. doi:10.1097/00002030-200009290-00008 [3] S. M. Arpadi, P. A. Cuff, M. Horlick, J. Wang, D. P. Kotler, “Lipodystrophy in HIV-Infected Children Is As- Copyright © 2012 SciRes. WJA  The Effect of Antiretroviral Therapy (ART) on Body Composition and Clinical Markers of Lipodystrophy in HIV-Infected Children Assessed in Follow-Up Study 258 sociated with High Viral Load and Low CD4+ -Lym- phocyte Count and CD4+ -Lymphocyte Percentage at Baseline and Use of Protease Inhibitors and Stavudine,” Journal of Acquired Immune Deficiency Syndromes, Vol. 27, No. 1, 2001, pp. 30-34. [4] R. A. Amaya, C. A. Kozinetz, A. McMeans, H. Schwarz- wald and M. W. Kline, “Lipodystrophy Syndrome in Human Immunodeficiency Virus-Infected Children,” The Pediatric Infectious Disease Journal, Vol. 21, No. 5, 2002, pp. 405-410. doi:10.1097/00006454-200205000-00011 [5] A. Vigano, S. Mora, C. Testolin, S. Beccio, L. Schneider, D. Bricalli, et al., “Increased Lipodystrophy Is Associated with Increased Exposure to Highly Active Antiretroviral Therapy in HIV-Infected Children,” Journal of Acquired Immune Deficiency Syndromes, Vol. 32, No. 5, 2003, pp. 482-489. doi:10.1097/00126334-200304150-00003 [6] European Paediatric Lipodystrophy Group, “Antiretrovi- ral Therapy, Fat Redistribution and Hyperlipidaemia in HIV-Infected Children in Europe,” AIDS, Vol. 18, No. 10, 2004, pp. 1443-1451. doi:10.1097/01.aids.0000131334.38172.01 [7] E. G. Leonard and G. A. McComsey, “Metabolic Co mpli- cations of Antiretroviral Therapy in Children,” Pediatric Infectious Diseases Journal, Vol. 22, No. 1, 2003, pp. 77-84. doi:10.1097/00006454-200301000-00018 [8] N. Alam, M. Cortina-Borja, T. Goetghebuer, M. Marczy- nska, A. Vigano and C. Thorne, “For the European Pae- diatric HIV and Lipodystrophy Study Group in EuroCo- ord; Body Fat Abnormality in HIV-Infected Children and Adolescents Living in Europe: Prevalence and Risk Fac- tors,” Journal of Acquired Immune Deficiency Syndromes, Vol. 59, No. 3, 2012, pp. 314-324. doi:10.1097/QAI.0b013e31824330cb [9] A. B. Dzwonek, M. S. Lawson, T. J. Cole and V. Novelli, “Body Fat Changes and Lipodystrophy in HIV-Infected Children: Impact of Highly Active Antiretroviral Therapy,” Journal of Acquired Immune Deficiency Syndromes, Vol. 43, No. 1, 2006, pp. 121-123. doi:10.1097/01.qai.0000230523.94588.85 [10] M. Beregszaszi, C. Dollfus, M. Levine, A. Faye, S. Degh- moun, N. Bellal, et al., “Longitudinal Evaluation and Risk Factors of lipodystrophy and Associated Metabolic Changes in HIV-Infected Children,” Journal of Acquired Immune Deficiency Syndromes, Vol. 40, No. 2, 2005, pp. 161-168. doi:10.1097/01.qai.0000178930.93033.f2 [11] S. M. Arpadi, J. Bethel, M. Horlick, M. Sarr, M. Bamji, E. J. Abrams, et al., “Longitudinal Changes in Regional Fat Content in HIV-Infected Children and Adolescents,” AIDS, Vol. 23, No. 12, 2009, pp. 1501-1509. doi:10.1097/QAD.0b013e32832b7e69 [12] P. Taylor, C. Worrell, S. M. Steinberg, R. Hazra, S. Jankelevich, L. V. Wood, et al., “Natural History of Lipid Abnormalities and Fat Redistribution among Human Im- munodeficiency Virus-Infected Children Receiving Long- Term, Protease Inhibitor-Containing, Highly Active Anti- retroviral Therapy Regimens,” Pediatrics, Vol. 114, No. 2, 2004, pp. 235-242. doi:10.1542/peds.114.2.e235 [13] M. Sharland, S. Blanche, G. Castelli, J. Ramos and D. M. Gibb, “PENTA Guidelines for the Use of Antiretroviral Therapy, 2004,” HIV Medicine, Vol. 5, Suppl. 2, 2004, pp. 61-86. doi:10.1111/j.1468-1293.2004.00227.x [14] W. J. Gerver and R. Bruin, “ Paediatric Morphometrics. A Reference Manual,” 2nd Edition, Universitaire Pers Maa- stricht, Maastricht, 2001. [15] A. A. Florindo, R. Latorre Mdo, E. C. Santos, A. Borelli, S. R. Mde and A. A. Segurado, “Validation of Methods for Estimating HIV/AIDS Patients’ Body Fat,” Revista de Saude Publica, Vol. 38, No. 5, 2004, pp. 643-649. doi:10.1590/S0034-89102004000500005 [16] R. Singhania and D. P. Kotler, “Lipodystrophy in HIV Patients: Its Challenges and Management Approaches,” HIV AIDS (Auckland, NZ), Vol. 3, 2011, pp. 135-143. Copyright © 2012 SciRes. WJA |