

Paper Menu >>
Journal Menu >>
 Open Journal of Genetics, 2012, 2, 131-135 OJGen http://dx.doi.org/10.4236/ojgen.2012.23018 Published Online September 2012 (http://www.SciRP.org/journal/ojgen/) Exploring correlations among copy number variants Joseph Abraham1*, Thomas LaFramboise2 1Programa do Pós Graduação em Genética, Faculdade de Medicina de Ribeirão Preto, Universidade de São Paulo, Ribeirão Preto, Brazil 2Department of Genetics, Case Western Reserve University, Cleveland, USA Email: *[email protected] Received 16 May 2012; revised 16 June 2012; accepted 6 July 2012 ABSTRACT There have been a great many recent studies investi- gating the extent of Copy Number Variation in the genomes of various species such as human, cattle, dogs and many others. The results from these studies indicate that the extent of the Copy Number Varia- tion in the genome is considerable, and that in hu- mans and in cattle, frequencies of different Copy Number Variants may differ in different breeds/eth- nicities. This is not entirely unexpected as allele fre- quencies of certain loci vary with different breeds/ ethnicities/species and many known Copy Number Variants behave similarly to ordinary markers as regards Mendelian segregation. It is also well known in many instances, species/breeds/ethnicities show variation not only in marker allele frequencies, but also in the extent of Linkage Disequilibrium between markers. Thus it is worth investigating the extent of association between Copy Number Variants in dif- ferent populations. In this paper we will investigate the extent of correlations between selected Copy Number Variants in different human populations and show that statistically significant correlations exist and are strongly population dependent. Keywords: Copy Number Variant; Pathway; Selection 1. INTRODUCTION Over the past several years the genome sequences of many species have been investigated in increasing detail and with increasing precision. As a result much is now known about the extent of variation in the genome se- quences between different individuals belonging to the same species. In particular it is known that there is, in addition to point variation, also considerable structural variation in the genome. One particular structural variant which has attracted a lot of attention is Copy Number Variation (CNV) [1-3] which can be interpreted as DNA mutations arising from a gain or loss of a certain number of contiguous base pairs during meioses. The distribution of CNVs in the human genome is not random, and at- tempts have been made to understand the evolutionary events which account for the locations of Copy Number Variants [4] along with the population genetics aspects of Copy Number Variants [5,6]. In addition in humans the association between Copy Number Variants and gene expression level [7] has been studied, as well as the as- sociation between Copy Number Variation and a number of diseases of interest [8]. Apart from humans, Copy Number Variation has been studied in a number of other species such as cattle [9], chimpanzee [10], fruitfly [11] among others. These studies have not only elucidated the range and extent of Copy Number Variation, studies in cattle [9] have also shown a clear association between certain Copy Number Variants and breeds. Based on these studies it is worth taking a closer look at the con- nection between Copy Number Variation and ancestry in humans. In this regard it is worth recalling that not only marker allele frequencies but also the extent of Linkage Disequilibrium between markers varies with ancestry, for example Linkage Disequilibrium in African populations typically extends over a shorter range than in European and Asian populations. This suggests that the extent of statistical correlations between Copy Number Variants could vary in different populations. It is this issue which is the main focus of this paper. In order to investigate this question, what is needed is a catalogue of Copy Number Variants observed in multiple unrelated individuals in different populations. The copy number catalogue we will use is in [12] where different Copy Number Variants are typed in a number of indi- viduals in various HapMap populations. The catalogue in [12] contains information on 1320 Copy Number Variants with a minor allele frequency larger than 1%, referred to from now on as Copy Number Polymorhpisms (CNPs) to analyze differences between populations. 2. MATERIALS AND METHODS The data in [12] consist of records of over a thousand *Corresponding author. OPEN ACCESS 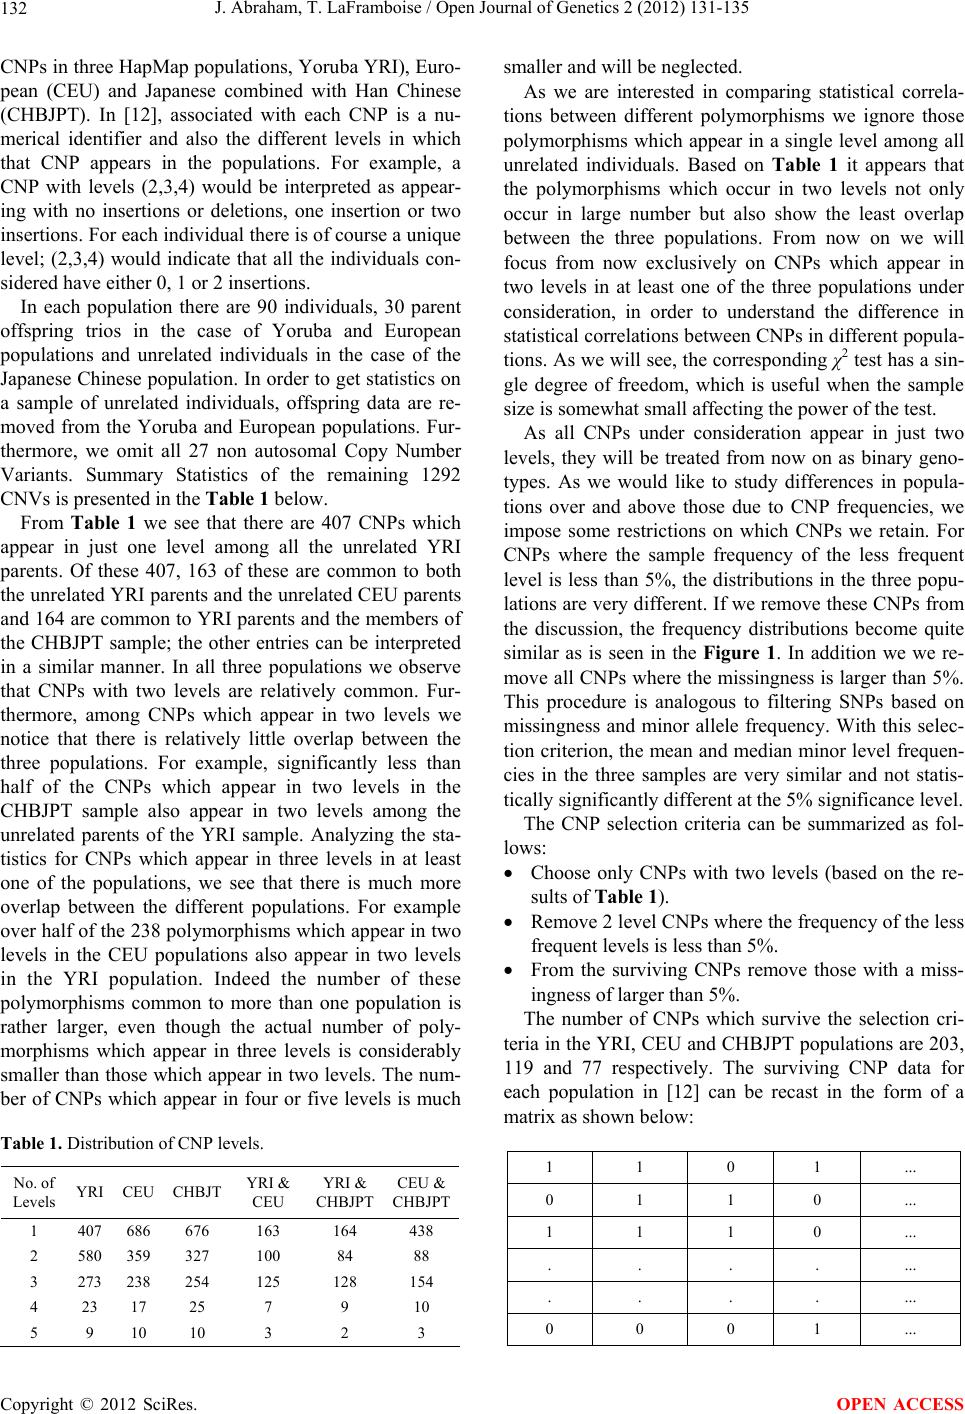 J. Abraham, T. LaFramboise / Open Journal of Genetics 2 (2012) 131-135 132 CNPs in three HapMap populations, Yoruba YRI), Euro- pean (CEU) and Japanese combined with Han Chinese (CHBJPT). In [12], associated with each CNP is a nu- merical identifier and also the different levels in which that CNP appears in the populations. For example, a CNP with levels (2,3,4) would be interpreted as appear- ing with no insertions or deletions, one insertion or two insertions. For each individual there is of course a unique level; (2,3,4) would indicate that all the individuals con- sidered have either 0, 1 or 2 insertions. In each population there are 90 individuals, 30 parent offspring trios in the case of Yoruba and European populations and unrelated individuals in the case of the Japanese Chinese population. In order to get statistics on a sample of unrelated individuals, offspring data are re- moved from the Yoruba and European populations. Fur- thermore, we omit all 27 non autosomal Copy Number Variants. Summary Statistics of the remaining 1292 CNVs is presented in the Table 1 below. From Table 1 we see that there are 407 CNPs which appear in just one level among all the unrelated YRI parents. Of these 407, 163 of these are common to both the unrelated YRI parents and the unrelated CEU parents and 164 are common to YRI parents and the members of the CHBJPT sample; the other entries can be interpreted in a similar manner. In all three populations we observe that CNPs with two levels are relatively common. Fur- thermore, among CNPs which appear in two levels we notice that there is relatively little overlap between the three populations. For example, significantly less than half of the CNPs which appear in two levels in the CHBJPT sample also appear in two levels among the unrelated parents of the YRI sample. Analyzing the sta- tistics for CNPs which appear in three levels in at least one of the populations, we see that there is much more overlap between the different populations. For example over half of the 238 polymorphisms which appear in two levels in the CEU populations also appear in two levels in the YRI population. Indeed the number of these polymorphisms common to more than one population is rather larger, even though the actual number of poly- morphisms which appear in three levels is considerably smaller than those which appear in two levels. The num- ber of CNPs which appear in four or five levels is much Table 1. Distribution of CNP levels. No. of Levels YRI CEU CHBJT YRI & CEU YRI & CHBJPT CEU & CHBJPT 1 407 686 676 163 164 438 2 580 359 327 100 84 88 3 273 238 254 125 128 154 4 23 17 25 7 9 10 5 9 10 10 3 2 3 smaller and will be neglected. As we are interested in comparing statistical correla- tions between different polymorphisms we ignore those polymorphisms which appear in a single level among all unrelated individuals. Based on Table 1 it appears that the polymorphisms which occur in two levels not only occur in large number but also show the least overlap between the three populations. From now on we will focus from now exclusively on CNPs which appear in two levels in at least one of the three populations under consideration, in order to understand the difference in statistical correlations between CNPs in different popula- tions. As we will see, the corresponding χ2 test has a sin- gle degree of freedom, which is useful when the sample size is somewhat small affecting the power of the test. As all CNPs under consideration appear in just two levels, they will be treated from now on as binary geno- types. As we would like to study differences in popula- tions over and above those due to CNP frequencies, we impose some restrictions on which CNPs we retain. For CNPs where the sample frequency of the less frequent level is less than 5%, the distributions in the three popu- lations are very different. If we remove these CNPs from the discussion, the frequency distributions become quite similar as is seen in the Figure 1. In addition we we re- move all CNPs where the missingness is larger than 5%. This procedure is analogous to filtering SNPs based on missingness and minor allele frequency. With this selec- tion criterion, the mean and median minor level frequen- cies in the three samples are very similar and not statis- tically significantly different at the 5% significance level. The CNP selection criteria can be summarized as fol- lows: Choose only CNPs with two levels (based on the re- sults of Table 1). Remove 2 level CNPs where the frequency of the less frequent levels is less than 5%. From the surviving CNPs remove those with a miss- ingness of larger than 5%. The number of CNPs which survive the selection cri- teria in the YRI, CEU and CHBJPT populations are 203, 119 and 77 respectively. The surviving CNP data for each population in [12] can be recast in the form of a matrix as shown below: 1 1 0 1 ... 0 1 1 0 ... 1 1 1 0 ... . . . . ... . . . . ... 0 0 0 1 ... Copyright © 2012 SciRes. OPEN ACCESS 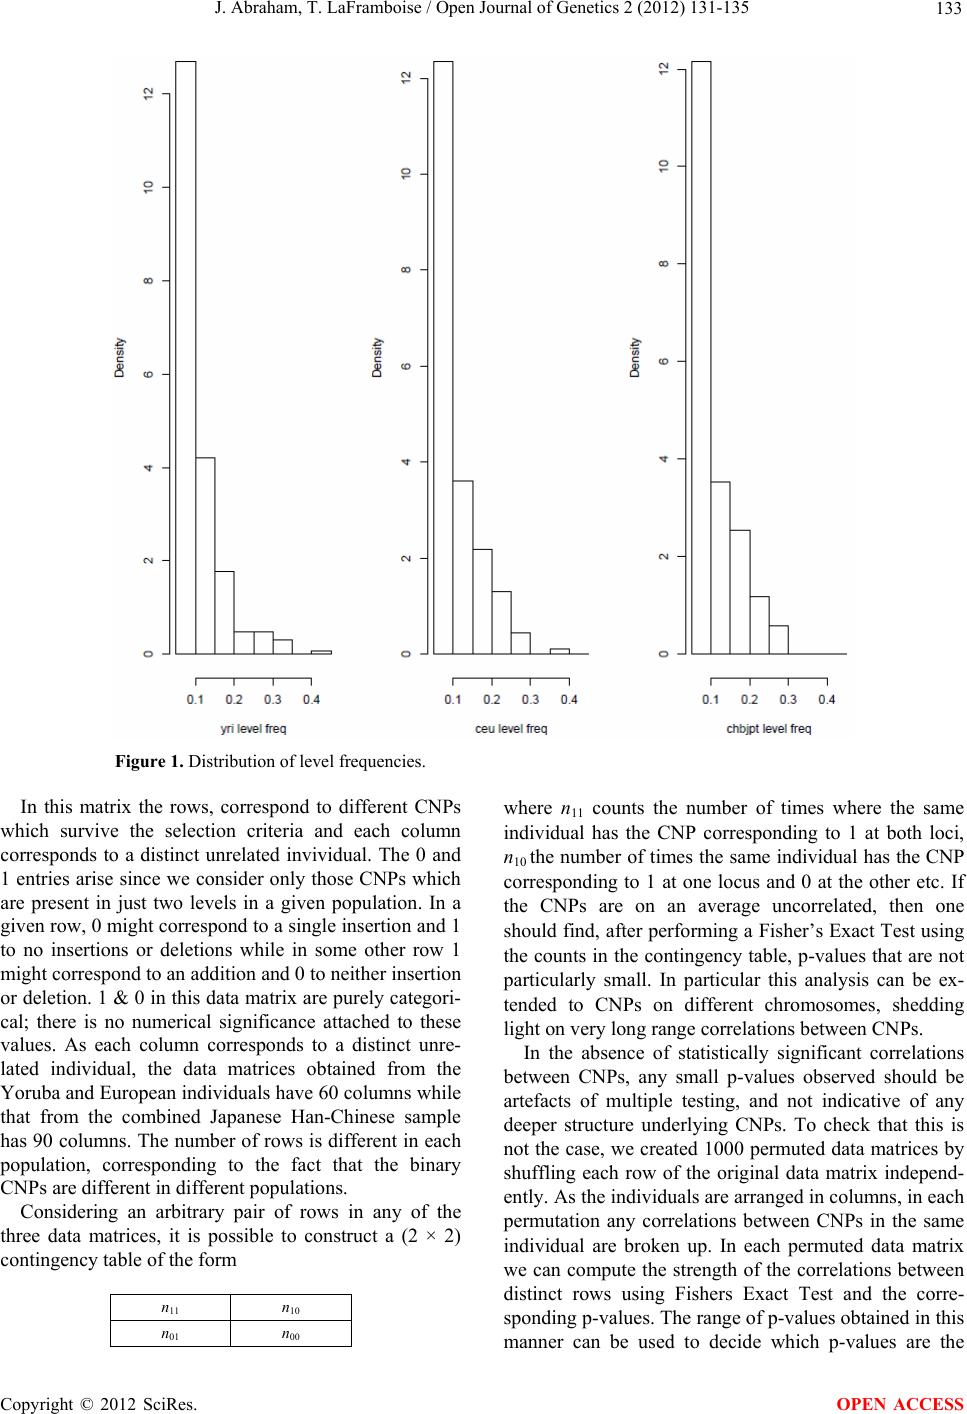 J. Abraham, T. LaFramboise / Open Journal of Genetics 2 (2012) 131-135 Copyright © 2012 SciRes. 133 Figure 1. Distribution of level frequencies. In this matrix the rows, correspond to different CNPs which survive the selection criteria and each column corresponds to a distinct unrelated invividual. The 0 and 1 entries arise since we consider only those CNPs which are present in just two levels in a given population. In a given row, 0 might correspond to a single insertion and 1 to no insertions or deletions while in some other row 1 might correspond to an addition and 0 to neither insertion or deletion. 1 & 0 in this data matrix are purely categori- cal; there is no numerical significance attached to these values. As each column corresponds to a distinct unre- lated individual, the data matrices obtained from the Yoruba and European individuals have 60 columns while that from the combined Japanese Han-Chinese sample has 90 columns. The number of rows is different in each population, corresponding to the fact that the binary CNPs are different in different populations. where n11 counts the number of times where the same individual has the CNP corresponding to 1 at both loci, n10 the number of times the same individual has the CNP corresponding to 1 at one locus and 0 at the other etc. If the CNPs are on an average uncorrelated, then one should find, after performing a Fisher’s Exact Test using the counts in the contingency table, p-values that are not particularly small. In particular this analysis can be ex- tended to CNPs on different chromosomes, shedding light on very long range correlations between CNPs. In the absence of statistically significant correlations between CNPs, any small p-values observed should be artefacts of multiple testing, and not indicative of any deeper structure underlying CNPs. To check that this is not the case, we created 1000 permuted data matrices by shuffling each row of the original data matrix independ- ently. As the individuals are arranged in columns, in each permutation any correlations between CNPs in the same individual are broken up. In each permuted data matrix we can compute the strength of the correlations between distinct rows using Fishers Exact Test and the corre- sponding p-values. The range of p-values obtained in this manner can be used to decide which p-values are the Considering an arbitrary pair of rows in any of the three data matrices, it is possible to construct a (2 × 2) contingency table of the form n11 n10 n01 n00 OPEN ACCESS  J. Abraham, T. LaFramboise / Open Journal of Genetics 2 (2012) 131-135 134 consequence of multiple testing. 3. RESULTS The analysis described in the previous section was per- formed on all three data sets. For a preliminary analysis of the difference between the populations we focused on p-values less than 0.005 and on correlations between CNPs in different chromosomes. If the chromosomes are different then the CNPs may be considered to be truly independent and any correlation found is an indication of the nonrandom nature of Copy Number Variants. It was found that there were 33 such p-values in the YRI popu- lation, 5 p-values in the CEU population and just 3 in the CHBJPT population. The range of p-values is also dif- ferent, in the YRI population the lowest p-value is 1.678 × 10⁻⁶, in the CEU population it is 1.127 × 10⁻³ and in the CHBJPT population it is 1.169 × 10⁻³. It is also noteworthy that the 7 lowest p-values in the YRI analysis are smaller than the smallest p-values in the other popu- lations. This is suggestive of the possibility that the cor- relation structure between CNPs differs in different populations. However, this might just be due to the fact that the number of tests performed is much larger in the YRI population than in the other two populations. To rule out this possibility, the permutation test as de- scribed in the previous section was carried out; to be conservative in the permuted tests correlations between CNPs both in the same chromosome and in different chromosomes were included to decide which small p-values could possibly be the consequence of multiple testing. Assuming a significance level of 0.05, none of the associations found in the CEU and CHBJPT sample were, significant after compensating for multiple testing. However, the most significant association found in the YRI sample (p-value 1.678 × 10⁻⁶) remained significant with a p-value of < 0.02 even after taking into account multiple testing. This association is between polymor- phisms on chromosome 6 (hg17 coordinates 202,353 to 326,149) and on chromosome 16 (hg 17 coordinates 33,208,395 to 33,618,281) with minor level frequencies of 0.1 and 0.15. Such minor level frequencies are not atypical of the other two populations, what distinguishes these two CNPs in the YRI sample is the extent to which Copy Numbers at these locations are correlated. These CNPs have identifiers 902 & 2172 in [12]. Using 2 as the baseline for defining no extra copies in [12] all the YRI individuals could be considered have either one or two extra copies at these locations. In the YRI population unrelated individuals with two extra copies at one loca- tion tend to have two extra copies at the other location. 4. DISCUSSION Based on the discussion of the previous section we have evidence for correlations in Copy Number Variants which are statistically significant, and whose statistical significance varies from population to population. This represents a novel approach for analyzing Copy Number Variants in the same population as well as for the con- trasting the patterns of copy number variation in different populations. Our methodology is conceptually similar to using the structure of observed Linkage Disequilibrium between markers and not just marker allele frequencies in order to compare different populations. Furthermore, the only significant long range correlations between CNPs were found in the population where LD between markers has the shortest range. It is also interesting to note that no correlations of any significance were found in the largest of all the samples, the CHBJPT sample. This is not what one would expect if significant p-values were determined only by sample sizes. Thus the differ- ences observed between populations cannot be due to different sample sizes, but may have their origins in the differences in population histories. In Drosophila mela- nogaster for example the pattern of Copy Number Varia- tion is influenced by natural selection [11]. Selection can also give rise to long range correlations between markers [14]; this suggests that the strong correlations observed in the YRI population could be driven by population ge- netic events unique to that population. In this regard, it is noteworthy that the region on chromosome 6 that we identified overlaps with the location of the DUSP22 gene which participates in the JnK signalling pathway [15] whose role in cancer proliferation [16] is well docu- mented. Any possible signals of selection in this region region would be of considerable interest and worthy of further study. 5. ACKNOWLEDGEMENTS KJA was supported during the course of this investigation by the United States Department of Agriculture, National Research Iniative Grant USDA NRI-2009-03924 and also by the program Professor Visitante do Exterior of Coordenação de Aperfeiçoamento de Pessoal de Nível Superior (CAPES), Brasil. In addition, KJA wishes to thank Prof. Cheryl Thompson for valuable and encouraging discussions. REFERENCES [1] Sebat, J., Lakshmi, B., Troge, J., et al. (2004) Large-scale copy number polymorphism in the human genome. Sci- ence, 316, 445-449. doi:10.1126/science.1138659 [2] Iafrate, A.J., Feuk, L., Rivera, M.N., et al. (2004) Detec- tion of large-scale variation in the human genome. Nature Genetics, 36, 949-951. doi:10.1038/ng1416 [3] Feuk, L., Carson, A.R. and Scherer, S.W. (2006) Struc- tural variation in the human genome. Nature Review Ge- netics, 7, 85-97. [4] Cooper, G.M., Nickerson, D.A. and Eichler, E.E. (2007) Copyright © 2012 SciRes. OPEN ACCESS  J. Abraham, T. LaFramboise / Open Journal of Genetics 2 (2012) 131-135 Copyright © 2012 SciRes. 135 OPEN ACCESS Mutational and selective effects on copy-number variants in the human genome. Nature Genetics, 39, S22-S29. doi:10.1038/ng2054 [5] Campbell, C.D., Sampas, N., Tsalenko, A., et al. (2011) Population-genetic properties of differentiated human copy- number polymorphisms. American Journal of Human Ge- netics, 88, 317-332. doi:10.1016/j.ajhg.2011.02.004 [6] Mills, R.E., Walter, K., Stewart, C., et al. (2011) Map- ping copy number variation by population-scale genome sequencing. Nature, 470, 59-65. doi:10.1038/nature09708 [7] Stranger, B.E., Forrest, M.S. and Dunning, M. (2007) Relative impact of nucleotide and copy number variation on gene expression phenotypes. Science, 315, 849-853. doi:10.1126/science.1136678 [8] McCarroll, S.A. and Altshuler, D.M. (2007) Copy num- ber variation and association studies of human disease. Nature Genetics, 39, S37-S42. doi:10.1038/ng2080 [9] George, E.L., Hou, Y.L., Zhu, B., et al. (2010) Analysis of copy number variations among diverse cattle breeds. Genome Research, 20, 693-703. doi:10.1101/gr.105403.110 [10] Perry, G.H., Yang, F., Marques-Bonet, T., et al. (2008) Copy number variation and evolution in humans and chimpanzees. Genome Research, 18, 1698-1710. doi:10.1101/gr.082016.108 [11] Emerson, J.J., Cardoso-Moreira, M., Borevitz, J.O. and Long, M. (2008) Natural selection shapes genome-wide patterns of copy-number polymorphism in Drosophila melanogaster. Science, 320, 1629-1631. doi:10.1126/science.1158078 [12] McCarroll, S.A., Kuruvilla, F.G., Korn, J.M., et al. (2008) Integrated detection and population-genetic analysis of SNPs and copy number variation. Nature Genetics, 40, 1166-1174. doi:10.1038/ng.238 [13] Redon, R., Ishikawa, S. and Fitch, K.R. (2006) Global variation in copy number in the human genome. Nature, 444, 444-454. doi:10.1038/nature05329 [14] Walsh, B. (2003) Population and quantitative-genetic models of selection limits. In: Janick, J., Ed., Plant Breed- ing Reviews: Long Term Selection Maize: Maize, Vol. 24, Purdue University, West Lafayette. [15] Shen, Y., Luche, R., Wei, B., Gordon, M.L., Diltz, C.D. and Tonks, N.K. (2001) Activation of the Jnk signaling pathway by a dual-specificity phosphatase, JSP-1. Pro- ceedings of the National Academy of Sciences, 98, 13613- 13618. doi:10.1073/pnas.231499098 [16] Wagner, E.F. and Nebreda, A.R. (2009) Signal integra- tion by JNK and p38 MAPK pathways in cancer devel- opment. Nature Genetics Reviews, 9, 537-549. doi:10.1038/nrc2694 |