

Paper Menu >>
Journal Menu >>
 Open Journal of Obstetrics and Gynecology, 2012, 2, 183-191 OJOG http://dx.doi.org/10.4236/ojog.2012.23037 Published Online September 2012 (http://www.SciRP.org/journal/ojog/) Development of an instrument to identify symptoms potentially indicative of ovarian cancer in a primary care clinic setting* M. Robyn Andersen1,2#, Barbara A. Goff2,3, Kimberly A. Lowe1,4 1Molecular Diagnostics Program, Fred Hutchinson Cancer Research Center, Seattle, USA 2School of Public Health, University of Washington, Seattle, USA 3Seattle Cancer Care Alliance, Seattle, USA 4Exponent Health Sciences, Seattle, USA Email: #[email protected] Received 7 June 2012; revised 9 July 2012; accepted 17 July 2012 ABSTRACT Background: Several recently published studies sug- gest that screening for symptoms could improve the early diagnosis of ovarian cancer. This report de- scribes the development of a simple and reliable method of collecting symptom information in a pri- mary care clinic. Methods: 1200 women, ages 40 - 87, completed several versions of a draft symptom index (SI) assessment form during their visits to a primary care clinic. Factors associated with a positive SI result were examined. Providers were surveyed about ac- ceptability of the symptom screening procedures. Findings: Variation in the instructions provided to women influenced the rate at which women indicated having symptoms indicative of a positive SI, 5% had positive results when written instructions emphasized listing only current symptoms. Women coming to the clinic because of a current medical concern or problem did have higher rates of positive SI results, as did non-white women (p < 0.05). Acceptability by providers was high. Patients could independently complete the SI in 5 minutes. One patient with a positive SI was diagnosed with ovarian cancer and none with a negative SI developed cancer. Inter- pretation: A quick paper and pencil form can be used to identify women with symptoms potentially indicative of ovarian cancer. Use of such a form for ovarian cancer screening purposes is acceptable to most women and providers in a primary care clinic setting. Keywords: Ovarian Cancer; Symptoms 1. INTRODUCTION Two recent prospective studies suggest that efforts to identify women with symptoms and assure prompt as- sessment for ovarian cancer using currently available tests (CA-125 and TVS) could result in earlier diagnosis of ovarian cancer [1,2]. Consistent with evidence to sug- gest that women with ovarian cancer present with symp- toms, even when the disease is in its early stages [3-8], and advice from the Gynecologic Cancer Foundation, the Society of Gynecologic Oncologists and the American Cancer Society [9], and a statement by NICE (National Institute for Health and Clinical Excellence) [10] en- couraging follow-up of women reporting symptoms. Studies using other methods also suggest that assessment of women with symptoms could reduce time to diagnosis [11,12]. Unfortunately, symptoms that may be indicative of ovarian cancer can be caused by a variety of other conditions. The key to identifying symptoms signaling ovarian cancer appears to be that they are new to a woman and occur frequently [13,14]. In an effort to iden- tify women with symptoms that may be indicative of ovarian cancer and create reliable algorithms for assess- ment of symptoms necessary for serious study of their potential, we have proposed a decision rule that we call a “Symptom Index” [13,15]. The Symptom Index (SI) is considered positive if women are currently experiencing any one or more of six specific symptoms that are present for less than one year and occur more than 12 times a month. These symptoms include bloating, increased abdominal size, pelvic or abdominal pain, difficulty eating, and feeling full quickly. A case-control study has shown that 57% of women with early stage ovarian cancer and 80% of women with ad- vanced ovarian cancer report symptoms that follow this distinctive pattern at the time of their diagnosis [13]; symptoms in conjunction with other bio-markers may *This project was supported by grant number R21NR010571 from the N ational Institute of Nursing Research. #Corresponding author. OPEN ACCESS  M. R. Andersen et al. / Open Journal of Obstetrics and Gynecology 2 (2012) 183-191 184 have a role in earlier diagnosis of ovarian cancer [16]. This report provides preliminary results from a pilot study using a standardized form to prospectively collect SI information at a primary care clinic. The goals of this pilot study were to determine valid methods for the pro- spective collection of the SI and to assess the feasibility and acceptability such assessments at a primary care visit. We also sought to understand what factors other than ovarian cancer may result in a positive SI. 2. MATERIALS AND METHODS This pilot effort was conducted at a Women’s Health clinic in an urban setting as part of an integrated system of medical centers. This clinic provides both primary care and referral for a group of neighborhood clinics. The clinic performs approximately 24,000 visits annually for 11,500 unique patients. Women were eligible for the study if they were 40 years of age or older, not pregnant at the time of their clinic visit, and had not participated in the study within a 12 months period. All study activities were reviewed and approved by the institutional review boards of the University of Washington and the Fred Hutchinson Cancer Research Center. 2.1. Procedures A research nurse identified all women over 40 years of age with scheduled clinic appointments as potentially eligible to participate. Informed consent was obtained from eligible and interested women. In the first phase of the study, 419 women completed an initial version of an SI assessment form with the assistance of the research nurse. Feedback from women participating during this stage of the project was used to understand how women respond to questions about symptoms which allowed us to understand potential false positive or negative re- sponses to the SI, and to improve the design of the data collection instrument. In the second phase of the study, 781 women were asked to complete one of three versions of the SI data collection form under development. Our goal was to de- velop an accurate method of symptom data collection that would require minimal implementation effort from clinic staff. After appropriate written instructions were developed, a second format was examined to assess pos- sible differences in the results or the completeness of women’s self-reports associated with questionnaire lay- out. 2.2. Measuring the Symptoms Initially a tabular form for data collection was used and women were asked “Have you experienced any of the following symptoms?” (Appendix 1). With extended use of the SI, it became apparent that the time frame women should use to answer questions about symptoms was unclear. Some women who reported symptoms had ex- perienced them frequently at some point in the past year but those symptoms had since resolved. Reports of such symptoms would increase the false positive rate of the SI because the symptoms are of potential importance only for women who are currently symptomatic. The spoken instructions were changed to clarify that the symptoms reported should be occurring at the present time. A total of 101 women completed study forms with spoken in- struction to indicate their current symptoms. After IRB approval was sought to change the written instructions, the next 258 participants completed the tabular form with new instructions asking “Are you currently experiencing any of the following symptoms frequently?” These in- troductory instructions resulted in fewer requests for clarification. Differences in the rates of positive results associated with the change in both spoken and written instructions versus the earlier version of the question- naire were evaluated. Two different page layouts of the symptoms questions were also tested. During initial pilot testing the question- naire was presented using a tabular layout but women frequently left portions blank requiring the nurse to ask if blank spaces indicated no symptoms. In an effort to re- duce such difficulties, a second layout was tested using separate questions for each set of symptoms and a more explicit flow pattern (Appendix 2). Statistical compari- sons of the two formats examining the effect of the ques- tionnaire layout on the rate of SI completion and on SI results were also performed. 2.3. Coding of the Symptom Index Women were considered to be positive for symptoms if any of the six symptoms occurred 13 or more times per month and were present for less than one year. 2.4. Assessing Other Variables of Interest In addition to the symptoms question, women completed a questionnaire allowing us to assess age, race/ethnicity, menopausal status, reason for clinic visit, and a variety of general medical conditions that might cause similar symptoms. Women also provided information about any gynecological or medical conditions diagnosed in the past. Gynecological conditions reported included endo- metriosis, fibroids, and ovarian cysts. General medical conditions included irritable bowel syndrome (IBS), uri- nary tract infections, acid reflux, diabetes, hypertension, heart disease, and thyroid disease. 2.5. Statistical Methods STATA statistical software package [version 10.0, Stata Copyright © 2012 SciRes. OPEN ACCESS 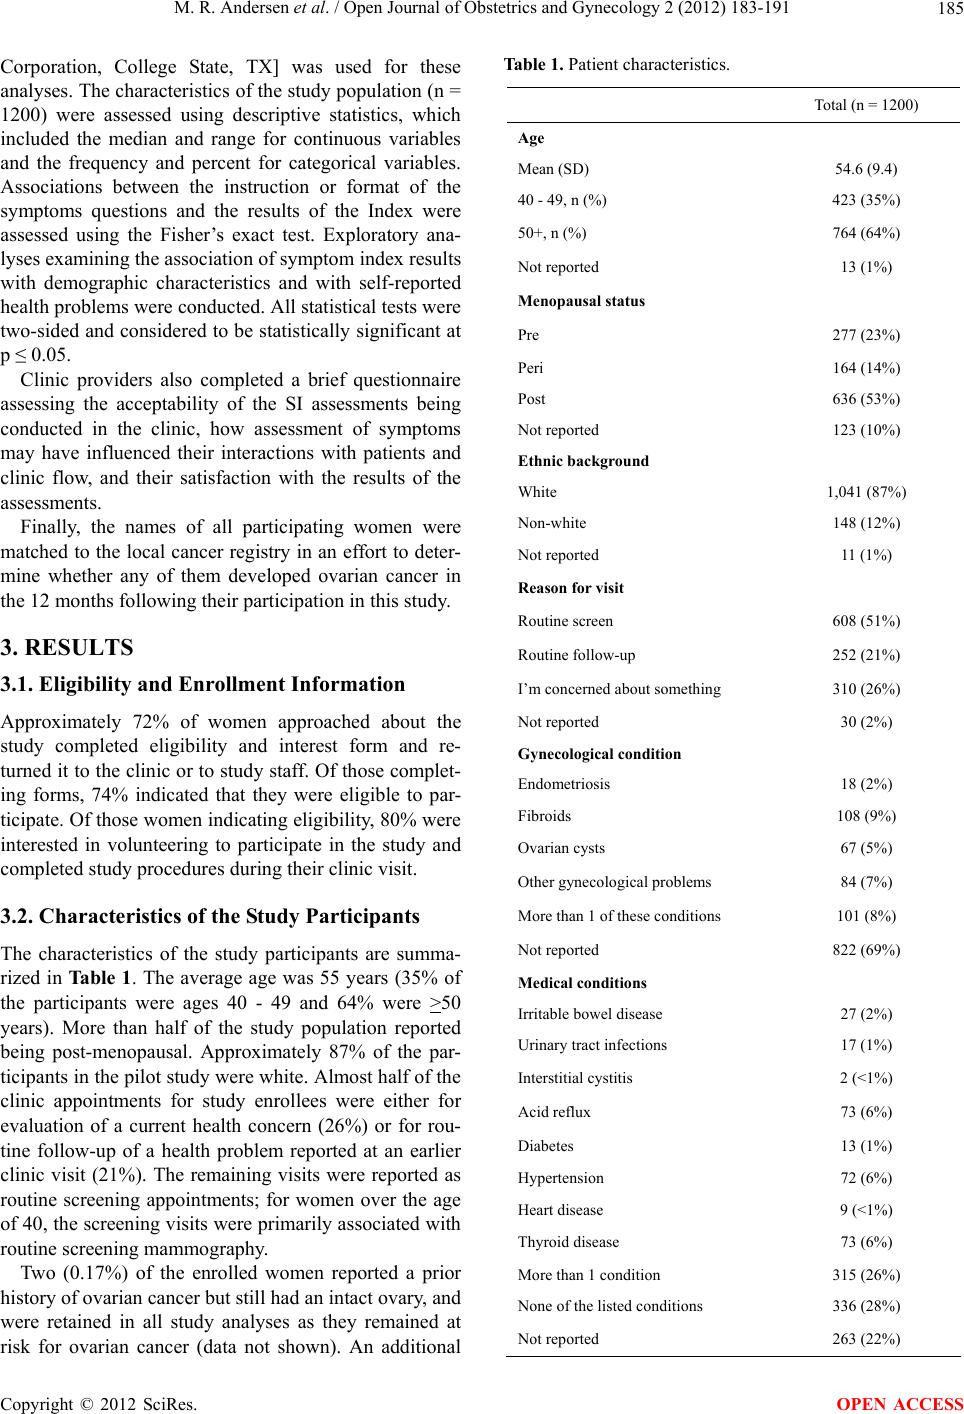 M. R. Andersen et al. / Open Journal of Obstetrics and Gynecology 2 (2012) 183-191 185 Corporation, College State, TX] was used for these analyses. The characteristics of the study population (n = 1200) were assessed using descriptive statistics, which included the median and range for continuous variables and the frequency and percent for categorical variables. Associations between the instruction or format of the symptoms questions and the results of the Index were assessed using the Fisher’s exact test. Exploratory ana- lyses examining the association of symptom index results with demographic characteristics and with self-reported health problems were conducted. All statistical tests were two-sided and considered to be statistically significant at p ≤ 0.05. Clinic providers also completed a brief questionnaire assessing the acceptability of the SI assessments being conducted in the clinic, how assessment of symptoms may have influenced their interactions with patients and clinic flow, and their satisfaction with the results of the assessments. Finally, the names of all participating women were matched to the local cancer registry in an effort to deter- mine whether any of them developed ovarian cancer in the 12 months following their participation in this study. 3. RESULTS 3.1. Eligibility and Enrollment Information Approximately 72% of women approached about the study completed eligibility and interest form and re- turned it to the clinic or to study staff. Of those complet- ing forms, 74% indicated that they were eligible to par- ticipate. Of those women indicating eligibility, 80% were interested in volunteering to participate in the study and completed study procedures during their clinic visit. 3.2. Characteristics of the Study Participants The characteristics of the study participants are summa- rized in Table 1. The average age was 55 years (35% of the participants were ages 40 - 49 and 64% were >50 years). More than half of the study population reported being post-menopausal. Approximately 87% of the par- ticipants in the pilot study were white. Almost half of the clinic appointments for study enrollees were either for evaluation of a current health concern (26%) or for rou- tine follow-up of a health problem reported at an earlier clinic visit (21%). The remaining visits were reported as routine screening appointments; for women over the age of 40, the screening visits were primarily associated with routine screening mammography. Two (0.17%) of the enrolled women reported a prior history of ovarian cancer but still had an intact ovary, and were retained in all study analyses as they remained at risk for ovarian cancer (data not shown). An additional Table 1. Patient characteristics. Total (n = 1200) Age Mean (SD) 54.6 (9.4) 40 - 49, n (%) 423 (35%) 50+, n (%) 764 (64%) Not reported 13 (1%) Menopausal status Pre 277 (23%) Peri 164 (14%) Post 636 (53%) Not reported 123 (10%) Ethnic background White 1,041 (87%) Non-white 148 (12%) Not reported 11 (1%) Reason for visit Routine screen 608 (51%) Routine follow-up 252 (21%) I’m concerned about something 310 (26%) Not reported 30 (2%) Gynecological condition Endometriosis 18 (2%) Fibroids 108 (9%) Ovarian cysts 67 (5%) Other gynecological problems 84 (7%) More than 1 of these conditions 101 (8%) Not reported 822 (69%) Medical conditions Irritable bowel disease 27 (2%) Urinary tract infections 17 (1%) Interstitial cystitis 2 (<1%) Acid reflux 73 (6%) Diabetes 13 (1%) Hypertension 72 (6%) Heart disease 9 (<1%) Thyroid disease 73 (6%) More than 1 condition 315 (26%) None of the listed conditions 336 (28%) Not reported 263 (22%) Copyright © 2012 SciRes. OPEN ACCESS 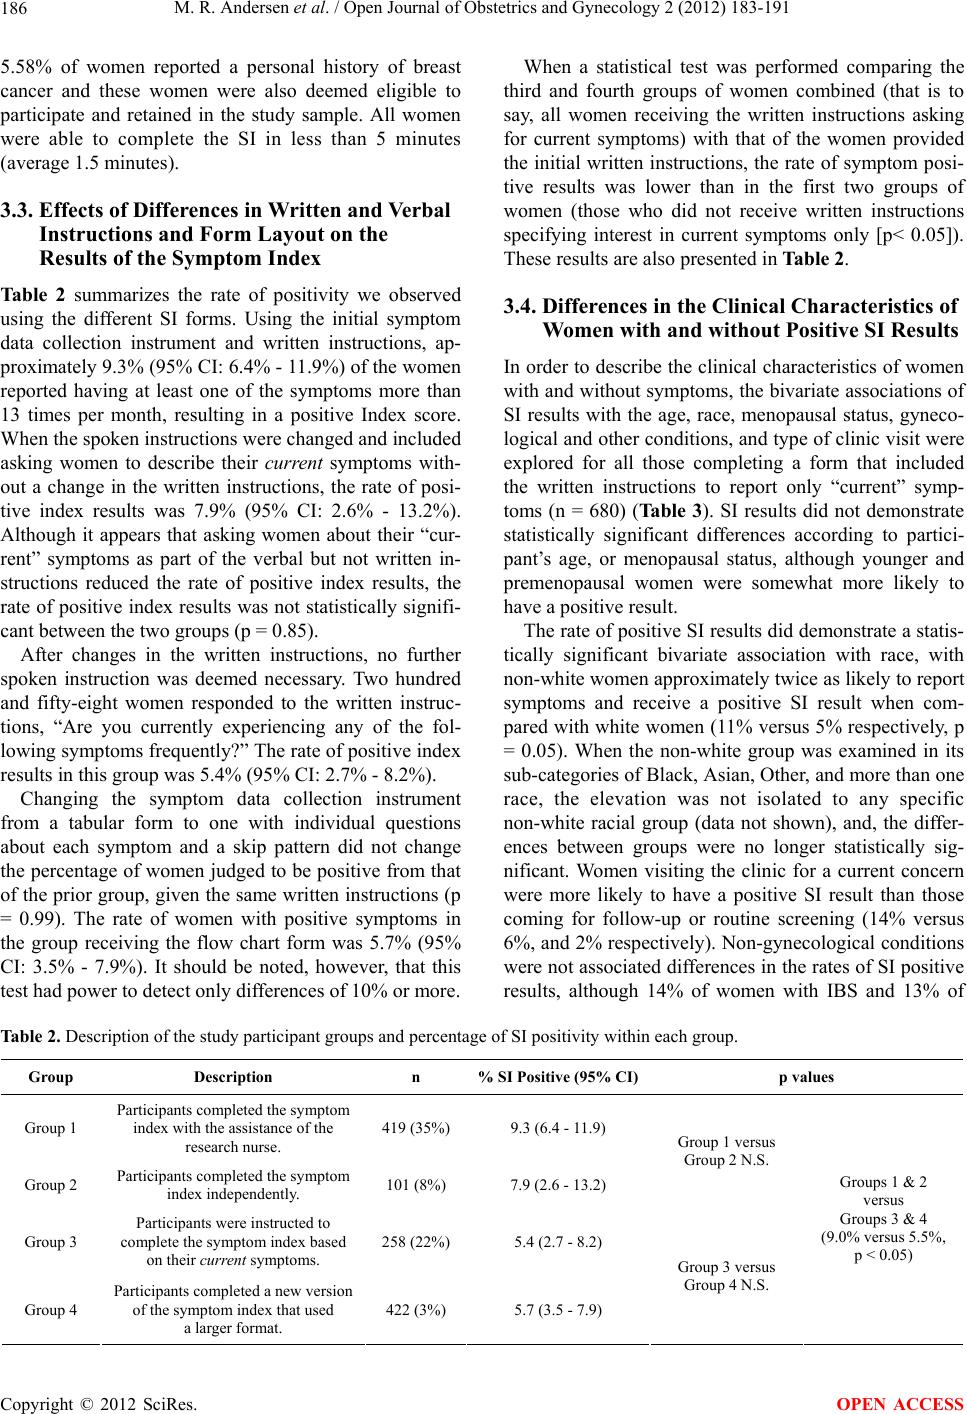 M. R. Andersen et al. / Open Journal of Obstetrics and Gynecology 2 (2012) 183-191 Copyright © 2012 SciRes. 186 OPEN ACCESS 5.58% of women reported a personal history of breast cancer and these women were also deemed eligible to participate and retained in the study sample. All women were able to complete the SI in less than 5 minutes (average 1.5 minutes). 3.3. Effects of Differences in Written and Verbal Instructions and Form Layout on the Results of the Symptom Index Table 2 summarizes the rate of positivity we observed using the different SI forms. Using the initial symptom data collection instrument and written instructions, ap- proximately 9.3% (95% CI: 6.4% - 11.9%) of the women reported having at least one of the symptoms more than 13 times per month, resulting in a positive Index score. When the spoken instructions were changed and included asking women to describe their current symptoms with- out a change in the written instructions, the rate of posi- tive index results was 7.9% (95% CI: 2.6% - 13.2%). Although it appears that asking women about their “cur- rent” symptoms as part of the verbal but not written in- structions reduced the rate of positive index results, the rate of positive index results was not statistically signifi- cant between the two groups (p = 0.85). After changes in the written instructions, no further spoken instruction was deemed necessary. Two hundred and fifty-eight women responded to the written instruc- tions, “Are you currently experiencing any of the fol- lowing symptoms frequently?” The rate of positive index results in this group was 5.4% (95% CI: 2.7% - 8.2%). Changing the symptom data collection instrument from a tabular form to one with individual questions about each symptom and a skip pattern did not change the percentage of women judged to be positive from that of the prior group, given the same written instructions (p = 0.99). The rate of women with positive symptoms in the group receiving the flow chart form was 5.7% (95% CI: 3.5% - 7.9%). It should be noted, however, that this test had power to detect only differences of 10% or more. When a statistical test was performed comparing the third and fourth groups of women combined (that is to say, all women receiving the written instructions asking for current symptoms) with that of the women provided the initial written instructions, the rate of symptom posi- tive results was lower than in the first two groups of women (those who did not receive written instructions specifying interest in current symptoms only [p< 0.05]). These results are also presented in Table 2. 3.4. Differences in the Clinical Characteristics of Women with and without Positive SI Results In order to describe the clinical characteristics of women with and without symptoms, the bivariate associations of SI results with the age, race, menopausal status, gyneco- logical and other conditions, and type of clinic visit were explored for all those completing a form that included the written instructions to report only “current” symp- toms (n = 680) (Table 3). SI results did not demonstrate statistically significant differences according to partici- pant’s age, or menopausal status, although younger and premenopausal women were somewhat more likely to have a positive result. The rate of positive SI results did demonstrate a statis- tically significant bivariate association with race, with non-white women approximately twice as likely to report symptoms and receive a positive SI result when com- pared with white women (11% versus 5% respectively, p = 0.05). When the non-white group was examined in its sub-categories of Black, Asian, Other, and more than one race, the elevation was not isolated to any specific non-white racial group (data not shown), and, the differ- ences between groups were no longer statistically sig- nificant. Women visiting the clinic for a current concern were more likely to have a positive SI result than those coming for follow-up or routine screening (14% versus 6%, and 2% respectively). Non-gynecological conditions were not associated differences in the rates of SI positive results, although 14% of women with IBS and 13% of Table 2. Description of the study participant groups and percentage of SI positivity within each group. Group Description n % SI Positive (95% CI)p values Group 1 Participants completed the symptom index with the assistance of the research nurse. 419 (35%) 9.3 (6.4 - 11.9) Group 2 Participants completed the symptom index independently. 101 (8%) 7.9 (2.6 - 13.2) Group 1 versus Group 2 N.S. Group 3 Participants were instructed to complete the symptom index based on their current symptoms. 258 (22%) 5.4 (2.7 - 8.2) Group 4 Participants completed a new version of the symptom index that used a larger format. 422 (3%) 5.7 (3.5 - 7.9) Group 3 versus Group 4 N.S. Groups 1 & 2 versus Groups 3 & 4 (9.0% versus 5.5%, p < 0.05) 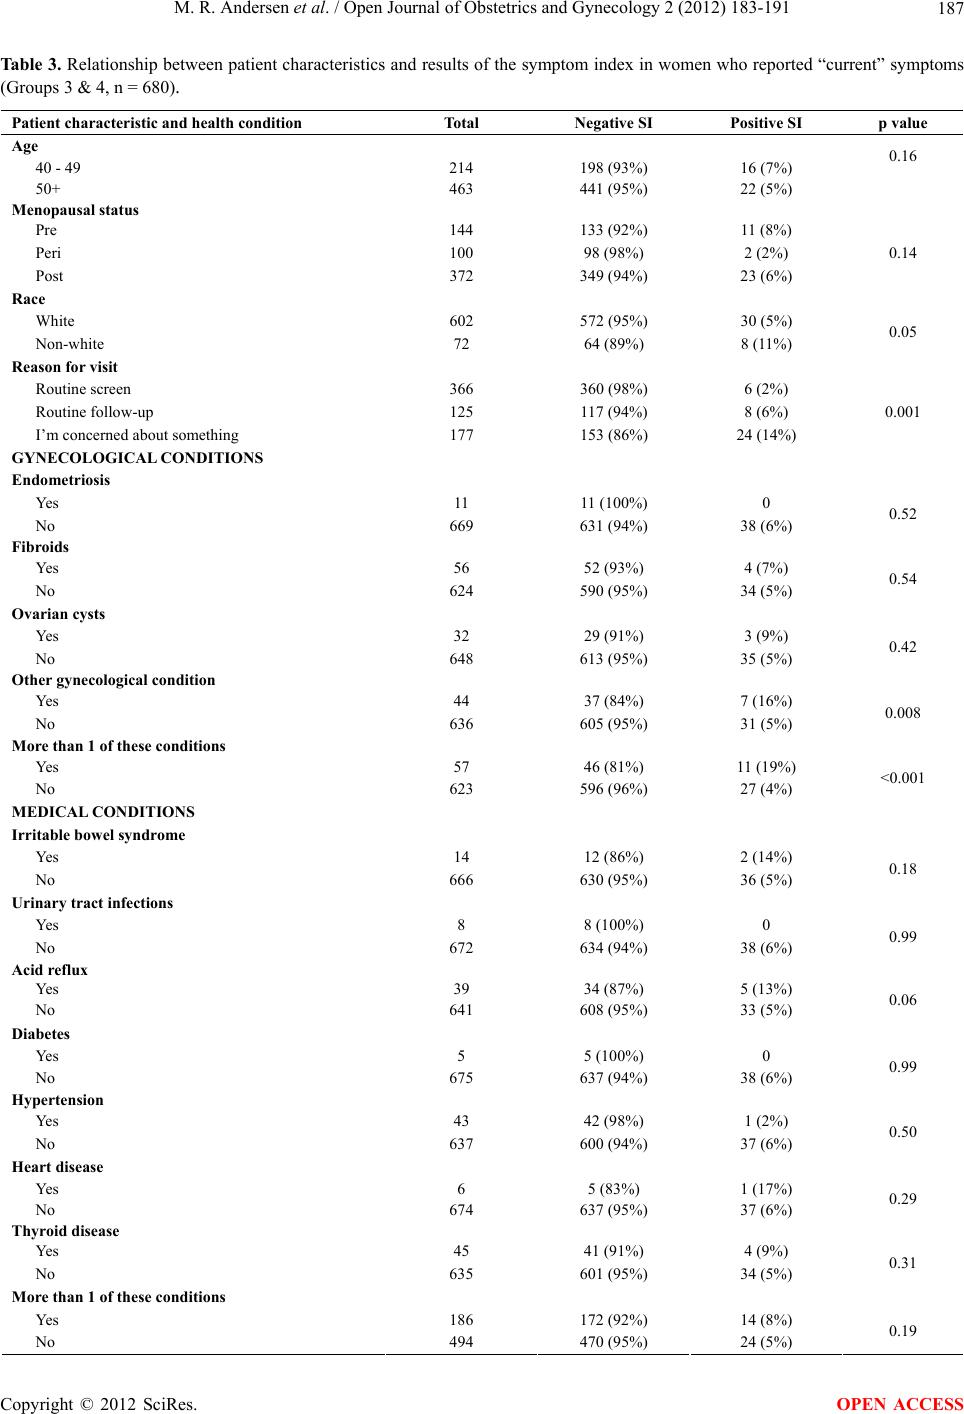 M. R. Andersen et al. / Open Journal of Obstetrics and Gynecology 2 (2012) 183-191 187 Table 3. Relationship between patient characteristics and results of the symptom index in women who reported “current” symptoms (Groups 3 & 4, n = 680). Patient characteristic and health condition Total Negative SI Positive SI p value Age 40 - 49 214 198 (93%) 16 (7%) 0.16 50+ 463 441 (95%) 22 (5%) Menopausal status Pre 144 133 (92%) 11 (8%) Peri 100 98 (98%) 2 (2%) Post 372 349 (94%) 23 (6%) 0.14 Race White 602 572 (95%) 30 (5%) Non-white 72 64 (89%) 8 (11%) 0.05 Reason for visit Routine screen 366 360 (98%) 6 (2%) Routine follow-up 125 117 (94%) 8 (6%) I’m concerned about something 177 153 (86%) 24 (14%) 0.001 GYNECOLOGICAL CONDITIONS Endometriosis Yes 11 11 (100%) 0 No 669 631 (94%) 38 (6%) 0.52 Fibroids Yes 56 52 (93%) 4 (7%) No 624 590 (95%) 34 (5%) 0.54 Ovarian cysts Yes 32 29 (91%) 3 (9%) No 648 613 (95%) 35 (5%) 0.42 Other gynecological condition Yes 44 37 (84%) 7 (16%) No 636 605 (95%) 31 (5%) 0.008 More than 1 of these conditions Yes 57 46 (81%) 11 (19%) No 623 596 (96%) 27 (4%) <0.001 MEDICAL CONDITIONS Irritable bowel syndrome Yes 14 12 (86%) 2 (14%) No 666 630 (95%) 36 (5%) 0.18 Urinary tract infections Yes 8 8 (100%) 0 No 672 634 (94%) 38 (6%) 0.99 Acid reflux Yes 39 34 (87%) 5 (13%) No 641 608 (95%) 33 (5%) 0.06 Diabetes Yes 5 5 (100%) 0 No 675 637 (94%) 38 (6%) 0.99 Hypertension Yes 43 42 (98%) 1 (2%) No 637 600 (94%) 37 (6%) 0.50 Heart disease Yes 6 5 (83%) 1 (17%) No 674 637 (95%) 37 (6%) 0.29 Thyroid disease Yes 45 41 (91%) 4 (9%) No 635 601 (95%) 34 (5%) 0.31 More than 1 of these conditions Yes 186 172 (92%) 14 (8%) No 494 470 (95%) 24 (5%) 0.19 Copyright © 2012 SciRes. OPEN ACCESS 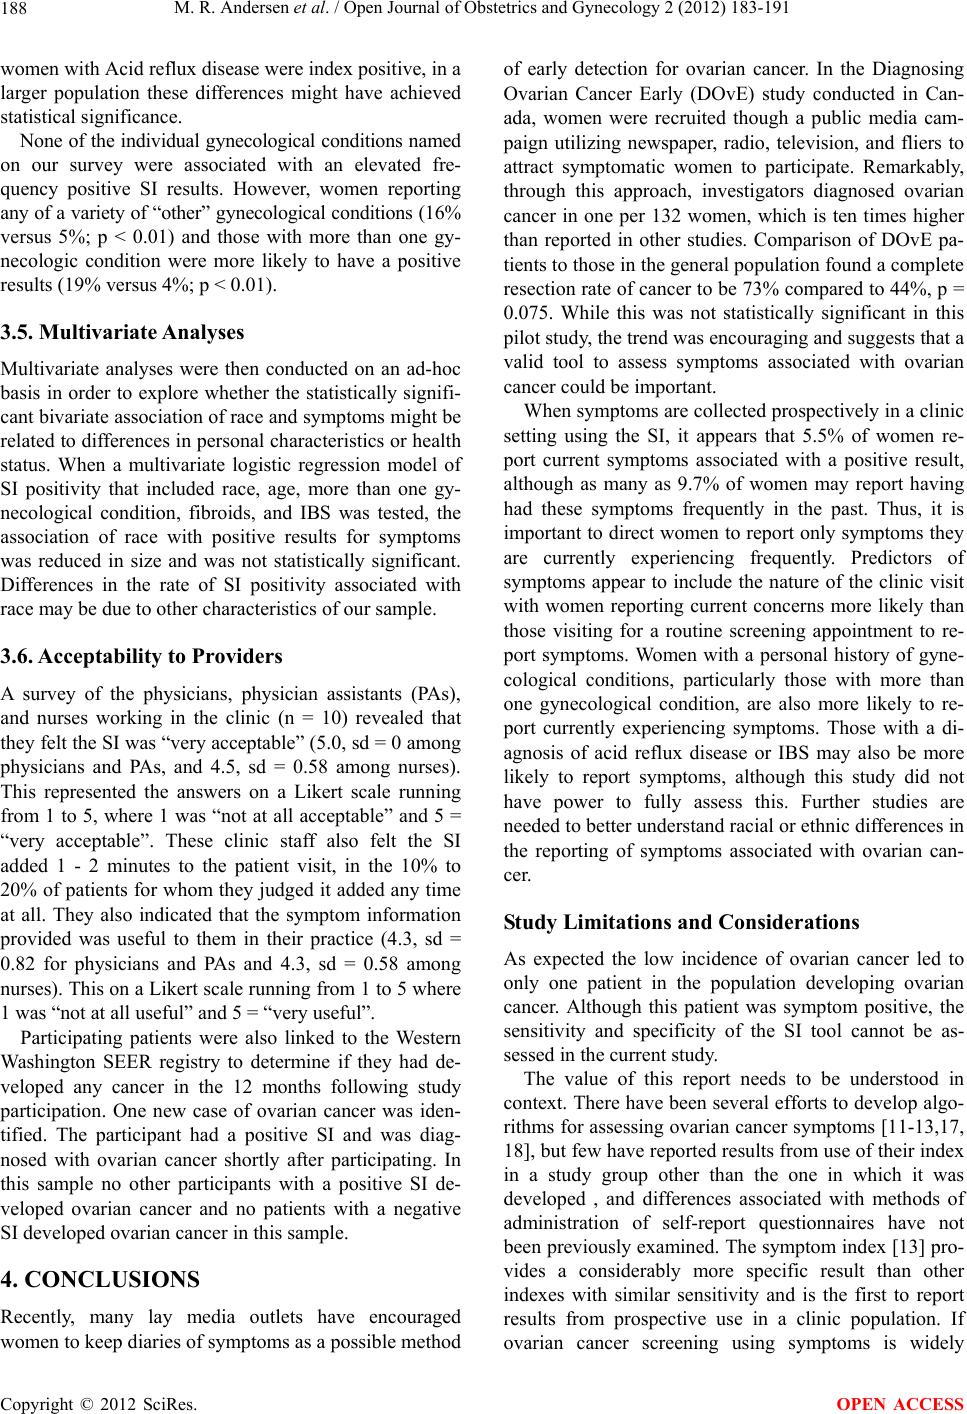 M. R. Andersen et al. / Open Journal of Obstetrics and Gynecology 2 (2012) 183-191 Copyright © 2012 SciRes. 188 OPEN ACCESS women with Acid reflux disease were index positive, in a larger population these differences might have achieved statistical significance. None of the individual gynecological conditions named on our survey were associated with an elevated fre- quency positive SI results. However, women reporting any of a variety of “other” gynecological conditions (16% versus 5%; p < 0.01) and those with more than one gy- necologic condition were more likely to have a positive results (19% versus 4%; p < 0.01). 3.5. Multivariate Analyses Multivariate analyses were then conducted on an ad-hoc basis in order to explore whether the statistically signifi- cant bivariate association of race and symptoms might be related to differences in personal characteristics or health status. When a multivariate logistic regression model of SI positivity that included race, age, more than one gy- necological condition, fibroids, and IBS was tested, the association of race with positive results for symptoms was reduced in size and was not statistically significant. Differences in the rate of SI positivity associated with race may be due to other characteristics of our sample. 3.6. Acceptability to Providers A survey of the physicians, physician assistants (PAs), and nurses working in the clinic (n = 10) revealed that they felt the SI was “very acceptable” (5.0, sd = 0 among physicians and PAs, and 4.5, sd = 0.58 among nurses). This represented the answers on a Likert scale running from 1 to 5, where 1 was “not at all acceptable” and 5 = “very acceptable”. These clinic staff also felt the SI added 1 - 2 minutes to the patient visit, in the 10% to 20% of patients for whom they judged it added any time at all. They also indicated that the symptom information provided was useful to them in their practice (4.3, sd = 0.82 for physicians and PAs and 4.3, sd = 0.58 among nurses). This on a Likert scale running from 1 to 5 where 1 was “not at all useful” and 5 = “very useful”. Participating patients were also linked to the Western Washington SEER registry to determine if they had de- veloped any cancer in the 12 months following study participation. One new case of ovarian cancer was iden- tified. The participant had a positive SI and was diag- nosed with ovarian cancer shortly after participating. In this sample no other participants with a positive SI de- veloped ovarian cancer and no patients with a negative SI developed ovarian cancer in this sample. 4. CONCLUSIONS Recently, many lay media outlets have encouraged women to keep diaries of symptoms as a possible method of early detection for ovarian cancer. In the Diagnosing Ovarian Cancer Early (DOvE) study conducted in Can- ada, women were recruited though a public media cam- paign utilizing newspaper, radio, television, and fliers to attract symptomatic women to participate. Remarkably, through this approach, investigators diagnosed ovarian cancer in one per 132 women, which is ten times higher than reported in other studies. Comparison of DOvE pa- tients to those in the general population found a complete resection rate of cancer to be 73% compared to 44%, p = 0.075. While this was not statistically significant in this pilot study, the trend was encouraging and suggests that a valid tool to assess symptoms associated with ovarian cancer could be important. When symptoms are collected prospectively in a clinic setting using the SI, it appears that 5.5% of women re- port current symptoms associated with a positive result, although as many as 9.7% of women may report having had these symptoms frequently in the past. Thus, it is important to direct women to report only symptoms they are currently experiencing frequently. Predictors of symptoms appear to include the nature of the clinic visit with women reporting current concerns more likely than those visiting for a routine screening appointment to re- port symptoms. Women with a personal history of gyne- cological conditions, particularly those with more than one gynecological condition, are also more likely to re- port currently experiencing symptoms. Those with a di- agnosis of acid reflux disease or IBS may also be more likely to report symptoms, although this study did not have power to fully assess this. Further studies are needed to better understand racial or ethnic differences in the reporting of symptoms associated with ovarian can- cer. Study Limitations and Considerations As expected the low incidence of ovarian cancer led to only one patient in the population developing ovarian cancer. Although this patient was symptom positive, the sensitivity and specificity of the SI tool cannot be as- sessed in the current study. The value of this report needs to be understood in context. There have been several efforts to develop algo- rithms for assessing ovarian cancer symptoms [11-13,17, 18], but few have reported results from use of their index in a study group other than the one in which it was developed , and differences associated with methods of administration of self-report questionnaires have not been previously examined. The symptom index [13] pro- vides a considerably more specific result than other indexes with similar sensitivity and is the first to report results from prospective use in a clinic population. If ovarian cancer screening using symptoms is widely  M. R. Andersen et al. / Open Journal of Obstetrics and Gynecology 2 (2012) 183-191 189 adopted, maximizing the specificity of screening pro- grams will be important. Until better biomarkers are iden- tified and tested collecting information about symptoms appears to have promise. The Symptom Index (SI) can be easily used in a primary care clinic setting and is acceptable to providers and patients and identifies women with symptoms that are worthy of concern with minimal false-positive results. 5. ACKNOWLEDGEMENTS This project was supported by grant number R21NR010571 from the National Institute of Nursing Research. The contents are solely the responsibility of the authors and do not necessarily represent the offi- cial views of the National Institute of Nursing Research or the National Institutes of Health. REFERENCES [1] Goff, B.A., et al. (2011) Symptom triggered screening for ovarian cancer: A pilot study of feasibility and acceptabil- ity. Gynecologic Oncology, 124, 230-235. doi:10.1016/j.ygyno.2011.10.032 [2] Gilbert, L., et al. (2012) Assessment of symptomatic wo- men for early diagnosis of ovarian cancer: Results from the prospective DOvE pilot project. The Lancet Oncology, 13, 285-291. [3] Goff, B.A., et al. (2004) Frequency of symptoms of ovarian cancer in women presenting to primary care clin- ics. Journal of American Medical Association, 291, 2705- 2712. doi:10.1001/jama.291.22.2705 [4] Lataifeh, I., et al. (2005) Presenting symptoms of epithe- lial ovarian cancer. Australian and New Zealand Journal of Obstetrics and Gynaecology, 45, 211-214. doi:10.1111/j.1479-828X.2005.00391.x [5] Olson, S.H., et al. (2001) Symptoms of ovarian cancer. Obstetrics & Gynecology, 98, 212-217. doi:10.1016/S0029-7844(01)01457-0 [6] Ryerson, A.B., et al. (2007) Symptoms, diagnosis, and time to key diagnositc procedures among older US wo- men with ovarian cancer. Obstetrics & Gynecology, 109, 1053-1061. doi:10.1097/01.AOG.0000260392.70365.5e [7] Vine, M.F., et al. (2001) Types and duration of symptoms prior to diagnosis of invasive or borderline ovarian tumor. Gynecologic Oncology, 83, 466-471. doi:10.1006/gyno.2001.6411 [8] Wikborn, C., et al. (1993) Symptoms and diagnostic dif- ficulties in ovarian epithelial cancer. International Jour- nal of Gynaecology & Obstetrics, 42, 261-264. doi:10.1016/0020-7292(93)90222-I [9] Gynecologic Cancer Foundation, Society of Gynecologi- cal Oncologists, and American Cancer Society (2007) Ovarian cancer symptoms: Consensus statement. http://www.wcn.org/ov-cancer-cons.html. [10] NICE (2011) Ovarian cancer: The recognition and initial management of ovarian cancer, in NICE clinical guidance 122, NICE. [11] Lim, A.W.W., et al. (2012) Predictive value of symptoms for ovarian cancer: Comparison of symptoms reported by questionnaire, interview, and general practitioner notes. Journal of the National Cancer Institute, 104, 114-124. doi:10.1093/jnci/djr486 [12] Lurie, G., et al. (2009) Prediagnostic symptoms of ovar- ian carcinoma: A case-control study. Gynecologic Oncol- ogy, 114, 231-236. doi:10.1016/j.ygyno.2009.05.001 [13] Goff, B.A., et al. (2007) Development of an ovarian can- cer symptom index: Possibilities for earlier detection. Cancer, 109, 221-227. doi:10.1002/cncr.22371 [14] Bankhead, C.R., et al. (2008) Identifying symptoms on ovarian cancer: A qualitative and quantitative study. Gy- necologic Oncology, 115, 1008-1014. [15] Andersen, M.R., et al. (2008) Combining a symptoms index with CA125 to improve detection of ovarian cancer. Cancer, 113, 484-489. doi:10.1002/cncr.23577 [16] Andersen, M.R., et al. (2010) Use of a symptom index, CA125, and HE4 to predict ovarian cancer. Gynecologic Oncology, 116, 378-383. doi:10.1016/j.ygyno.2009.10.087 [17] Devlin, S.M., et al. (2010) Identificaiton of ovarian can- cer symptoms in health insurance claims data. Journal of Women’s Health, 19, 381-389. [18] Hippisley-Cox, J. and Coupland, C. (2012) Identifying women with suspected ovarian cancer in primary care: Derivation and validation of algorithm. British Medical Journal, 344, d8009. doi:10.1136/bmj.d8009 Copyright © 2012 SciRes. OPEN ACCESS 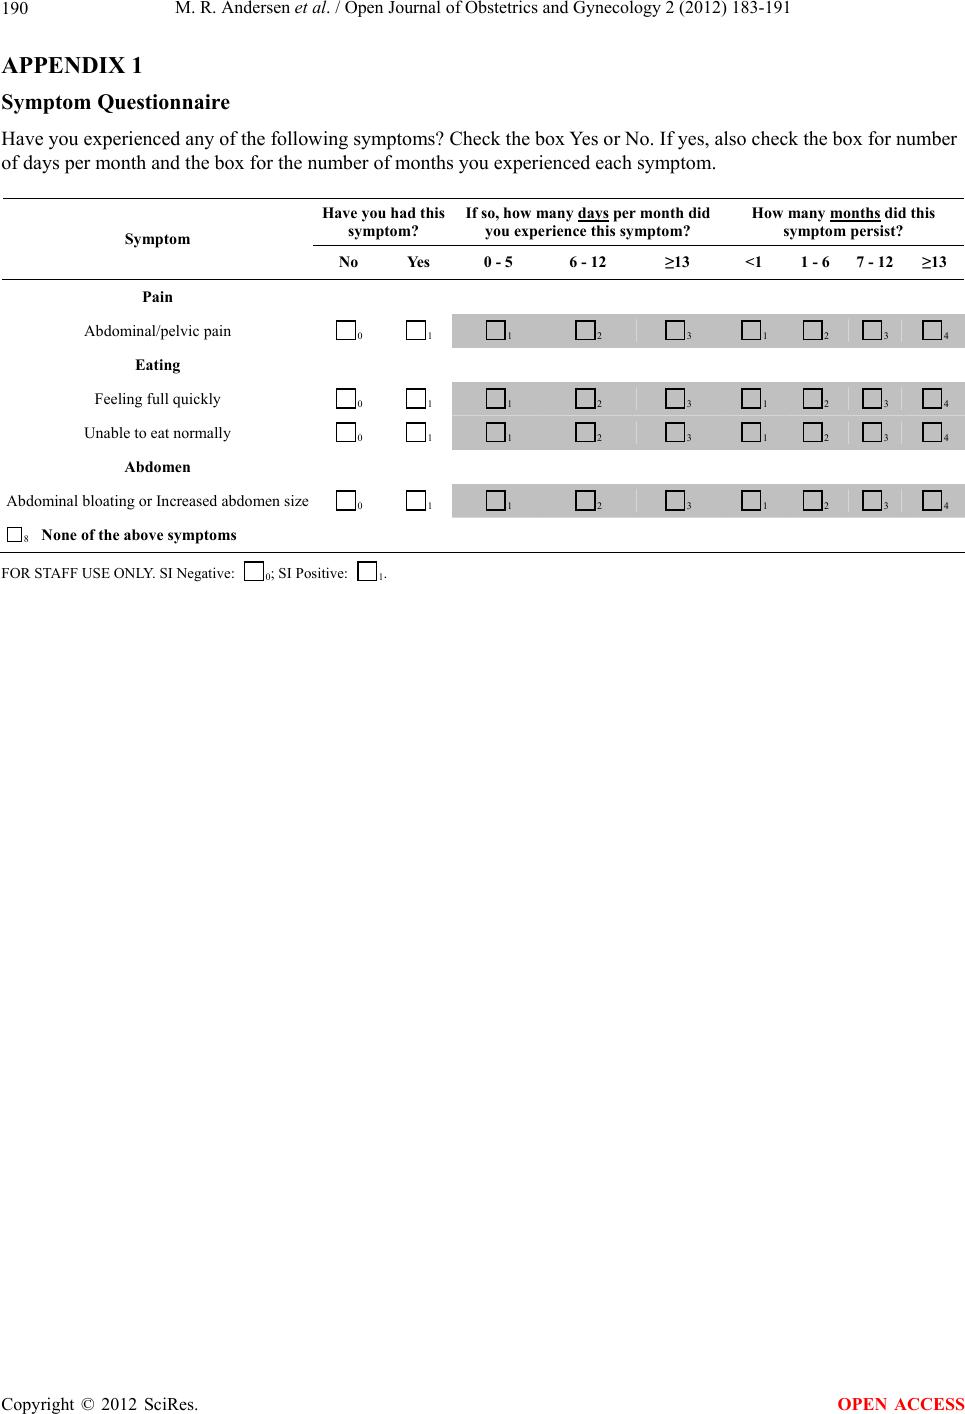 M. R. Andersen et al. / Open Journal of Obstetrics and Gynecology 2 (2012) 183-191 190 APPENDIX 1 Symptom Questionnaire Have you experienced any of the following symptoms? Check the box Yes or No. If yes, also check the box for number of days per month and the box for the number of months you experienced each symptom. Have you had this symptom? If so, how many days per month did you experience this symptom? How many mo nth s did this symptom persist? Symptom No Yes 0 - 5 6 - 12 ≥13 <1 1 - 6 7 - 12≥13 Pain Abdominal/pelvic pain 0 1 1 2 3 1 2 3 4 Eating Feeling full quickly 0 1 1 2 3 1 2 3 4 Unable to eat normally 0 1 1 2 3 1 2 3 4 Abdomen Abdominal bloating or Increased abdomen size 0 1 1 2 3 1 2 3 4 8 None of the above symptoms FOR STAFF USE ONLY. SI Negative: 0; SI Positive: 1. Copyright © 2012 SciRes. OPEN ACCESS 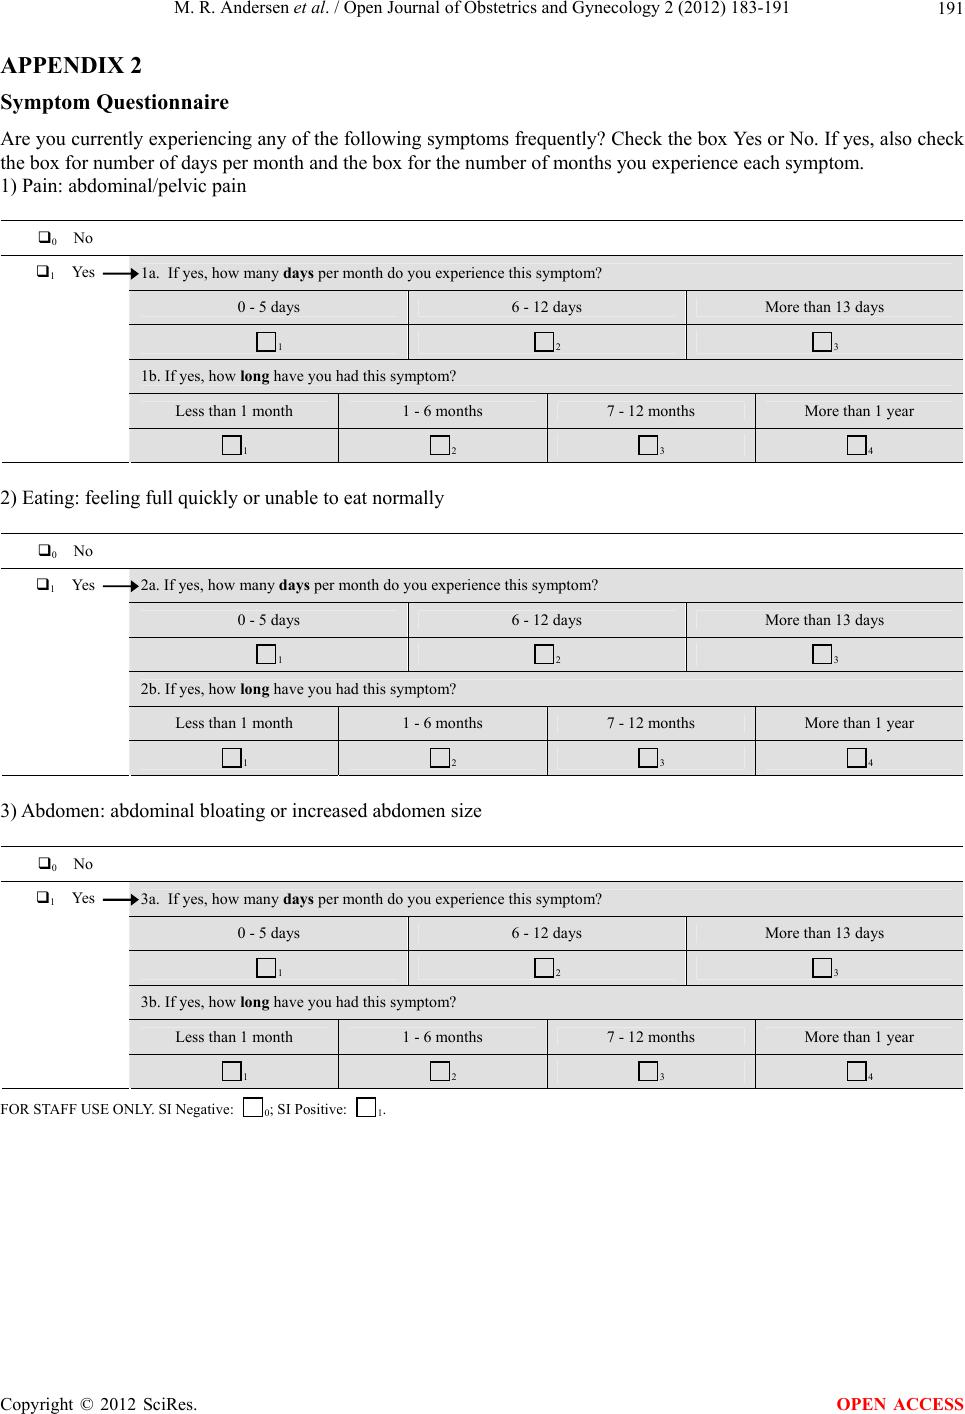 M. R. Andersen et al. / Open Journal of Obstetrics and Gynecology 2 (2012) 183-191 Copyright © 2012 SciRes. 191 APPENDIX 2 Symptom Questionnaire Are you currently experiencing any of the following symptoms frequently? Check the box Yes or No. If yes, also check the box for number of days per month and the box for the number of months you experience each symptom. 1) Pain: abdominal/pelvic pain 0 No 1a. If yes, how many days per month do you experience this symptom? 0 - 5 days 6 - 12 days More than 13 days 1 2 3 1b. If yes, how long have you had this symptom? Less than 1 month 1 - 6 months 7 - 12 months More than 1 year 1 Yes 1 2 3 4 2) Eating: feeling full quickly or unable to eat normally 0 No 2a. If yes, how many days per month do you experience this symptom? 0 - 5 days 6 - 12 days More than 13 days 1 2 3 2b. If yes, how long have you had this symptom? Less than 1 month 1 - 6 months 7 - 12 months More than 1 year 1 Yes 1 2 3 4 3) Abdomen: abdominal bloating or increased abdomen size 0 No 3a. If yes, how many days per month do you experience this symptom? 0 - 5 days 6 - 12 days More than 13 days 1 2 3 3b. If yes, how long have you had this symptom? Less than 1 month 1 - 6 months 7 - 12 months More than 1 year 1 Yes 1 2 3 4 FOR STAFF USE ONLY. SI Negative: 0; SI Positive: 1. OPEN ACCESS |