

Paper Menu >>
Journal Menu >>
 Journal of Water Resource and Protection, 2012, 4, 634-637 http://dx.doi.org/10.4236/jwarp.2012.48073 Published Online August 2012 (http://www.SciRP.org/journal/jwarp) Estimation of Water Environmental Capacity Considering Hydraulic Project Operation in the Xiangyan g Reach of the Han River, Central China Chen Sun, Hongjuan Wu School of Environmental Science and Engineering, Huazhong University of Science and Technology, Wuhan, China Email: sccool1983@gmail.com, [email protected] Received May 28, 2012; revised June 30, 2012; accepted July 8, 2012 ABSTRACT Using the Xiangyang Reach of the Han River as an example, this paper evaluates the changes of water environmental capacity after the implementation of Cuijiaying Hydro-junction project. The allowable pollutant loads entering the Xiangyang Reach were estimated using two-dimensional steady state water quality model with different data sets. The water environmental capacity has declined in the reservoir area of the Cuijiaying Hydro-junction project during the low-flow period; it is appearing to increase slightly in the upper and lower stream of this reservoir. However, the state of flow may turn into the state of reservoirs flow in the reservoir area, and the changes of hydrological regime may cause the water flow and the nutrient contents suitable for the occurrence of ecological environment problems. Keywords: Han River; Water Environmental Capacity; Cascade Development; Pollutant Loading 1. Introduction The Han River is the longest tributary of the Yangtze River, with a watercourse length of 1577 km and a total drainage area of 159,000 km2. The Han River Basin is one of the major agricultural production bases in China, and plays a significant role in regional economic devel- opment. Due to its plentiful water resources [1], the Ba- sin cascade development is being implemented [2]. Meanwhile, changes of hydrological regime may inevi- tably impact the aquatic environment of the Han River, especially to the water environmental capacity. Moreover, the rapid urbanization and industrialization are beginning to affect water quality in this area. From 1992 to 2005, large-scale algal blooms had taken place five times in the middle and lower reaches of the Han River because of the ecological environment degradation [3]. Total amount control for water pollutants is one of the main methods to resolve water environmental problems in China [4,5]. Comprehensively understanding the water environmental capacity, namely the maximum allowable pollutant loads discharging into the water body, is a pre- requisite to effective pollution control. With the aim of providing a valuable aid to the strategies of water pollu- tion control, the influence of water conservancy projects on water environmental capacity is increasingly draw more attention in China [6-8]. The current study aims to estimate the water environ- mental capacity through a case study of the Xiangyang Reach of the Han River in Central China. Using two- dimensional steady state water quality model, we evalu- ated the variation of water environmental capacity con- sidering the dam operation in this area. 2. Study Area Xiangyang city is located in the middle reach of the Han River (Figure 1). With a total area of 19,727.68 km2, it has a population of around 5,888,786 in 2009. The Han River runs through the city from north to south with a length of 195,000 m. There are five tributaries in the Xiangyang Reach: South River, North River, Xiaoqing River, Tangbai River, and Man River. The Cuijiaying Hydro-junction project, located in downstream of the Xiangyang urban area, is the third step of cascade devel- opment in the middle and lower reaches of the Han River [9]. Normal storage level of the project is 62.73 m. The project, which is mainly used for shipping and electricity generation, has been completed in July, 2010. 3. Methods According to the actuality of total amount control for water pollutants in China [10], chemical oxygen demand (COD) and ammonia nitrogen (NH3-N) were selected as the calculation factors in this study. We divided the Xiangyang Reach of the Hn River into six computa- a C opyright © 2012 SciRes. JWARP 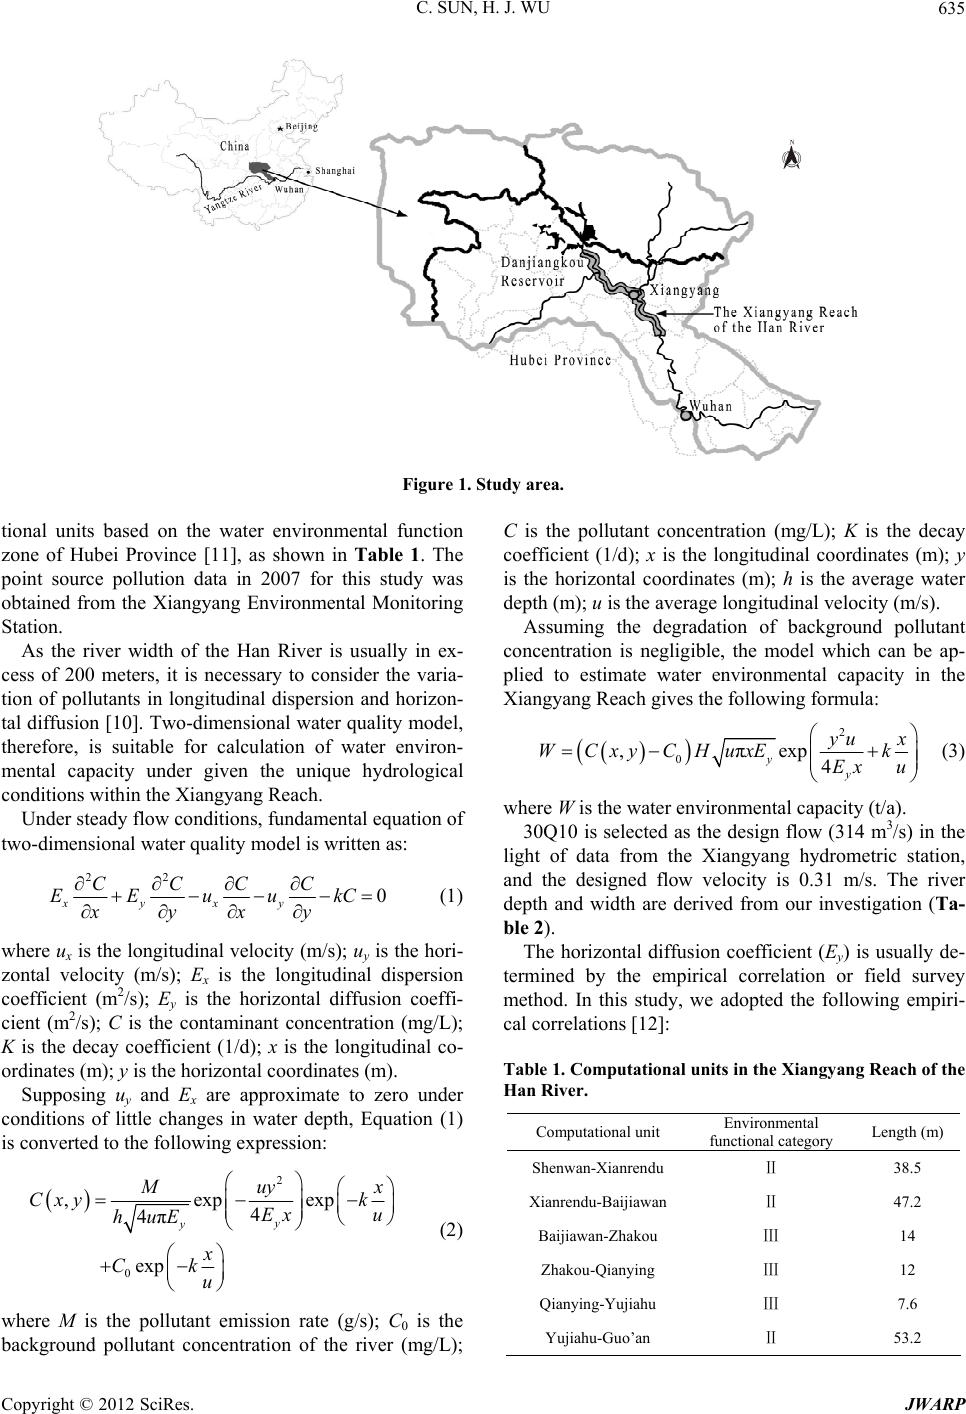 C. SUN, H. J. WU 635 Figure 1. Study area. tional units based on the water environmental function zone of Hubei Province [11], as shown in Table 1. The point source pollution data in 2007 for this study was obtained from the Xiangyang Environmental Monitoring Station. As the river width of the Han River is usually in ex- cess of 200 meters, it is necessary to consider the varia- tion of pollutants in longitudinal dispersion and horizon- tal diffusion [10]. Two-dimensional water quality model, therefore, is suitable for calculation of water environ- mental capacity under given the unique hydrological conditions within the Xiangyang Reach. Under steady flow conditions, fundamental equation of two-dimensional water quality model is written as: 22 0 xyxy CCCC EEuukC xyxy (1) where ux is the longitudinal velocity (m/s); uy is the hori- zontal velocity (m/s); Ex is the longitudinal dispersion coefficient (m2/s); Ey is the horizontal diffusion coeffi- cient (m2/s); C is the contaminant concentration (mg/L); K is the decay coefficient (1/d); x is the longitudinal co- ordinates (m); y is the horizontal coordinates (m). Supposing uy and Ex are approximate to zero under conditions of little changes in water depth, Equation (1) is converted to the following expression: 2 0 ,expexp 4 4π exp y y M uy x Cxy k Ex u huE x Ck u (2) where M is the pollutant emission rate (g/s); C0 is the background pollutant concentration of the river (mg/L); C is the pollutant concentration (mg/L); K is the decay coefficient (1/d); x is the longitudinal coordinates (m); y is the horizontal coordinates (m); h is the average water depth (m); u is the average longitudinal velocity (m/s). Assuming the degradation of background pollutant concentration is negligible, the model which can be ap- plied to estimate water environmental capacity in the Xiangyang Reach gives the following formula: 2 0 ,πexp 4 yy yu x WCxyCHuxE k Ex u (3) where W is the water environmental capacity (t/a). 30Q10 is selected as the design flow (314 m3/s) in the light of data from the Xiangyang hydrometric station, and the designed flow velocity is 0.31 m/s. The river depth and width are derived from our investigation (Ta- ble 2). The horizontal diffusion coefficient (Ey) is usually de- termined by the empirical correlation or field survey method. In this study, we adopted the following empiri- cal correlations [12]: Table 1. Computational units in the Xiangyang Reach of the Han River. Computational unit Environmental functional category Length (m) Shenwan-Xianrendu Ⅱ 38.5 Xianrendu-Baijiawan Ⅱ 47.2 Baijiawan-Zhakou Ⅲ 14 Zhakou-Qianying Ⅲ 12 Qianying-Yujiahu Ⅲ 7.6 Yujiahu-Guo’an Ⅱ 53.2 Copyright © 2012 SciRes. JWARP 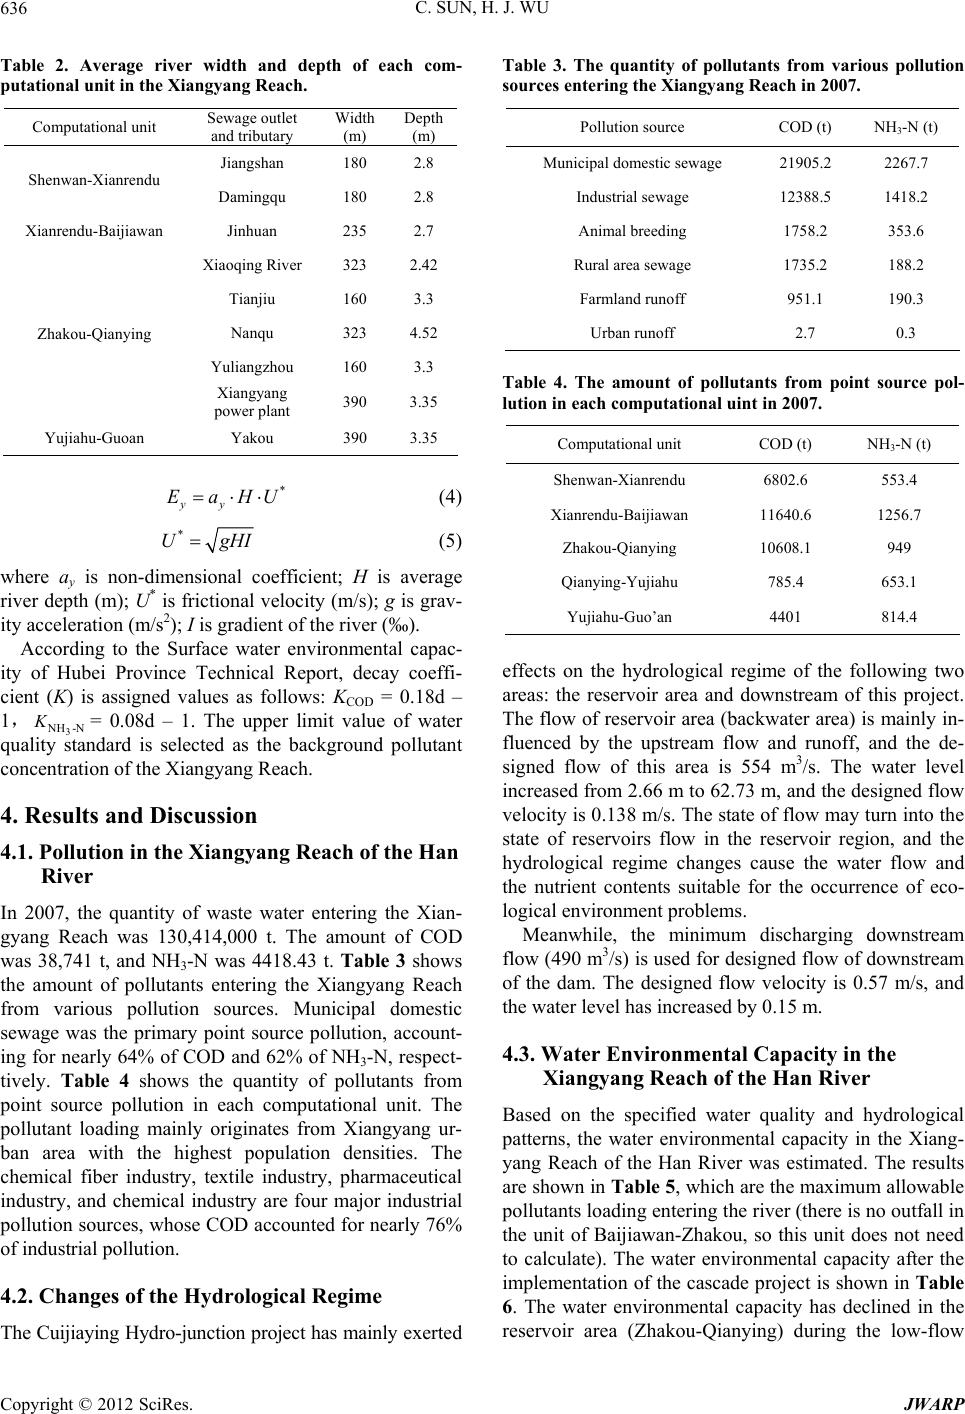 C. SUN, H. J. WU 636 Table 2. Average river width and depth of each com- putational unit in the Xiangyang Reach. Computational unit Sewage outlet and tributary Width (m) Depth (m) Jiangshan 180 2.8 Shenwan-Xianrendu Damingqu 180 2.8 Xianrendu-Baijiawan Jinhuan 235 2.7 Xiaoqing River 323 2.42 Tianjiu 160 3.3 Nanqu 323 4.52 Yuliangzhou 160 3.3 Zhakou-Qianying Xiangyang power plant 390 3.35 Yujiahu-Guoan Yakou 390 3.35 * yy EaHU (4) * UgHI (5) where ay is non-dimensional coefficient; H is average river depth (m); U* is frictional velocity (m/s); g is grav- ity acceleration (m/s2); I is gradient of the river (‰). According to the Surface water environmental capac- ity of Hubei Province Technical Report, decay coeffi- cient (K) is assigned values as follows: KCOD = 0.18d – 1, 3 NH-N = 0.08d – 1. The upper limit value of water quality standard is selected as the background pollutant concentration of the Xiangyang Reach. K 4. Results and Discussion 4.1. Pollution in the Xiangyang Reach of the Han River In 2007, the quantity of waste water entering the Xian- gyang Reach was 130,414,000 t. The amount of COD was 38,741 t, and NH3-N was 4418.43 t. Table 3 shows the amount of pollutants entering the Xiangyang Reach from various pollution sources. Municipal domestic sewage was the primary point source pollution, account- ing for nearly 64% of COD and 62% of NH3-N, respect- tively. Table 4 shows the quantity of pollutants from point source pollution in each computational unit. The pollutant loading mainly originates from Xiangyang ur- ban area with the highest population densities. The chemical fiber industry, textile industry, pharmaceutical industry, and chemical industry are four major industrial pollution sources, whose COD accounted for nearly 76% of industrial pollution. 4.2. Changes of the Hydrological Regime The Cuijiaying Hydro-junction project has mainly exerted Table 3. The quantity of pollutants from various pollution sources entering the Xiangyang Reach in 2007. Pollution source COD (t) NH3-N (t) Municipal domestic sewage 21905.2 2267.7 Industrial sewage 12388.5 1418.2 Animal breeding 1758.2 353.6 Rural area sewage 1735.2 188.2 Farmland runoff 951.1 190.3 Urban runoff 2.7 0.3 Table 4. The amount of pollutants from point source pol- lution in each computational uint in 2007. Computational unit COD (t) NH3-N (t) Shenwan-Xianrendu 6802.6 553.4 Xianrendu-Baijiawan 11640.6 1256.7 Zhakou-Qianying 10608.1 949 Qianying-Yujiahu 785.4 653.1 Yujiahu-Guo’an 4401 814.4 effects on the hydrological regime of the following two areas: the reservoir area and downstream of this project. The flow of reservoir area (backwater area) is mainly in- fluenced by the upstream flow and runoff, and the de- signed flow of this area is 554 m3/s. The water level increased from 2.66 m to 62.73 m, and the designed flow velocity is 0.138 m/s. The state of flow may turn into the state of reservoirs flow in the reservoir region, and the hydrological regime changes cause the water flow and the nutrient contents suitable for the occurrence of eco- logical environment problems. Meanwhile, the minimum discharging downstream flow (490 m3/s) is used for designed flow of downstream of the dam. The designed flow velocity is 0.57 m/s, and the water level has increased by 0.15 m. 4.3. Water Environmental Capacity in the Xiangyang Reach of the Han River Based on the specified water quality and hydrological patterns, the water environmental capacity in the Xiang- yang Reach of the Han River was estimated. The results are shown in Table 5, which are the maximum allowable pollutants loading entering the river (there is no outfall in the unit of Baijiawan-Zhakou, so this unit does not need to calculate). The water environmental capacity after the implementation of the cascade project is shown in Table 6. The water environmental capacity has declined in the reservoir area (Zhakou-Qianying) during the low-flow Copyright © 2012 SciRes. JWARP 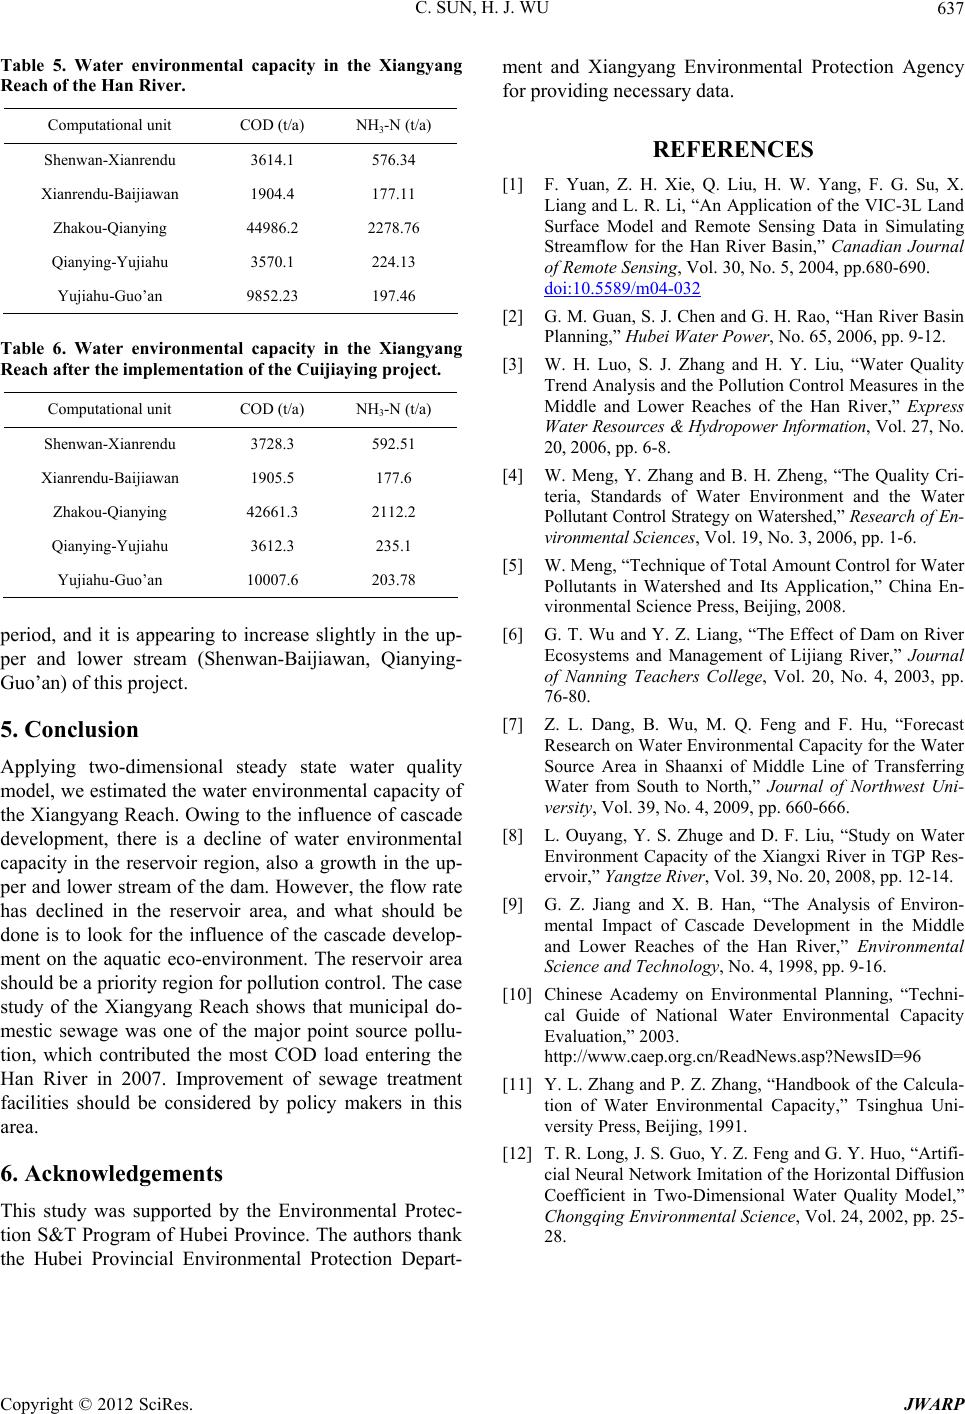 C. SUN, H. J. WU Copyright © 2012 SciRes. JWARP 637 Table 5. Water environmental capacity in the Xiangyang Reach of the Han River. Computational unit COD (t/a) NH3-N (t/a) Shenwan-Xianrendu 3614.1 576.34 Xianrendu-Baijiawan 1904.4 177.11 Zhakou-Qianying 44986.2 2278.76 Qianying-Yujiahu 3570.1 224.13 Yujiahu-Guo’an 9852.23 197.46 Table 6. Water environmental capacity in the Xiangyang Reach after the implementation of the Cuijiaying project. Computational unit COD (t/a) NH3-N (t/a) Shenwan-Xianrendu 3728.3 592.51 Xianrendu-Baijiawan 1905.5 177.6 Zhakou-Qianying 42661.3 2112.2 Qianying-Yujiahu 3612.3 235.1 Yujiahu-Guo’an 10007.6 203.78 period, and it is appearing to increase slightly in the up- per and lower stream (Shenwan-Baijiawan, Qianying- Guo’an) of this project. 5. Conclusion Applying two-dimensional steady state water quality model, we estimated the water environmental capacity of the Xiangyang Reach. Owing to the influence of cascade development, there is a decline of water environmental capacity in the reservoir region, also a growth in the up- per and lower stream of the dam. However, the flow rate has declined in the reservoir area, and what should be done is to look for the influence of the cascade develop- ment on the aquatic eco-environment. The reservoir area should be a priority region for pollution control. The case study of the Xiangyang Reach shows that municipal do- mestic sewage was one of the major point source pollu- tion, which contributed the most COD load entering the Han River in 2007. Improvement of sewage treatment facilities should be considered by policy makers in this area. 6. Acknowledgements This study was supported by the Environmental Protec- tion S&T Program of Hubei Province. The authors thank the Hubei Provincial Environmental Protection Depart- ment and Xiangyang Environmental Protection Agency for providing necessary data. REFERENCES [1] F. Yuan, Z. H. Xie, Q. Liu, H. W. Yang, F. G. Su, X. Liang and L. R. Li, “An Application of the VIC-3L Land Surface Model and Remote Sensing Data in Simulating Streamflow for the Han River Basin,” Canadian Journal of Remote Sensing, Vol. 30, No. 5, 2004, pp.680-690. doi:10.5589/m04-032 [2] G. M. Guan, S. J. Chen and G. H. Rao, “Han River Basin Planning,” Hubei Water Power, No. 65, 2006, pp. 9-12. [3] W. H. Luo, S. J. Zhang and H. Y. Liu, “Water Quality Trend Analysis and the Pollution Control Measures in the Middle and Lower Reaches of the Han River,” Express Water Resources & Hydropower Information, Vol. 27, No. 20, 2006, pp. 6-8. [4] W. Meng, Y. Zhang and B. H. Zheng, “The Quality Cri- teria, Standards of Water Environment and the Water Pollutant Control Strategy on Watershed,” Researc h of En- vironmental Sciences, Vol. 19, No. 3, 2006, pp. 1-6. [5] W. Meng, “Technique of Total Amount Control for Water Pollutants in Watershed and Its Application,” China En- vironmental Science Press, Beijing, 2008. [6] G. T. Wu and Y. Z. Liang, “The Effect of Dam on River Ecosystems and Management of Lijiang River,” Journal of Nanning Teachers College, Vol. 20, No. 4, 2003, pp. 76-80. [7] Z. L. Dang, B. Wu, M. Q. Feng and F. Hu, “Forecast Research on Water Environmental Capacity for the Water Source Area in Shaanxi of Middle Line of Transferring Water from South to North,” Journal of Northwest Uni- versity, Vol. 39, No. 4, 2009, pp. 660-666. [8] L. Ouyang, Y. S. Zhuge and D. F. Liu, “Study on Water Environment Capacity of the Xiangxi River in TGP Res- ervoir,” Yangtze River, Vol. 39, No. 20, 2008, pp. 12-14. [9] G. Z. Jiang and X. B. Han, “The Analysis of Environ- mental Impact of Cascade Development in the Middle and Lower Reaches of the Han River,” Environmental Science and Technology, No. 4, 1998, pp. 9-16. [10] Chinese Academy on Environmental Planning, “Techni- cal Guide of National Water Environmental Capacity Evaluation,” 2003. http://www.caep.org.cn/ReadNews.asp?NewsID=96 [11] Y. L. Zhang and P. Z. Zhang, “Handbook of the Calcula- tion of Water Environmental Capacity,” Tsinghua Uni- versity Press, Beijing, 1991. [12] T. R. Long, J. S. Guo, Y. Z. Feng and G. Y. Huo, “Artifi- cial Neural Network Imitation of the Horizontal Diffusion Coefficient in Two-Dimensional Water Quality Model,” Chongqing Environmental Science, Vol. 24, 2002, pp. 25- 28. |