

Paper Menu >>
Journal Menu >>
 Journal of Water Resource and Protection, 2012, 4, 597-604 http://dx.doi.org/10.4236/jwarp.2012.48069 Published Online August 2012 (http://www.SciRP.org/journal/jwarp) Development of El-Salam Canal Automation System Noha Samir Donia Environmental Studies and Researches Institute, Ain Shams University, Cairo, Egypt Email: [email protected] Received February 24, 2012; revised March 26, 2012; accepted April 7, 2012 ABSTRACT In Egypt irrigation water is becoming more scarcer with the continuously increasing demand for agriculture, domestic and industrial purposes. To face this increasing irrigation demand, the available water supply in Egypt is supplemented by the reuse of agricultural drainage water as in El-Salam Canal that do not satisfy water quality stand ards defined for the canal. This paper introduces an automation system for El-Salam Canal to control the flow of the fresh water and drainage water supplied to the canal. This au tomatic control system (A CS) is able to process d ata of various flows and water quality data along the canal. This control system is represented by a canal computer model. This syste m computes the required control actio ns at the Damietta branch and the feed ing drains. It is also able to generate optimum solutio ns for the canal to satisfy the pre-defined canal conditions and stand ards. Keywords: Water Quality; Automatic Control; Modeling 1. Introduction As water is becoming more and more a scarce resource all over the world, proper management of the available water is essential. For an optimal use of the available water resources, water management strategies have to be developed. A water management strategy is based on a water control system. The two main factors that deter- mine the designated water use are the water quality and water quantity of a water system. Controlling the quality and quantity of a water system is done using monitoring devices, water gates, pump stations, power stations and other operational devices. There are different types of controlling a water system. However, the use of auto- matic control has lately proven to have more advantages over other types. Automatic control provides accuracy, reliability, time-saving and man-power saving. It also enhances flexibility and saves water and improves pro- duction. Many researches have been conducted for implement- tation of automatic con trol water systems. [1] studied the real-time control of combined surface water quantity and quality for polder flushing. [2] studied the Elements of a decision support system for real-time management of dissolved oxygen in the San Joaquin River Deep Water Ship Channel. In Thailand, on the Kamphaengsaen Irri- gation Canal, the canal’s automation system has been developed and tested during October 2006 to July 2008. The canal automation system consists of the master sta- tion and six remote terminal units (RTU) which commu- nicate by VHF radio. The six RTUs installed in the canal irrigation system are for monitoring and controlling of water levels and discharges in the canal system, moni- toring rainfall, air temperature and relative humidity. The system has provided flexible, accurate and reliable con- trol of irrigation water supply [3]. In Arizona USA, on the Salt River Project Canal system an automatic control system was proposed. This system automates and en- hances functions already performed by operators. Some of these functions are control of water levels and flow control at check structures. The proposed system consists of three separate controllers with a configuration that makes control actions computed independently of gate hydraulics. The controllers are centrally operated, that is monitoring and determining control actions is done from a remote site. The control system has proven to be a sta- ble and robust system [4]. In Australia, on the Coleam- bally Canal Network, an automation system has been introduced, with the objective of reducing the operating cost of the canal system, reducing conveyance losses and improving the ability of the supply system to respond to irrigation demands. There is an ability to remotely moni- tor and regulate the main canal which results in a much improved standard of service to the secondary canal off-takes. Gates are being automated and a software sys- tem controls the opening and closing of the gates auto- matically. The control system assists irrigators to im- prove the efficiency of water use [5]. This study focuses on introducing El-Salam Canal control system that consists mainly of an automatic mo- nitoring system and an automatic control syste m which is C opyright © 2012 SciRes. JWARP 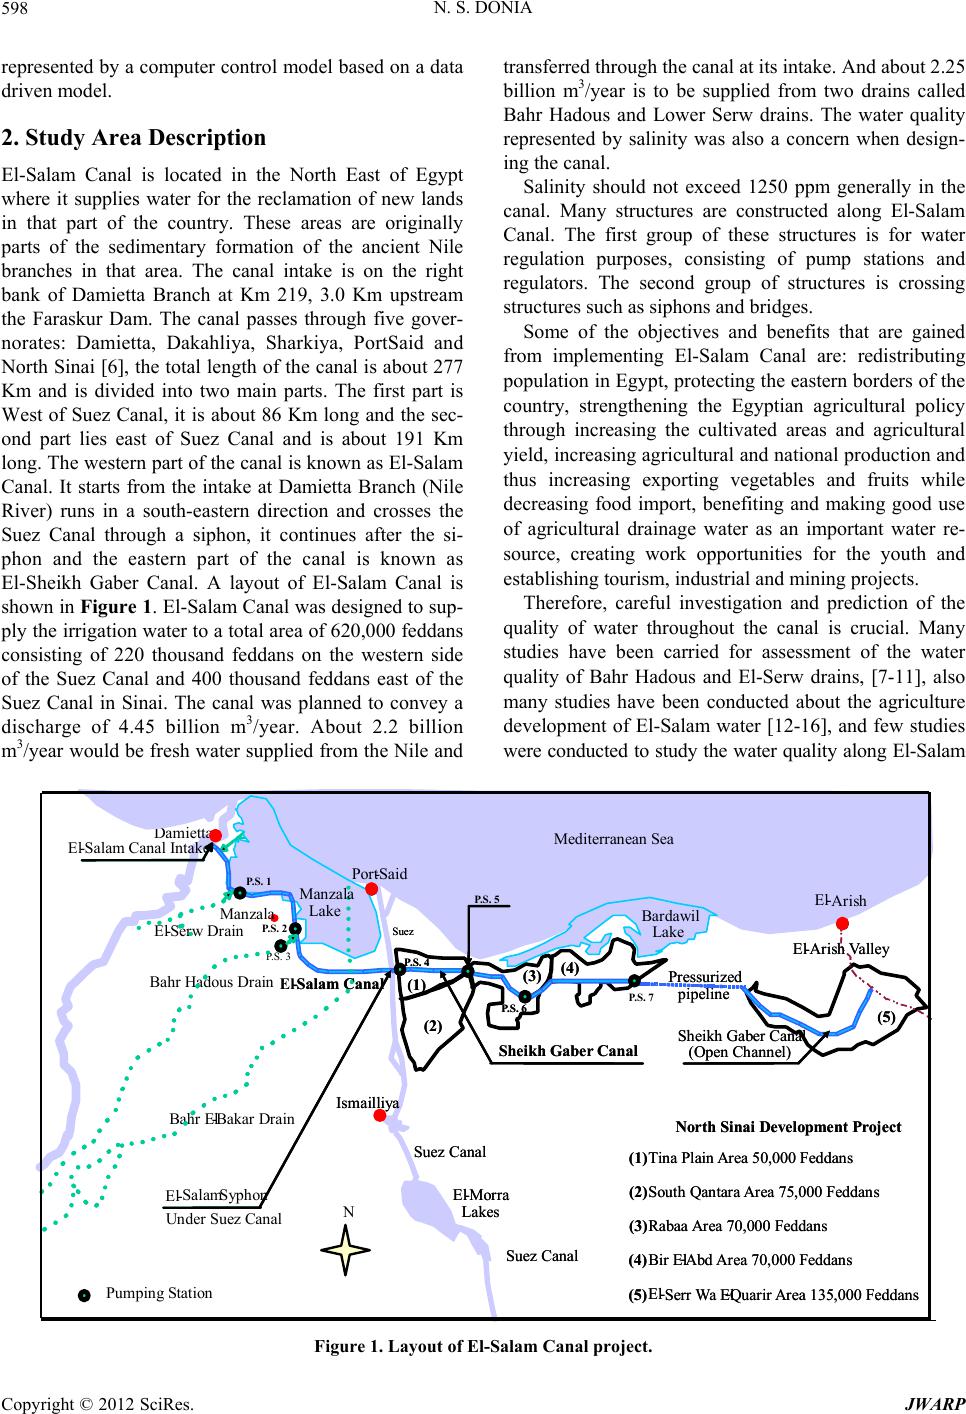 N. S. DONIA 598 represented by a computer control model based on a data driven model. 2. Study Area Description El-Salam Canal is located in the North East of Egypt where it supplies water for the reclamation of new lands in that part of the country. These areas are originally parts of the sedimentary formation of the ancient Nile branches in that area. The canal intake is on the right bank of Damietta Branch at Km 219, 3.0 Km upstream the Faraskur Dam. The canal passes through five gover- norates: Damietta, Dakahliya, Sharkiya, PortSaid and North Sinai [6], the total length of the canal is about 277 Km and is divided into two main parts. The first part is West of Suez Canal, it is about 86 Km long and the sec- ond part lies east of Suez Canal and is about 191 Km long. The western part of the canal is known as El-Salam Canal. It starts from the intake at Damietta Branch (Nile River) runs in a south-eastern direction and crosses the Suez Canal through a siphon, it continues after the si- phon and the eastern part of the canal is known as El-Sheikh Gaber Canal. A layout of El-Salam Canal is shown in Figure 1. El-Salam Canal was designed to sup- ply the irrigation water to a total area of 620,000 feddans consisting of 220 thousand feddans on the western side of the Suez Canal and 400 thousand feddans east of the Suez Canal in Sinai. The canal was planned to convey a discharge of 4.45 billion m3/year. About 2.2 billion m3/year would be fresh water supplied from the Nile and transferred through the canal at its intake. And about 2.25 billion m3/year is to be supplied from two drains called Bahr Hadous and Lower Serw drains. The water quality represented by salinity was also a concern when design- ing the canal. Salinity should not exceed 1250 ppm generally in the canal. Many structures are constructed along El-Salam Canal. The first group of these structures is for water regulation purposes, consisting of pump stations and regulators. The second group of structures is crossing structures such as siphons and br idges. Some of the objectives and benefits that are gained from implementing El-Salam Canal are: redistributing population in Egyp t, protecting the eastern bord ers of the country, strengthening the Egyptian agricultural policy through increasing the cultivated areas and agricultural yield, increasing agricultural and national production and thus increasing exporting vegetables and fruits while decreasing food import, benefiting and making good use of agricultural drainage water as an important water re- source, creating work opportunities for the youth and establishing tourism, industrial and mining projects. Therefore, careful investigation and prediction of the quality of water throughout the canal is crucial. Many studies have been carried for assessment of the water quality of Bahr Hadous and El-Serw drains, [7-11], also many studies have been conducted about the agriculture development of El-Salam water [12-16], and few studies were conducted to study the water quality along El-Salam Med i t e rranean Sea Barda wi l Lake El - Arish Valle y El - Arish Manzala Lak Port -Said Ism a il li ya Damietta Suez El - Serw Drain Bahr Hadous Drain Ba h r El - Bak a r Dr ain Pr essurize d p ipeline North Sinai Development Project (1)Tina Plain Area 50,000 Feddans (2)South Qantara Area 75,000 Feddans (3)Rabaa A rea 70,000 Fedd ans (4)Bir El -Abd Area 70,000 Feddans (5)El-Serr Wa El - Quarir Area 135,000 Feddans Faraskour Drai El-Morra Lakes Suez Canal Suez C an a l El - Salam Canal P.S. 3 P.S. 2 P.S. 4 P.S. 6 Sheikh Gaber CanalShe ikh G aber C anal (Ope n Channel) P.S. 5 El - Salam Canal Intake El - Salam Syphon Under Suez Canal (1) (2) (3) (4) (5) N Med i t e rranean Sea Barda wi l Lake El - Arish Valle y El - Arish Manzala Lake Port -Said Ism a il li ya Suez Pr essurize d p ipeline North Sinai Development Project (1)Tina Plain Area 50,000 Feddans (2)South Qantara Area 75,000 Feddans (3)Rabaa A rea 70,000 Fedd ans (4)Bir El -Abd Area 70,000 Feddans (5)El-Serr Wa El - Quarir Area 135,000 Feddans El-Morra Lakes Suez Canal Suez C an a l Salam Canal P.S. 4 P.S. 6P.S. 7 Sheikh Gaber CanalShe ikh G aber C anal (Ope n Channel) P.S. 5 (1) (2) (3) (4) (5) Man zala Pump ing Stat i on P.S. 1 Figure 1. Layout of El-Salam Canal project. Copyright © 2012 SciRes. JWARP 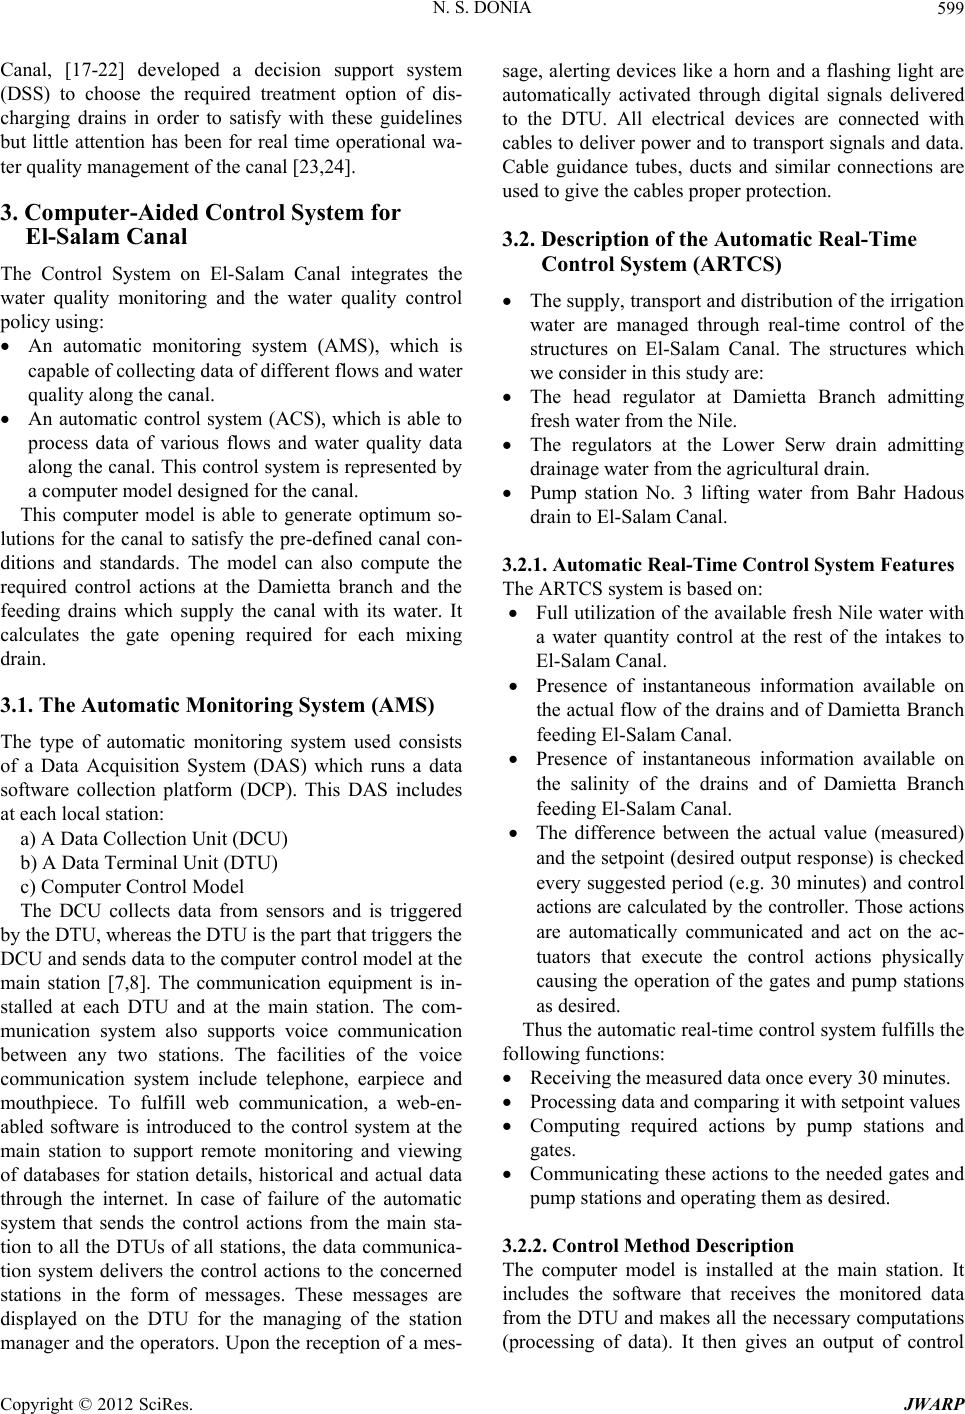 N. S. DONIA 599 Canal, [17-22] developed a decision support system (DSS) to choose the required treatment option of dis- charging drains in order to satisfy with these guidelines but little attention has been for real time operational wa- ter quality management of the canal [23,24]. 3. Computer-Aided Control System for El-Salam Canal The Control System on El-Salam Canal integrates the water quality monitoring and the water quality control policy using: An automatic monitoring system (AMS), which is capable of collecting data of different flows and water quality along the can a l. An automatic control system (ACS), which is able to process data of various flows and water quality data along the canal. Th is control system is represented by a computer model designed for the canal. This computer model is able to generate optimum so- lutions for the canal to satisfy the pre-defined canal con- ditions and standards. The model can also compute the required control actions at the Damietta branch and the feeding drains which supply the canal with its water. It calculates the gate opening required for each mixing drain. 3.1. The Automatic Monitoring System (AMS) The type of automatic monitoring system used consists of a Data Acquisition System (DAS) which runs a data software collection platform (DCP). This DAS includes at each local station: a) A Data Collection Unit (DCU) b) A Data Terminal Unit (DTU) c) Computer Control Model The DCU collects data from sensors and is triggered by the DTU, whereas the DTU is the part that triggers the DCU and sends data to the computer control model at the main station [7,8]. The communication equipment is in- stalled at each DTU and at the main station. The com- munication system also supports voice communication between any two stations. The facilities of the voice communication system include telephone, earpiece and mouthpiece. To fulfill web communication, a web-en- abled software is introduced to the control system at the main station to support remote monitoring and viewing of databases for station details, historical and actual data through the internet. In case of failure of the automatic system that sends the control actions from the main sta- tion to all the DTUs of all stations, the data communica- tion system delivers the control actions to the concerned stations in the form of messages. These messages are displayed on the DTU for the managing of the station manager and the operators. Upon the reception of a mes- sage, alerting devices like a horn and a flashing light are automatically activated through digital signals delivered to the DTU. All electrical devices are connected with cables to deliver power and to transport sign als and data. Cable guidance tubes, ducts and similar connections are used to give the cables proper protection. 3.2. Description of the Automatic Real-Time Control System (ARTCS) The supply, transport and distribution of the irrigation water are managed through real-time control of the structures on El-Salam Canal. The structures which we consider in this study are: The head regulator at Damietta Branch admitting fresh water from the Nile. The regulators at the Lower Serw drain admitting drainage water from the agricultural drain. Pump station No. 3 lifting water from Bahr Hadous drain to El-Salam Canal. 3.2.1. Automatic Real-Time Control System Featur es The ARTCS s ystem i s based on : Full utilization of th e available fresh Nile water with a water quantity control at the rest of the intakes to El-Salam Canal. Presence of instantaneous information available on the actual flow of the drains and of Damietta Branch feeding El-Salam Canal. Presence of instantaneous information available on the salinity of the drains and of Damietta Branch feeding El-Salam Canal. The difference between the actual value (measured) and the setpoint (desired output response) is checked every suggested period (e.g. 30 minutes) and control actions are calculated by the controller. Those actions are automatically communicated and act on the ac- tuators that execute the control actions physically causing the operation of the gates and pump stations as desired. Thus the automatic real-time contro l system fulfills the following functions: Receiving the measured data once every 30 minutes. Processing data and comparing it with setpoint values Computing required actions by pump stations and gates. Communicating these actions to the needed gates and pump stations and operating them as desired. 3.2.2. Control Met h od Description The computer model is installed at the main station. It includes the software that receives the monitored data from the DTU and makes all the necessary computations (processing of data). It then gives an output of control Copyright © 2012 SciRes. JWARP 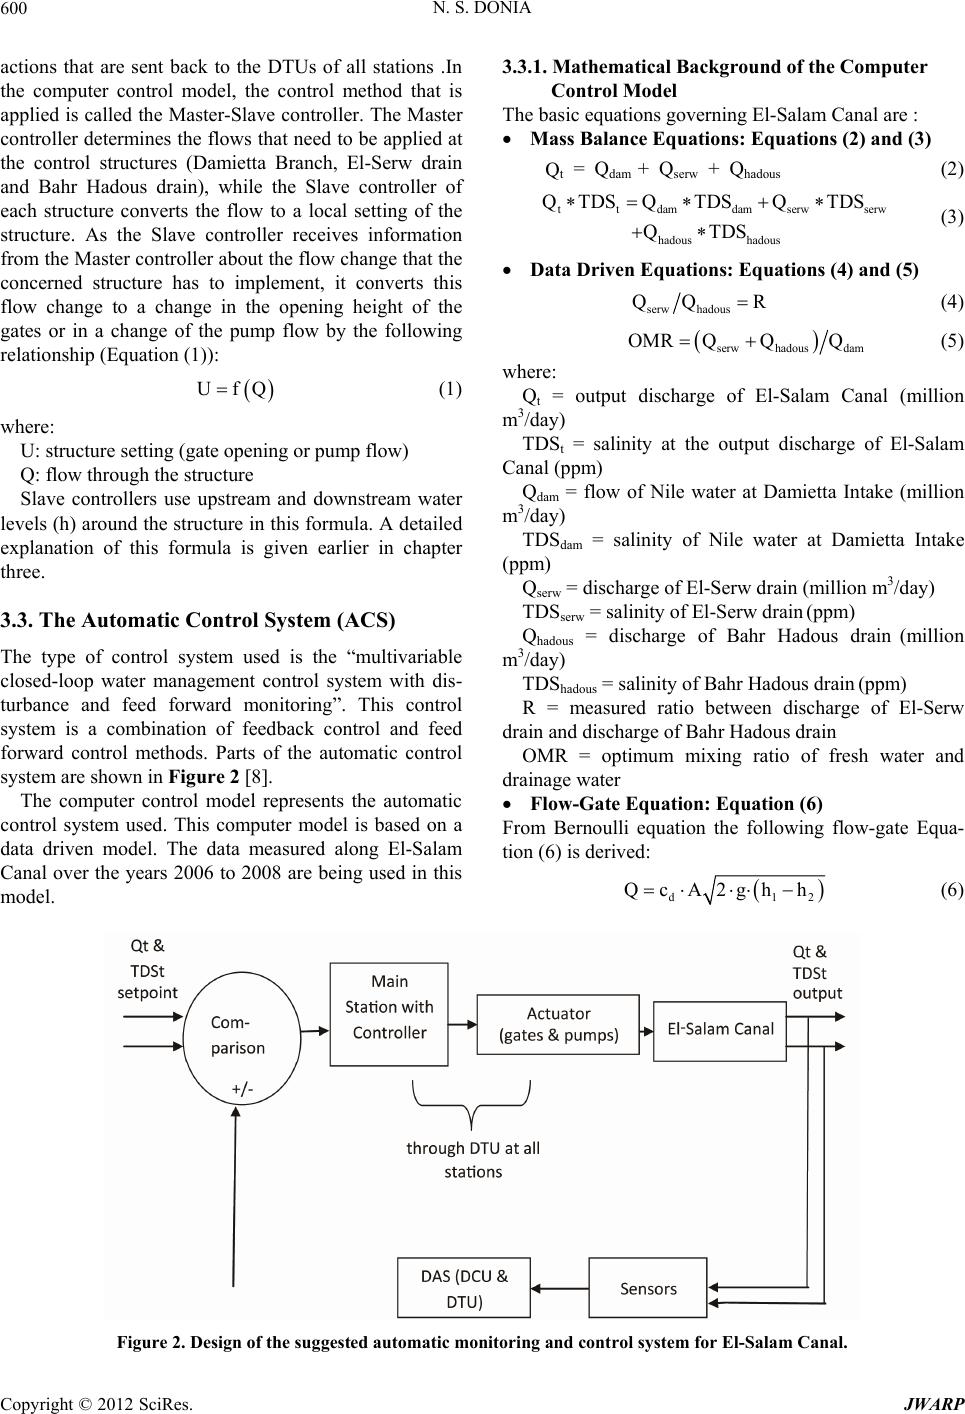 N. S. DONIA 600 actions that are sent back to the DTUs of all stations .In the computer control model, the control method that is applied is called the Master-Slave controller. Th e Master controller determines the flows that need to be applied at the control structures (Damietta Branch, El-Serw drain and Bahr Hadous drain), while the Slave controller of each structure converts the flow to a local setting of the structure. As the Slave controller receives information from the Master controller about the flow change that the concerned structure has to implement, it converts this flow change to a change in the opening height of the gates or in a change of the pump flow by the following relationship (Equation (1)): UfQ ttdamdam serwserw hadous hadous Q TDSQTDSQTDS QTDS (1) where: U: structu re setting (gat e opening or pu mp flow) Q: flow through the structure Slave controllers use upstream and downstream water levels (h) around the structure in th is formula. A detailed explanation of this formula is given earlier in chapter three. 3.3. The Automatic Control System (ACS) The type of control system used is the “multivariable closed-loop water management control system with dis- turbance and feed forward monitoring”. This control system is a combination of feedback control and feed forward control methods. Parts of the automatic control system are shown in Figure 2 [8]. The computer control model represents the automatic control system used. This computer model is based on a data driven model. The data measured along El-Salam Canal over the years 2006 to 2008 are being used in this model. 3.3.1. M athematical Background of the Computer Control Model The basic equations governing El-Salam Canal are : Mass Balance Equations: Equations (2) and (3) Qt = Qdam + Qserw + Qhadous (2) (3) Data Driven Equations: Equations (4) and (5) serw hadous QQ R (4) serwhadous dam OMR QQQ (5) where: Qt = output discharge of El-Salam Canal (million m3/day) TDSt = salinity at the output discharge of El-Salam Canal (ppm) Qdam = flow of Nile water at Damietta Intake (million m3/day) TDSdam = salinity of Nile water at Damietta Intake (ppm) Qserw = discharge of El-Serw drain (million m3/day) TDSserw = salinity of El-Serw drain (ppm) Qhadous = discharge of Bahr Hadous drain (million m3/day) TDShadous = salinity of Bahr Hadous drain (ppm) R = measured ratio between discharge of El-Serw drain and discharge of Bahr Hadous drain OMR = optimum mixing ratio of fresh water and drainage water Flow-Gate Equation: Equation (6) From Bernoulli equation the following flow-gate Equa- tion (6) is derived: d12 QcA2gh h (6) Figure 2. Design of the suggested automatic monitoring and control system for El-Salam Canal. Copyright © 2012 SciRes. JWARP 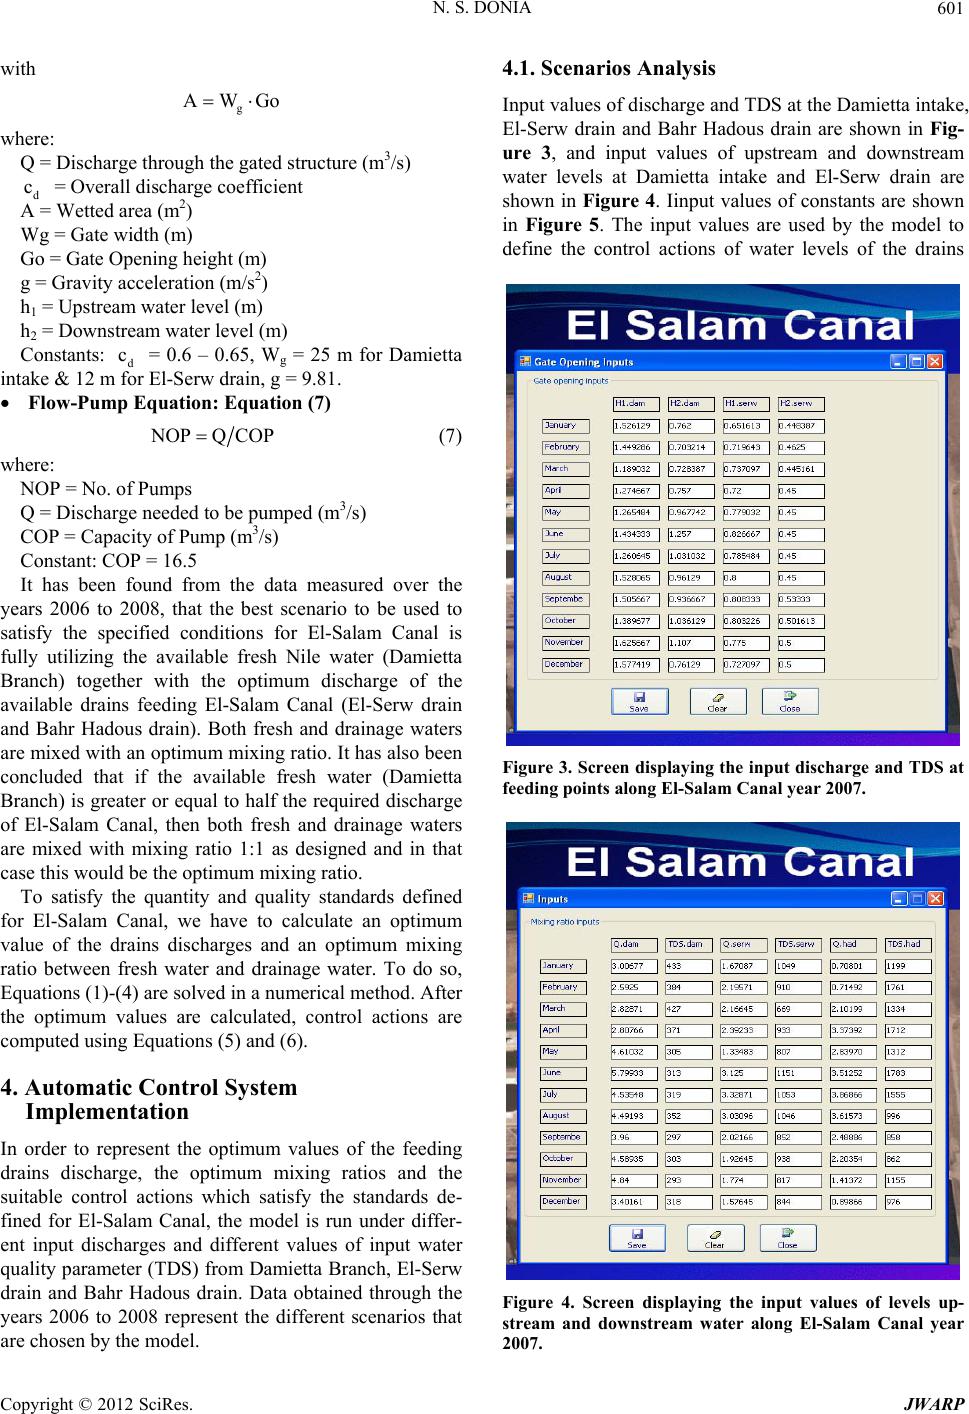 N. S. DONIA 601 with g AWGo c c where: Q = Discharge through the gated structure (m3/s) d A = Wetted area (m2) = Overall discharge coefficient Wg = Gate width (m) Go = Gate Opening height (m) g = Gravity acceleration (m/s2) h1 = Upstream water level (m) h2 = Downstream water level (m) Constants: d = 0.6 – 0.65, Wg = 25 m for Damietta intake & 12 m for El-Serw drain, g = 9.81. Flow-Pump Equation: Equation (7) N OPQ COP (7) where: NOP = No. of Pumps Q = Discharge needed to be pumped (m3/s) COP = Capacity of Pump (m3/s) Constant: COP = 16.5 It has been found from the data measured over the years 2006 to 2008, that the best scenario to be used to satisfy the specified conditions for El-Salam Canal is fully utilizing the available fresh Nile water (Damietta Branch) together with the optimum discharge of the available drains feeding El-Salam Canal (El-Serw drain and Bahr Hadous drain). Both fresh and drainage waters are mixed with an optimum mixing ratio. It has also been concluded that if the available fresh water (Damietta Branch) is greater or equal to half the required discharge of El-Salam Canal, then both fresh and drainage waters are mixed with mixing ratio 1:1 as designed and in that case this would be the optimum mixing ratio. To satisfy the quantity and quality standards defined for El-Salam Canal, we have to calculate an optimum value of the drains discharges and an optimum mixing ratio between fresh water and drainage water. To do so, Equations (1)-(4) are solved in a numerical method. After the optimum values are calculated, control actions are computed using Equations (5) and (6). 4. Automatic Control System Implementation In order to represent the optimum values of the feeding drains discharge, the optimum mixing ratios and the suitable control actions which satisfy the standards de- fined for El-Salam Canal, the model is run under differ- ent input discharges and different values of input water quality parameter (TDS) from Damietta Branch, El-Serw drain and Bahr Hadous drain. Data obtained through the years 2006 to 2008 represent the different scenarios that are chosen by the model. 4.1. Scenarios Analysis Input values of discharge and TDS at the Damietta intake, El-Serw drain and Bahr Hadous drain are shown in Fig- ure 3, and input values of upstream and downstream water levels at Damietta intake and El-Serw drain are shown in Figure 4. Iinput values of constants are shown in Figure 5. The input values are used by the model to define the control actions of water levels of the drains Figure 3. Scr een displaying the input discharge and TDS at feeding points along El-Salam Canal year 2007. Figure 4. Screen displaying the input values of levels up- stream and downstream water along El-Salam Canal year 2007. Copyright © 2012 SciRes. JWARP 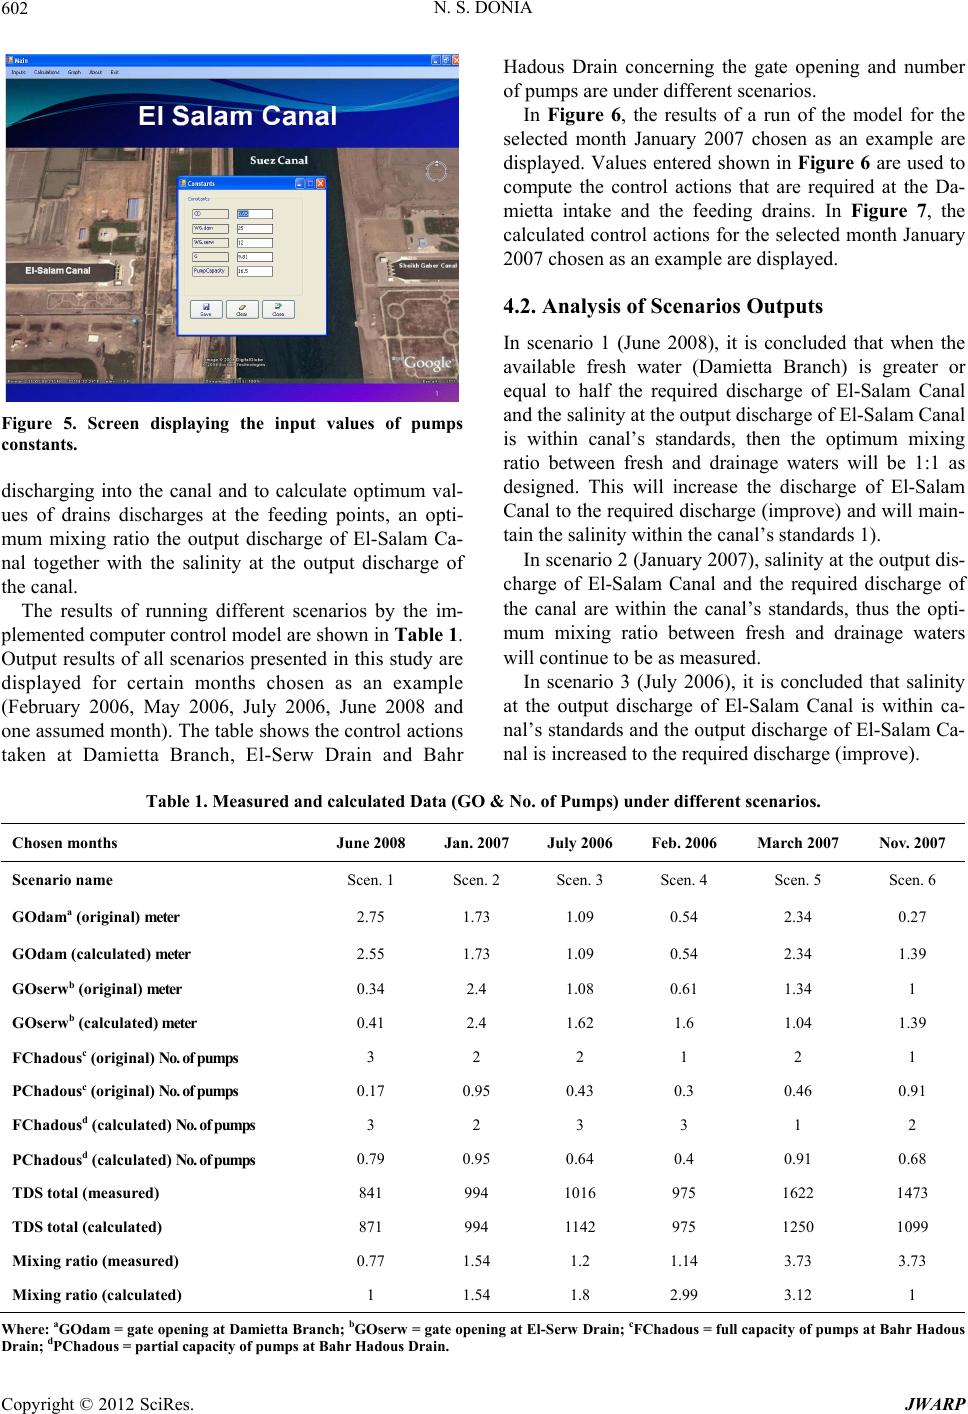 N. S. DONIA 602 Figure 5. Screen displaying the input values of pumps constants. discharging into the canal and to calculate optimum val- ues of drains discharges at the feeding points, an opti- mum mixing ratio the output discharge of El-Salam Ca- nal together with the salinity at the output discharge of the canal. The results of running different scenarios by the im- plemented computer control model are shown in Table 1. Output results of all scenarios presented in this study are displayed for certain months chosen as an example (February 2006, May 2006, July 2006, June 2008 and one assumed month). The table shows the control actions taken at Damietta Branch, El-Serw Drain and Bahr Hadous Drain concerning the gate opening and number of pumps are under different scenarios. In Figure 6, the results of a run of the model for the selected month January 2007 chosen as an example are displayed. Values entered shown in Figure 6 are used to compute the control actions that are required at the Da- mietta intake and the feeding drains. In Figure 7, the calculated control actions for the selected month January 2007 chosen as an example are displayed. 4.2. Analysis of Scenarios Outputs In scenario 1 (June 2008), it is concluded that when the available fresh water (Damietta Branch) is greater or equal to half the required discharge of El-Salam Canal and the salinity at the output discharge of El-Salam Canal is within canal’s standards, then the optimum mixing ratio between fresh and drainage waters will be 1:1 as designed. This will increase the discharge of El-Salam Canal to the req uired discharge (improve) and will main- tain the salinity within the canal’s standards 1). In scenario 2 (January 2007), salinity at the output dis- charge of El-Salam Canal and the required discharge of the canal are within the canal’s standards, thus the opti- mum mixing ratio between fresh and drainage waters will continue to be as measured. In scenario 3 (July 2006), it is concluded that salinity at the output discharge of El-Salam Canal is within ca- nal’s standards and the output discharge of El-Salam Ca- nal is increased to the required discharge (improve). Table 1. Measured and calculated Data (GO & No. of Pumps) under different scenarios. Chosen months June 2008 Jan. 2 00 7 July 2006 Feb. 2006 March 2007 Nov. 2007 Scenario name Scen. 1 Scen. 2 Scen. 3 Scen. 4 Scen. 5 Scen. 6 GOdama (original) meter 2.75 1.73 1.09 0.54 2.34 0.27 GOdam (calculated) meter 2.55 1.73 1.09 0.54 2.34 1.39 GOserwb (original) meter 0.34 2.4 1.08 0.61 1.34 1 GOserwb (calculated) me ter 0.41 2.4 1.62 1.6 1.04 1.39 FChadousc (original) No. of pumps 3 2 2 1 2 1 PChadousc (original) No. of pumps 0.17 0.95 0.43 0.3 0.46 0.91 FChadousd (calculated) No. of pumps 3 2 3 3 1 2 PChadousd (calculated) No. of pumps 0.79 0.95 0.64 0.4 0.91 0.68 TDS total (measured) 841 994 1016 975 1622 1473 TDS total (calculated) 871 994 1142 975 1250 1099 Mixing ratio (measured) 0.77 1.54 1.2 1.14 3.73 3.73 Mixing ratio (calculated) 1 1.54 1.8 2.99 3.12 1 Where: aGOdam = gate opening at Damietta Branch; bGOserw = gate openin g at El-S erw Drain; cFChado us = full ca pacit y of pumps at Bah r Hadous rain; dPChadous = partial capacity of pumps at Bahr Hadous Drain. D Copyright © 2012 SciRes. JWARP 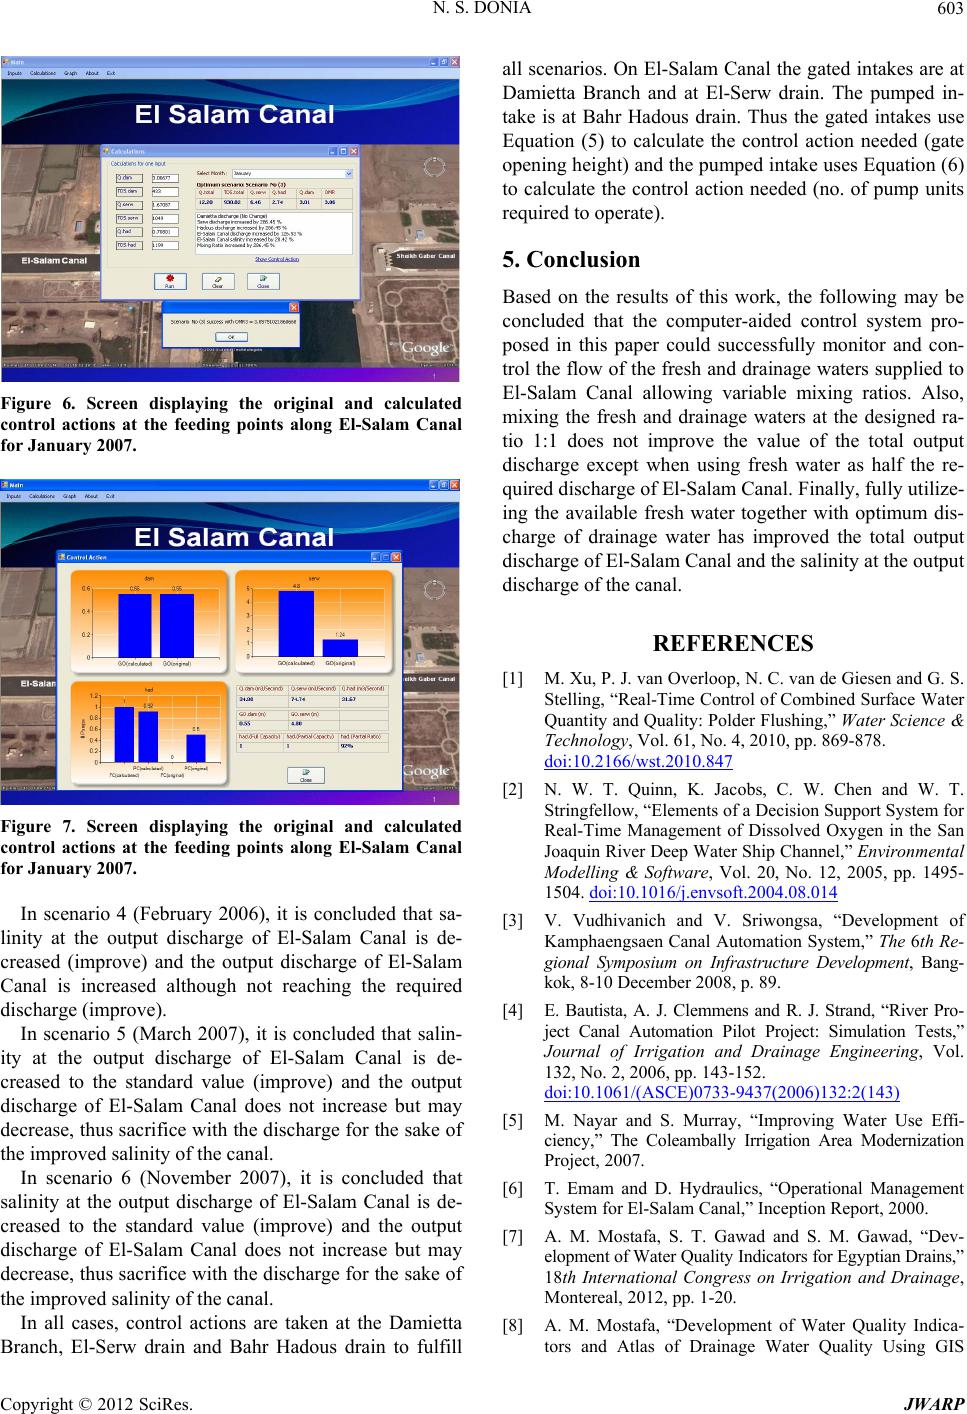 N. S. DONIA 603 Figure 6. Screen displaying the original and calculated control actions at the feeding points along El-Salam Canal for January 2007. Figure 7. Screen displaying the original and calculated control actions at the feeding points along El-Salam Canal for January 2007. In scenario 4 (February 2006), it is concluded that sa- linity at the output discharge of El-Salam Canal is de- creased (improve) and the output discharge of El-Salam Canal is increased although not reaching the required discharge (improve). In scenario 5 (March 2007), it is concluded that salin- ity at the output discharge of El-Salam Canal is de- creased to the standard value (improve) and the output discharge of El-Salam Canal does not increase but may decrease, thus sacrifice with the discharge for the sake of the improved salinity of the canal. In scenario 6 (November 2007), it is concluded that salinity at the output discharge of El-Salam Canal is de- creased to the standard value (improve) and the output discharge of El-Salam Canal does not increase but may decrease, thus sacrifice with the discharge for the sake of the improved salinity of the canal. In all cases, control actions are taken at the Damietta Branch, El-Serw drain and Bahr Hadous drain to fulfill all scenarios. On El-Salam Canal the gated intakes are at Damietta Branch and at El-Serw drain. The pumped in- take is at Bahr Hadous drain. Thus the gated intakes use Equation (5) to calculate the control action needed (gate opening height) and the pumped intake uses Equation (6) to calculate the control action needed (no. of pump units required to operate). 5. Conclusion Based on the results of this work, the following may be concluded that the computer-aided control system pro- posed in this paper could successfully monitor and con- trol the flow of the fresh and drainag e waters supplied to El-Salam Canal allowing variable mixing ratios. Also, mixing the fresh and drainage waters at the designed ra- tio 1:1 does not improve the value of the total output discharge except when using fresh water as half the re- quired discharge of El-Salam Canal. Finally, fully utilize- ing the available fresh water together with optimum dis- charge of drainage water has improved the total output discharge of El-Salam Canal and the salinity at the output discharge of the canal. REFERENCES [1] M. Xu, P. J. van Overloop, N. C. van de Giesen and G. S. Stelling, “Real-Time Control of Combined Surface Water Quantity and Quality: Polder Flushing,” Water Science & Technology, Vol. 61, No. 4, 2010, pp. 869-878. doi:10.2166/wst.2010.847 [2] N. W. T. Quinn, K. Jacobs, C. W. Chen and W. T. Stringfellow, “Elements of a Decision Support System for Real-Time Management of Dissolved Oxygen in the San Joaquin River Deep Water Ship Channel,” Environmental Modelling & Software, Vol. 20, No. 12, 2005, pp. 1495- 1504. doi:10.1016/j.envsoft.2004.08.014 [3] V. Vudhivanich and V. Sriwongsa, “Development of Kamphaengsaen Canal Automation System,” The 6th Re- gional Symposium on Infrastructure Development, Bang- kok, 8 -10 December 2008, p. 89. [4] E. Bautista, A. J. Clemmens and R. J. Strand, “River Pro- ject Canal Automation Pilot Project: Simulation Tests,” Journal of Irrigation and Drainage Engineering, Vol. 132, No. 2, 2006, pp. 143-152. doi:10.1061/(ASCE)0733-9437(2006)132:2(143) [5] M. Nayar and S. Murray, “Improving Water Use Effi- ciency,” The Coleambally Irrigation Area Modernization Project, 2007. [6] T. Emam and D. Hydraulics, “Operational Management System for El-Salam Canal,” Inception Report, 2000. [7] A. M. Mostafa, S. T. Gawad and S. M. Gawad, “Dev- elopment of Water Quality Indicators for Egyptian Drains,” 18th International Congress on Irrigation and Drainage, Montereal, 2012, pp. 1-20. [8] A. M. Mostafa, “Development of Water Quality Indica- tors and Atlas of Drainage Water Quality Using GIS Copyright © 2012 SciRes. JWARP 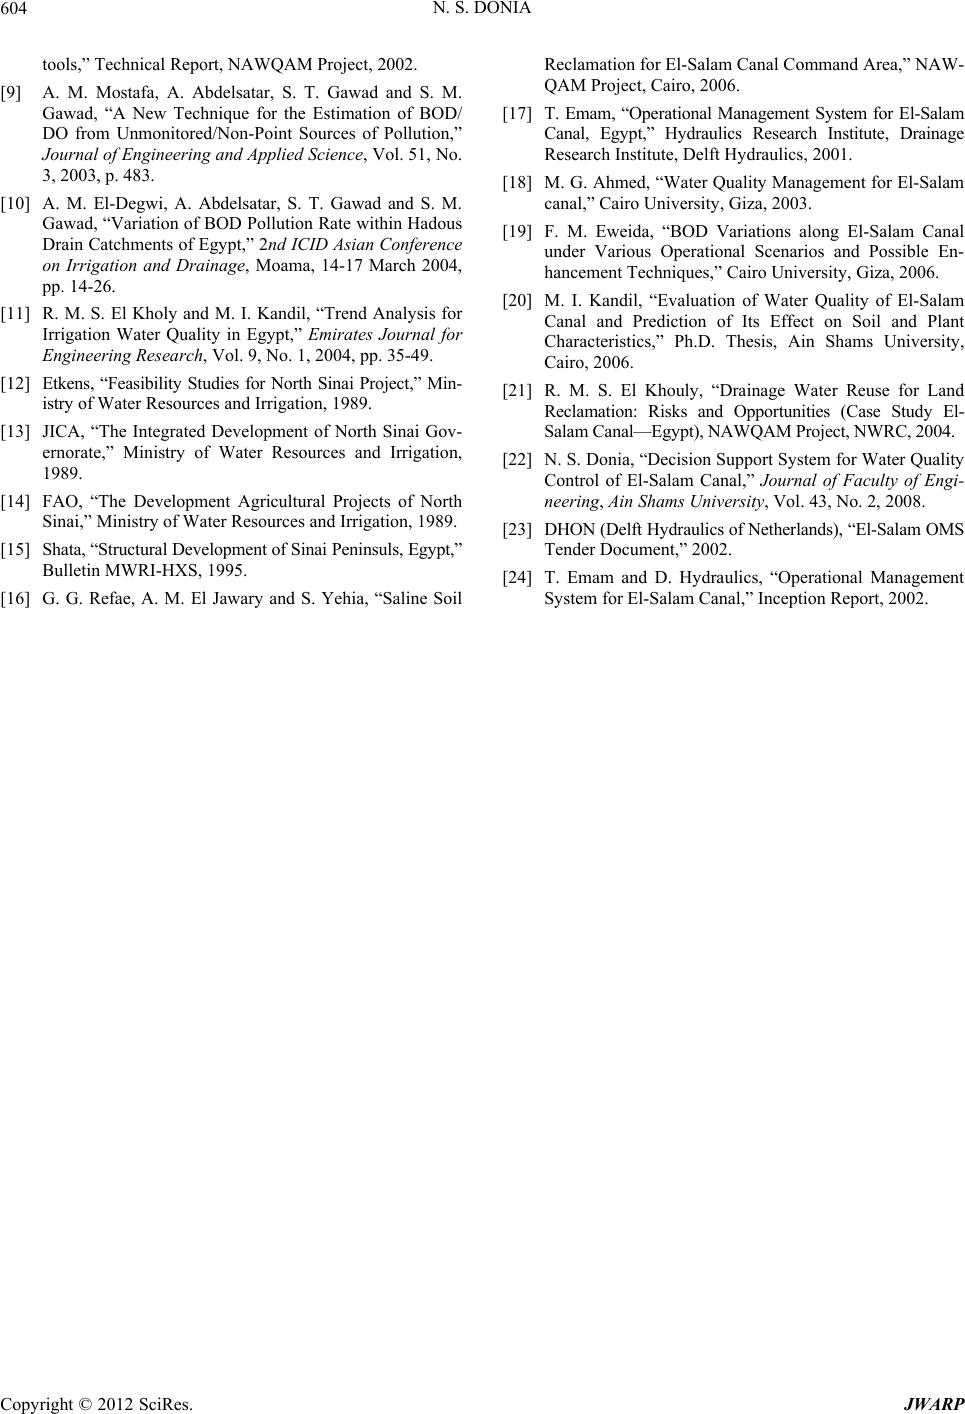 N. S. DONIA 604 tools,” Technical Report, NAWQAM Project, 2002. [9] A. M. Mostafa, A. Abdelsatar, S. T. Gawad and S. M. Gawad, “A New Technique for the Estimation of BOD/ DO from Unmonitored/Non-Point Sources of Pollution,” Journal of Engineering and Applied Science, Vol. 51, No. 3, 2003, p. 483. [10] A. M. El-Degwi, A. Abdelsatar, S. T. Gawad and S. M. Gawad, “Variation of BOD Pollution Rate within Hadous Drain Catchments of Egypt,” 2nd ICID Asian Conference on Irrigation and Drainage, Moama, 14-17 March 2004, pp. 14-26. [11] R. M. S. El Kholy and M. I. Kandil, “Trend Analysis for Irrigation Water Quality in Egypt,” Emirates Journal for Engineering Research, Vol. 9, No. 1, 2004, pp. 35-49. [12] Etkens, “Feasibility Studies for North Sinai Project,” Min- istry of Water Resources and Irrigation, 1989. [13] JICA, “The Integrated Development of North Sinai Gov- ernorate,” Ministry of Water Resources and Irrigation, 1989. [14] FAO, “The Development Agricultural Projects of North Sinai,” Ministry of Water Resources and Irrigation, 1989. [15] Shata, “Structural Development of Sinai Peninsul s, Egypt,” Bulletin MWRI-HXS, 1995. [16] G. G. Refae, A. M. El Jawary and S. Yehia, “Saline Soil Reclamation for El-Salam Canal Command Area,” NAW- QAM Project, Cairo, 2006. [17] T. Emam, “Operational Management System for El-Salam Canal, Egypt,” Hydraulics Research Institute, Drainage Research Institute, Delft Hydraulics, 2001. [18] M. G. Ahmed, “Water Quality Management for El-Salam canal,” Cairo University, Giza, 2003. [19] F. M. Eweida, “BOD Variations along El-Salam Canal under Various Operational Scenarios and Possible En- hancement Techniques,” Cairo University, Giza, 2006. [20] M. I. Kandil, “Evaluation of Water Quality of El-Salam Canal and Prediction of Its Effect on Soil and Plant Characteristics,” Ph.D. Thesis, Ain Shams University, Cairo, 2006. [21] R. M. S. El Khouly, “Drainage Water Reuse for Land Reclamation: Risks and Opportunities (Case Study El- Salam Canal—Egypt), NAWQAM Project, NWRC, 2004. [22] N. S. Donia, “Decision Support System for Water Quality Control of El-Salam Canal,” Journal of Faculty of Engi- neering, Ain Shams University, Vol. 43, No. 2, 2008. [23] DHON (Delft Hydraulics of Netherlands), “El-Salam OMS Tender Document,” 2002. [24] T. Emam and D. Hydraulics, “Operational Management System for El-Salam Canal,” Inception Report, 2002. Copyright © 2012 SciRes. JWARP |