

Paper Menu >>
Journal Menu >>
 Journal of Minerals and Materials Characterization and Engineering, 2012, 11, 841-847 Published Online August 2012 (http://www.SciRP.org/journal/jmmce) Computational Approach to Modelling Fracture Behaviour of Polypropylen e/Talc Composites Chinedum Ogonna Mgbemena1*, Obuora Anozie Okoye2 1National Engineering Design Development Institute, Nnewi, Nigeria 2Nnamdi Azikiwe University, Awka, Nigeria Email: *[email protected] Received June 20, 2012; revised July 30, 2012; accepted August 14, 2012 ABSTRACT Fracture represents one of the major problems associated with the selection and use of engineering materials for high temperature applications. The fracture toughness is of special relevance on the design of components. In this work, the fracture behavior of Polypropylene/Talc composites was studied. From the results of the tensile and flexural tests con- ducted on the composite, scatter diagrams were made using Microsoft Excel to evaluate and show the effect of the addi- tion of the talc filler as it affects the tensile strength, percentage elongation at break, flexural strength and modulus. In order to give additional analysis, the talc filler content effect was presented mathematically to further describe explicitly the various equations associated with each scatter diagram earlier developed using Microsoft Excel. The mathematical expression developed shows the actual talc filler content on the fracture mechanical properties of the sample composite. Keywords: Fracture; Tensile Strength; Talc; Polypropylene; Flexural Strength; Tensile Test 1. Introduction Polypropylene (PP) composite is one of the most exten- sively produced polymers, widely used especially as automotive parts [1]. This is attributed to their high im- pact strength and toughness when fillers are incorpo- rated. Polypropylene is isotactic, notch sensitive and brittle under severe conditions of deformation, such as low temperatures or high temperatures. This makes limited its wider range of usage for manufacturing processes. It is a versatile material widely used for automotive compo- nents, home appliances, and industrial applications. Polypropylene (PP) filled with particulate fillers is of great interest in both research and industry. It is well known that polypropylene has good processability and accepts different types of natural and synthetic filers. Mica, kaolin, calcium carbonate, and talc are the most often used fillers to reduce both the production costs and to improve the properties of the thermoplastics, such as rigidity, strength, hardness, flexural modulus, dimen- sional stability, crystallinity, electrical and thermal con- ductivity. However, fillers have a detrimental effect on other properties such as the impact property and de- formability. The filler type, content and size, interfacial adhesion and bond strength between PP matrix and filler and surface characteristics of the composite can greatly influence the filled system. In a highly filled polymer system, non-uniformity of properties can exist because of poor dispersion of the filler in the matrix. A good interfacial adhesion between matrix and filler may improve the mechanical strength [1-8]. Due to the high transient temperature and in par- ticular, at low stress temperatures, notch toughness of polypropylene is not sufficient and limits its applications. Introduction of fillers or reinforcements into PP often alters the crystalline structure and morphology of PP and consequently results in property changes [5,9]. Although toughness strength is improved by blending elastomer, this causes a decrease in strength and stiffness [10]. In order to overcome these limitations numerous studies have been performed to improve the toughness, stiffness, and strength balance. Therefore, polypropylene has been modified by different fillers and elastomers to produce ternary composites. The mechanical properties of such ternary composites are determined not only by their composition and the characteristics of the components but also by the phase morphology, and in particular, the relative dispersion of additive components [11]. To meet demanding engineering and structural speci- fications, PP is rarely used in its original state and is of- ten transformed into composites by the inclusion of fill- ers or reinforcements. There are a number of inorganic mineral fillers used with Polypropylene. The most common of these fillers *Corresponding author. Copyright © 2012 SciRes. JMMCE  C. O. MGBEMENA, O. A. OKOYE 842 are talc, calcium carbonate and barium sulphate; other mineral fillers used are calcium silicate (wollastonite) and mica (aluminosilicates). Mineral fillers are generally much less expensive than polypropylene resin itself. Mineral fillers reduce the costs of the compound formed with polypropylene and also increase the stiffness. Mineral fillers also provide reinforcement to the polymer matrix as well. Some min- eral fillers are surface treated to improve their handling and performance characteristics. Silanes, glycols, and stearates are used commercially to improve dispersion, processing, and also to react with impurities [10]. In this work, the mineral filler used is talc. Hydrated magnesium silicate [Mg3Si4O10(OH)2], or better known as talc occurs as the alteration products of magnesium carbonate rock by the natural action of hydrothermal solutions. The purer forms are called steatite talc. The advantages of talc are: Good stiffness, hardness, dimen- sional stability and reduced creep compared with un- modified PP [12]. Talc can resist temperatures up to 900˚C. It is unaf- fected by chemicals and will not harm living tissue. Talc can be utilized as a medium filler of average whiteness in thermosetting as well as thermoplastic resins where im- provements in electrical insulation, heat, and moisture resistance, chemical inertness and good machinability are needed. Talc has low absorption rate and because of its plate like structure, certain grades can improve flexural properties of mouldings. In PP, talc gives a good balance of rigidity and impact strength [13]. Advanced milling technology can be used to obtain the finest talc without reducing the reinforcing power of the lamellar structure. Talc filled composites are also easier to colour with reduced pigment require- ment due to its whiteness and low yellow index. Al- though investigations on talc-filled PP have been done since the 1981, there are still many works that involve the characterization of talc filled PP, which are still on- going until today [8]. 2. Materials and Methods 2.1. Materials The grade of Polypropylene used in this work was SEETEC Homo polymer PP by LG Chem Korea. This acts as the matrix. The homo polymer PP has a density of 0.90 g/cm3 and a melt flow rate of 14 g/10 minutes (2.16 kg at 230˚C). The nano filler used in this work was Talc (Zeta talc EW 20) manufactured by Eral, Turkey, with particle size of around 2 μm. All the materials were pur- chased from the local chemical market at Ajasa Ose, Onitsha. The mould release agent used was Petroleum jelly (Vaseline). The characteristic properties of the ma- terials are shown in Table 1. The nanocomposites were prepared by melting the PP in a mixer and melt compounding it with talc respec- tively at filler loadings of 0%, 5%, 10%, 15%, 20%, 25%, 30%, 35% and 40% volume fractions. The tensile sam- ples were cast in an aluminum mould in accordance with ASTM standard D638 for tensile tests, D790 for flexural tests and D256 for impact tests. 2.2. Method of Preparation Manual Mixing and Compounding The PP was melted from its pelletized form at a tem- perature exceeding 180˚C in a mixing chamber. Meas- ured amounts of Talc were added to the melted PP by volume fractions and stirred continuously for 10 minutes to ensure a uniform dispersion of the mixture. The com- pounded mixture was cast in an aluminum mould that has been treated with a mould releasing agent and dried. The composite was allowed to cure for 72 hours and was later de-moulded. The composition of composites taken for mechanical tests is shown in Table 2. 2.3. Tensile Testing of the Samples The tensile experiment was performed on ABBA Uni- versal Testing Machine at a laboratory temperature of 25˚C. The testing machine has rectangular upper and lower grip equipped with centre marking to facilitate the correct positioning of the test specimen when mounted vertically. Tensile testing was performed to determine elastic modulus, ultimate stress, and ultimate strain for all samples. The specimen was prepared and tested in accordance with ASTM D 638. A minimum of seven samples were tested in each specimen at their various volume fractions. The speci- men subjected to tensile test has the dimension 50 × 30 × 20 mm. Table 1. Characteristic properties of the materials used for the composites. Material Trade Name Supplier Melt Flow IndexDensity g/cm3 Melting Temperature ˚C Shape Polypropylene SEETEC Homo Polymer LG Chem Korea 230˚C, 2.16 kg/10 min 0.90 170 Pellets Talc Zeta talc EW 20 Eral Turkey - 2.7 - Powder Copyright © 2012 SciRes. JMMCE  C. O. MGBEMENA, O. A. OKOYE 843 Table 2. Combination of composites taken for mechanical tests by volume fractions. Specimen Code PP % Talc % PPT-0 PPT-1 PPT-2 PPT-3 PPT-4 PPT-5 PPT-6 PPT-7 PPT-8 100 95 90 85 80 75 70 65 60 0 5 10 15 20 25 30 35 40 In order to analyze the data, load was converted to stress, σ, from Equation (1) 0 F A (1) where F is the force applied as reported from the tensile testing equipment, and A0 is the original cross sectional area calculated from the average of the sample’s neck measurements. Displacement was converted to millimeters and strain, ε, was calculated using 0 l l l 0 l (2) where the change in length of the sample as ob- tained from the extensometer data, and is the original extensometer gage length. The natural strain (or True fracture ductility) is ex- pressed as 0 ln n f A A (3) where A0 is the original cross sectional area calculated from the average of the sample’s neck measurements and Af is the Area of the fractured surface. The Ultimate strength is expressed as max 0 u F A b E (4) where Fmax is the maximum applied force to break the specimen. Ultimate stress and strain were taken as the maximum values at the sample fracture point, as determined in the data. Results from multiple tests were averaged for each system. 2.4. Flexural Testing of the Samples Flexural modulus and strength were measured according to ASTM D790 test method with three point bending and was carried out using Instron Universal testing Machine Series XI and support span length was adjusted to 50 mm. The Flexural Modulus values () were calculated using the following equation: 3 3 4 b Lm Ebd (5) where, m is the slope of the tangent to the initial straight line portion of the load-deflection curve. The Flexural strength (S) in the units of MPa was cal- culated using the following equation: 2 3 2 PL Sbd (6) where P is the applied load at the deflection point, L is the span length, d and b are the thickness and width of the specimen respectively. 3. Results and Discussion From the results of the tensile and flexural tests con- ducted on the composite, scatter diagrams were made using Microsoft Excel to evaluate/show the effect of the addition of the talc filler as it affects the tensile strength, percentage elongation at break, flexural strength and modulus. In order to give additional analysis, the talc filler content effect was presented mathematically to fur- ther describe explicitly the various equations associated with each scatter diagram earlier developed using Mi- crosoft Excel. This mathematical expression shows the actual talc filler content on the fracture mechanical prop- erties of the sample composite. Furthermore, the experimental data was used to search for a relationship amongst the fracture mechanical prop- erties in order to predict the point of convergence of the product material properties in terms of its fracture me- chanical properties. 3.1. Tensile Test Results Figure 1 depicts the linearity of the stress-strain proper- ties obtained from the tensile tests. It explains ductile to brittle transition of the PP matrix as talc filler particles are incorporated. At lower talc filler concentrations of 5% - 20%, extensive plastic deformations (molecular chain breakage) took place before fracture of the Talc/PP composite when the tensile test was performed. The line- arity of the initial part is consistent with the Principles of Hooke’s Law for elastic deformation and the Young’s Modulus of Elasticity can be obtained from the straight line. Also, at filler concentration higher than 20%, the Talc/PP composite exhibited little and no plastic defor- mation before fracture. This is because the Talc/PP com- posite displays less ductile characteristics and miniature Copyright © 2012 SciRes. JMMCE 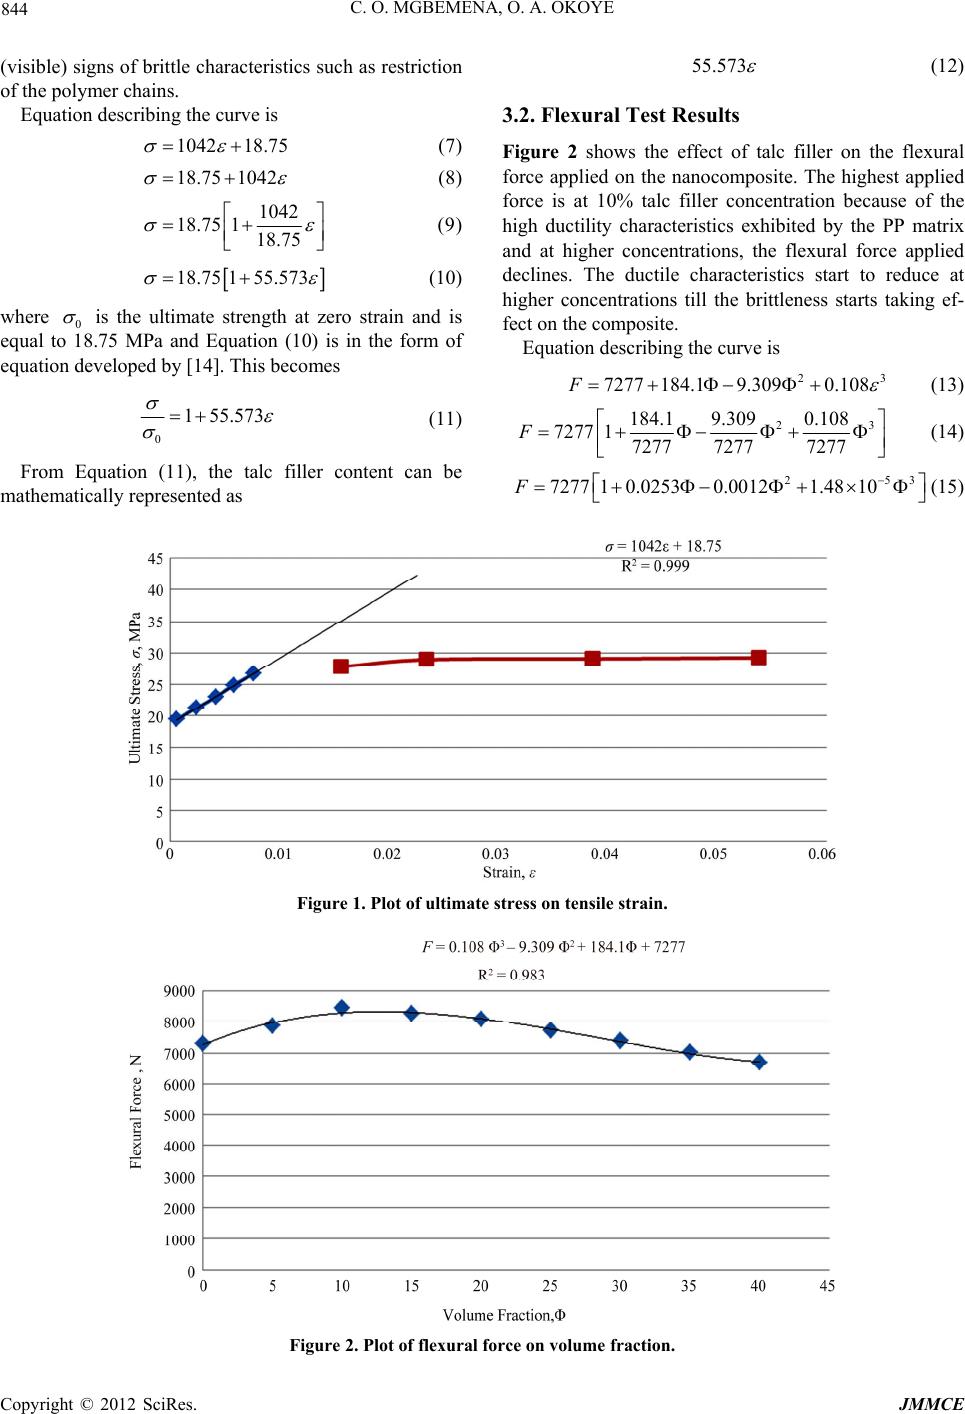 C. O. MGBEMENA, O. A. OKOYE 844 (visible) signs of brittle characteristics such as restriction of the polymer chains. Equation describing the curve is 1042 18.75 8.75 1042 (7) 1 (8) 1042 118.75 18.75 (9) 18.75 155.573 (10) where 0 is the ultimate strength at zero strain and is equal to 18.75 MPa and Equation (10) is in the form of equation developed by [14]. This becomes 0 1 55.573 55.573 (11) From Equation (11), the talc filler content can be mathematically represented as (12) 3.2. Flexural Test Results Figure 2 shows the effect of talc filler on the flexural force applied on the nanocomposite. The highest applied force is at 10% talc filler concentration because of the high ductility characteristics exhibited by the PP matrix and at higher concentrations, the flexural force applied declines. The ductile characteristics start to reduce at higher concentrations till the brittleness starts taking ef- fect on the composite. Equation describing the curve is 23 7277 184.19.3090.108F (13) 23 184.1 9.3090.108 7277 17277 72777277 F 253 7277 10.02530.00121.4810F (14) (15) Figure 1. Plot of ultimate stress on tensile strain. Figure 2. Plot of flexural force on volume fraction. Copyright © 2012 SciRes. JMMCE 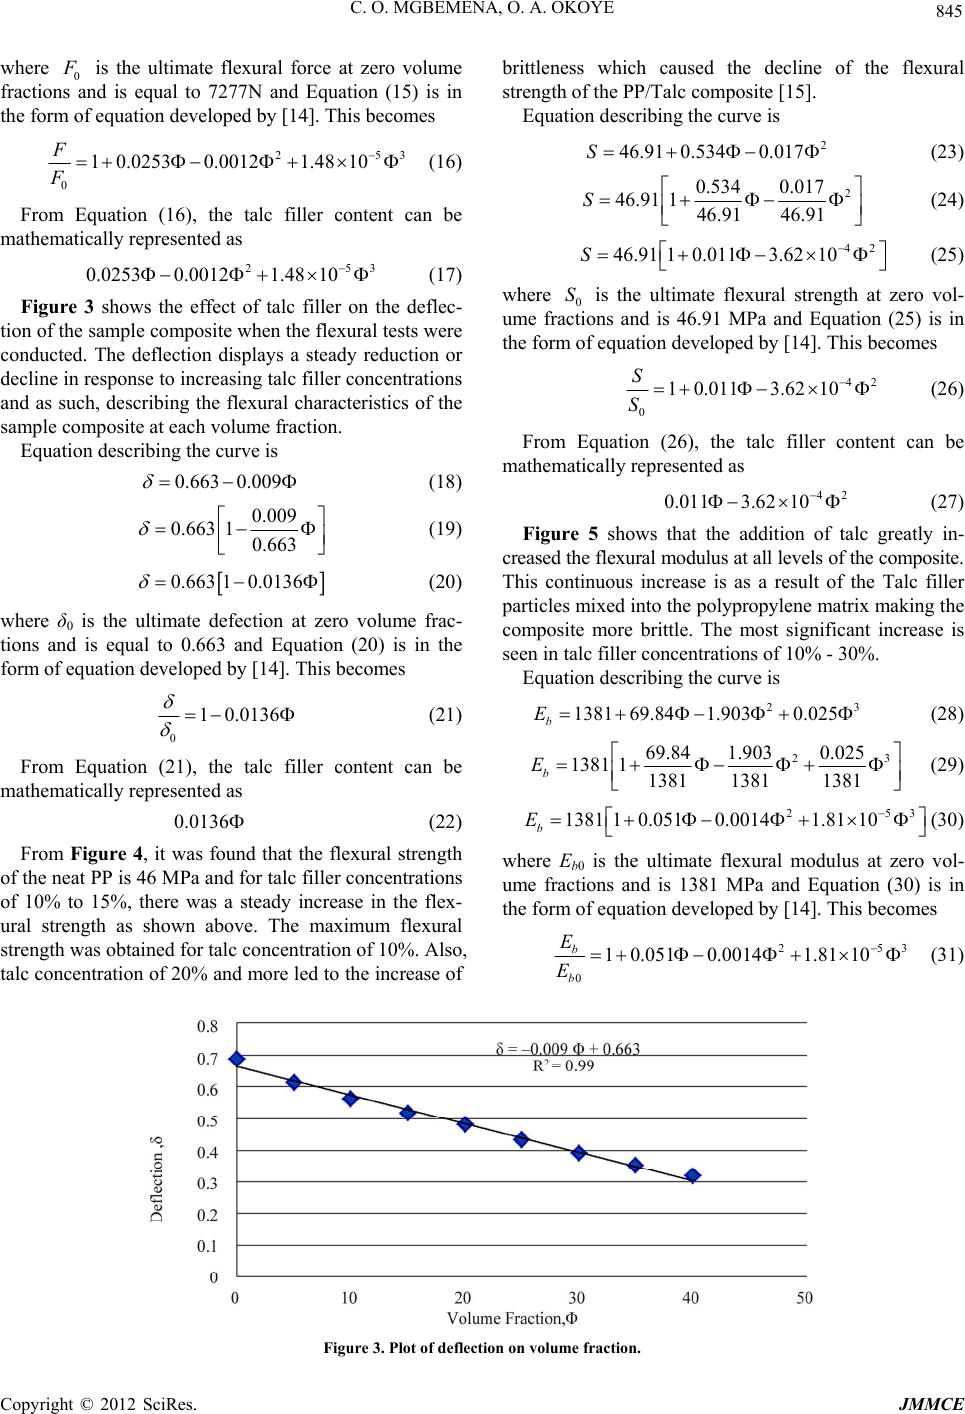 C. O. MGBEMENA, O. A. OKOYE 845 where 0 F is the ultimate flexural force at zero volume fractions and is equal to 7277N and Equation (15) is in the form of equation developed by [14]. This becomes 253 1.48 10 253 1.48 10 0.663 0.009 0 1 0.02530.0012 F F (16) From Equation (16), the talc filler content can be mathematically represented as 0.0253 0.0012 (17) Figure 3 shows the effect of talc filler on the deflec- tion of the sample composite when the flexural tests were conducted. The deflection displays a steady reduction or decline in response to increasing talc filler concentrations and as such, describing the flexural characteristics of the sample composite at each volume fraction. Equation describing the curve is (18) 0.009 10.663 0.663 (19) 0.663 1 0.0136 (20) where δ0 is the ultimate defection at zero volume frac- tions and is equal to 0.663 and Equation (20) is in the form of equation developed by [14]. This becomes 0 1 0.0136 0.0136 2 46.91 0.5340.017S (21) From Equation (21), the talc filler content can be mathematically represented as (22) From Figure 4, it was found that the flexural strength of the neat PP is 46 MPa and for talc filler concentrations of 10% to 15%, there was a steady increase in the flex- ural strength as shown above. The maximum flexural strength was obtained for talc concentration of 10%. Also, talc concentration of 20% and more led to the increase of brittleness which caused the decline of the flexural strength of the PP/Talc composite [15]. Equation describing the curve is (23) 2 0.534 0.017 46.91 146.91 46.91 S 42 46.91 10.0113.6210S (24) (25) S where 0 is the ultimate flexural strength at zero vol- ume fractions and is 46.91 MPa and Equation (25) is in the form of equation developed by [14]. This becomes 42 0 10.0113.62 10 S S 42 0.0113.62 10 (26) From Equation (26), the talc filler content can be mathematically represented as 23 1381 69.841.9030.025 b E (27) Figure 5 shows that the addition of talc greatly in- creased the flexural modulus at all levels of the composite. This continuous increase is as a result of the Talc filler particles mixed into the polypropylene matrix making the composite more brittle. The most significant increase is seen in talc filler concentrations of 10% - 30%. Equation describing the curve is (28) 23 69.84 1.9030.025 1381 11381 13811381 b E 253 1381 10.0510.00141.8110 b E (29) (30) where Εb0 is the ultimate flexural modulus at zero vol- ume fractions and is 1381 MPa and Equation (30) is in the form of equation developed by [14]. This becomes 253 0 10.0510.00141.81 10 b b E E (31) Figure 3. Plot of deflec tion on volume fraction. Copyright © 2012 SciRes. JMMCE 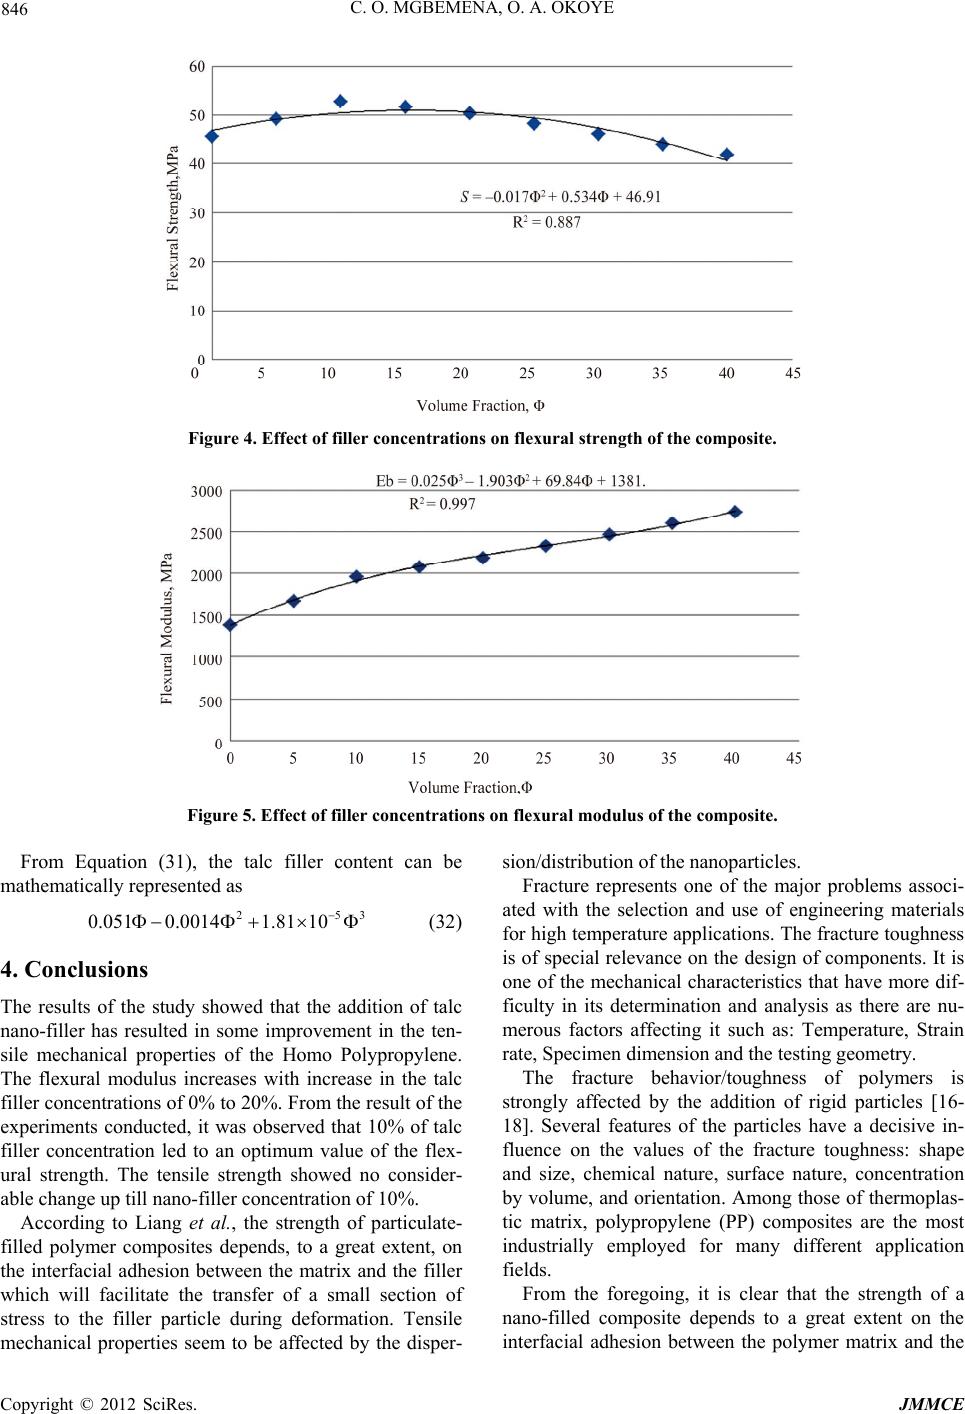 C. O. MGBEMENA, O. A. OKOYE 846 Figure 4. Effect of filler concentrations on flexural strength of the composite. Figure 5. Effect of filler concentrations on flexural modulus of the composite. From Equation (31), the talc filler content can be mathematically represented as 253 1.81 10 0.051 0.0014 (32) 4. Conclusions The results of the study showed that the addition of talc nano-filler has resulted in some improvement in the ten- sile mechanical properties of the Homo Polypropylene. The flexural modulus increases with increase in the talc filler concentrations of 0% to 20%. From the result of the experiments conducted, it was observed that 10% of talc filler concentration led to an optimum value of the flex- ural strength. The tensile strength showed no consider- able change up till nano-filler concentration of 10%. According to Liang et al., the strength of particulate- filled polymer composites depends, to a great extent, on the interfacial adhesion between the matrix and the filler which will facilitate the transfer of a small section of stress to the filler particle during deformation. Tensile mechanical properties seem to be affected by the disper- sion/distribution of the nanoparticles. Fracture represents one of the major problems associ- ated with the selection and use of engineering materials for high temperature applications. The fracture toughness is of special relevance on the design of components. It is one of the mechanical characteristics that have more dif- ficulty in its determination and analysis as there are nu- merous factors affecting it such as: Temperature, Strain rate, Specimen dimension and the testing geometry. The fracture behavior/toughness of polymers is strongly affected by the addition of rigid particles [16- 18]. Several features of the particles have a decisive in- fluence on the values of the fracture toughness: shape and size, chemical nature, surface nature, concentration by volume, and orientation. Among those of thermoplas- tic matrix, polypropylene (PP) composites are the most industrially employed for many different application fields. From the foregoing, it is clear that the strength of a nano-filled composite depends to a great extent on the interfacial adhesion between the polymer matrix and the Copyright © 2012 SciRes. JMMCE 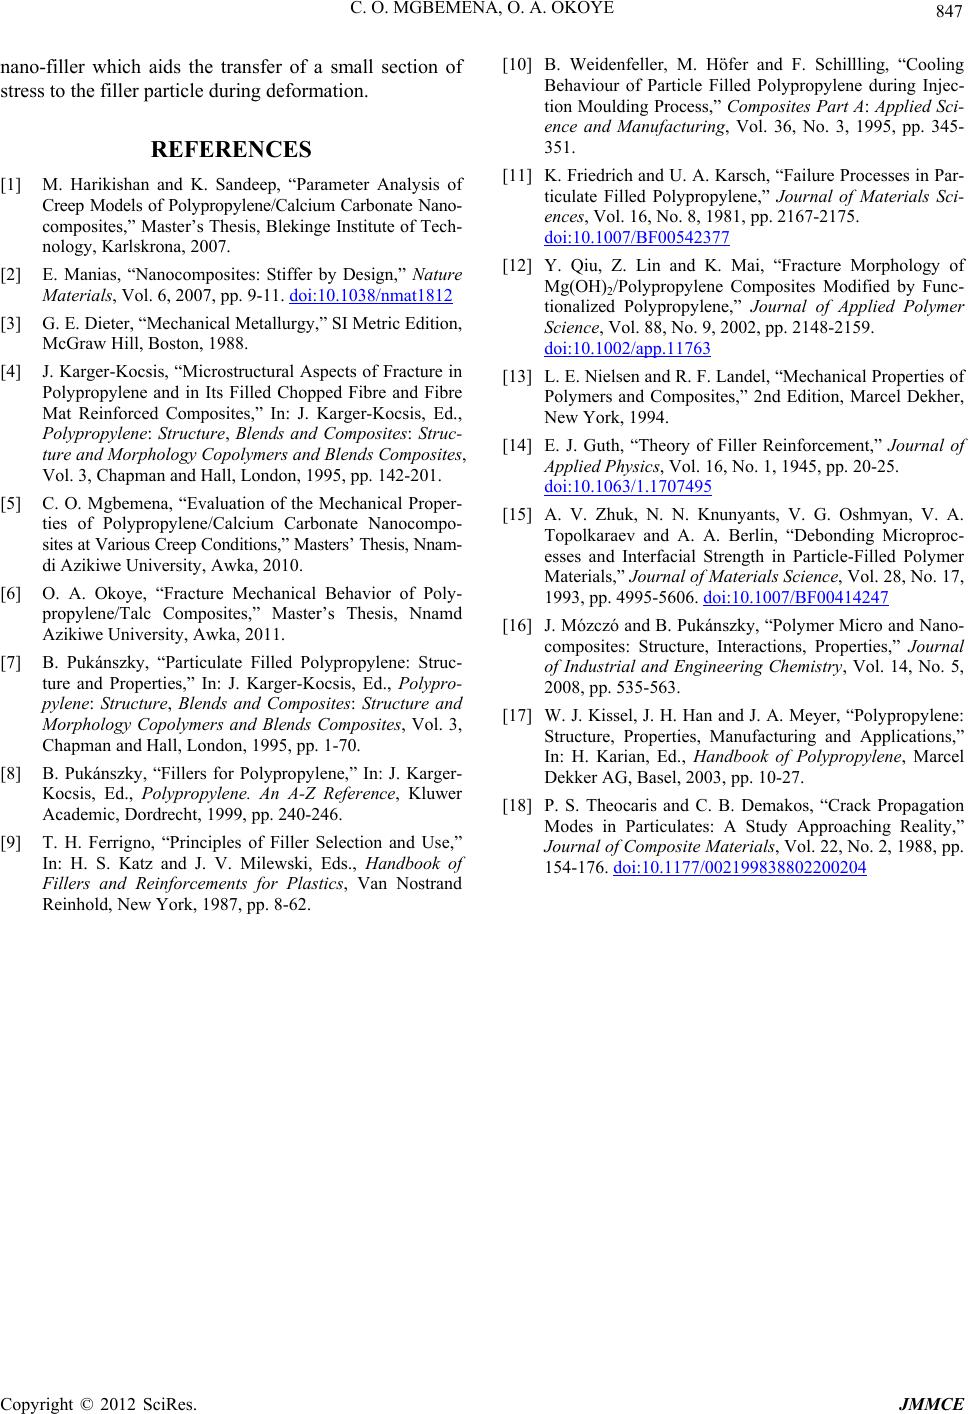 C. O. MGBEMENA, O. A. OKOYE 847 nano-filler which aids the transfer of a small section of stress to the filler particle during deformation. REFERENCES [1] M. Harikishan and K. Sandeep, “Parameter Analysis of Creep Models of Polypropylene/Calcium Carbonate Nano- composites,” Master’s Thesis, Blekinge Institute of Tech- nology, Karlskrona, 2007. [2] E. Manias, “Nanocomposites: Stiffer by Design,” Nature Materials, Vol. 6, 2007, pp. 9-11. doi:10.1038/nmat1812 [3] G. E. Dieter, “Mechanical Metallurgy,” SI Metric Edition, McGraw Hill, Boston, 1988. [4] J. Karger-Kocsis, “Microstructural Aspects of Fracture in Polypropylene and in Its Filled Chopped Fibre and Fibre Mat Reinforced Composites,” In: J. Karger-Kocsis, Ed., Polypropylene: Structure, Blends and Composites: Struc- ture and Morphology Copolymers and Blends Composites, Vol. 3, Chapman and Hall, London, 1995, pp. 142-201. [5] C. O. Mgbemena, “Evaluation of the Mechanical Proper- ties of Polypropylene/Calcium Carbonate Nanocompo- sites at Various Creep Conditions,” Masters’ Thesis, Nnam- di Azikiwe University, Awka, 2010. [6] O. A. Okoye, “Fracture Mechanical Behavior of Poly- propylene/Talc Composites,” Master’s Thesis, Nnamd Azikiwe University, Awka, 2011. [7] B. Pukánszky, “Particulate Filled Polypropylene: Struc- ture and Properties,” In: J. Karger-Kocsis, Ed., Polypro- pylene: Structure, Blends and Composites: Structure and Morphology Copolymers and Blends Composites, Vol. 3, Chapman and Hall, London, 1995, pp. 1-70. [8] B. Pukánszky, “Fillers for Polypropylene,” In: J. Karger- Kocsis, Ed., Polypropylene. An A-Z Reference, Kluwer Academic, Dordrecht, 1999, pp. 240-246. [9] T. H. Ferrigno, “Principles of Filler Selection and Use,” In: H. S. Katz and J. V. Milewski, Eds., Handbook of Fillers and Reinforcements for Plastics, Van Nostrand Reinhold, New York, 1987, pp. 8-62. [10] B. Weidenfeller, M. Höfer and F. Schillling, “Cooling Behaviour of Particle Filled Polypropylene during Injec- tion Moulding Process,” Composites Part A: Applied Sci- ence and Manufacturing, Vol. 36, No. 3, 1995, pp. 345- 351. [11] K. Friedrich and U. A. Karsch, “Failure Processes in Par- ticulate Filled Polypropylene,” Journal of Materials Sci- ences, Vol. 16, No. 8, 1981, pp. 2167-2175. doi:10.1007/BF00542377 [12] Y. Qiu, Z. Lin and K. Mai, “Fracture Morphology of Mg(OH)2/Polypropylene Composites Modified by Func- tionalized Polypropylene,” Journal of Applied Polymer Science, Vol. 88, No. 9, 2002, pp. 2148-2159. doi:10.1002/app.11763 [13] L. E. Nielsen and R. F. Landel, “Mechanical Properties of Polymers and Composites,” 2nd Edition, Marcel Dekher, New York, 1994. [14] E. J. Guth, “Theory of Filler Reinforcement,” Journal of Applied Physics, Vol. 16, No. 1, 1945, pp. 20-25. doi:10.1063/1.1707495 [15] A. V. Zhuk, N. N. Knunyants, V. G. Oshmyan, V. A. Topolkaraev and A. A. Berlin, “Debonding Microproc- esses and Interfacial Strength in Particle-Filled Polymer Materials,” Journal of Materials Science, Vol. 28, No. 17, 1993, pp. 4995-5606. doi:10.1007/BF00414247 [16] J. Mózczó and B. Pukánszky, “Polymer Micro and Nano- composites: Structure, Interactions, Properties,” Journal of Industrial and Engineering Chemistry, Vol. 14, No. 5, 2008, pp. 535-563. [17] W. J. Kissel, J. H. Han and J. A. Meyer, “Polypropylene: Structure, Properties, Manufacturing and Applications,” In: H. Karian, Ed., Handbook of Polypropylene, Marcel Dekker AG, Basel, 2003, pp. 10-27. [18] P. S. Theocaris and C. B. Demakos, “Crack Propagation Modes in Particulates: A Study Approaching Reality,” Journal of Composite Materials, Vol. 22, No. 2, 1988, pp. 154-176. doi:10.1177/002199838802200204 Copyright © 2012 SciRes. JMMCE |