M. Y. Lim et al. / Natural Science 2 (2010) 631-634
Copyright © 2010 SciRes. OPEN ACCESS
632
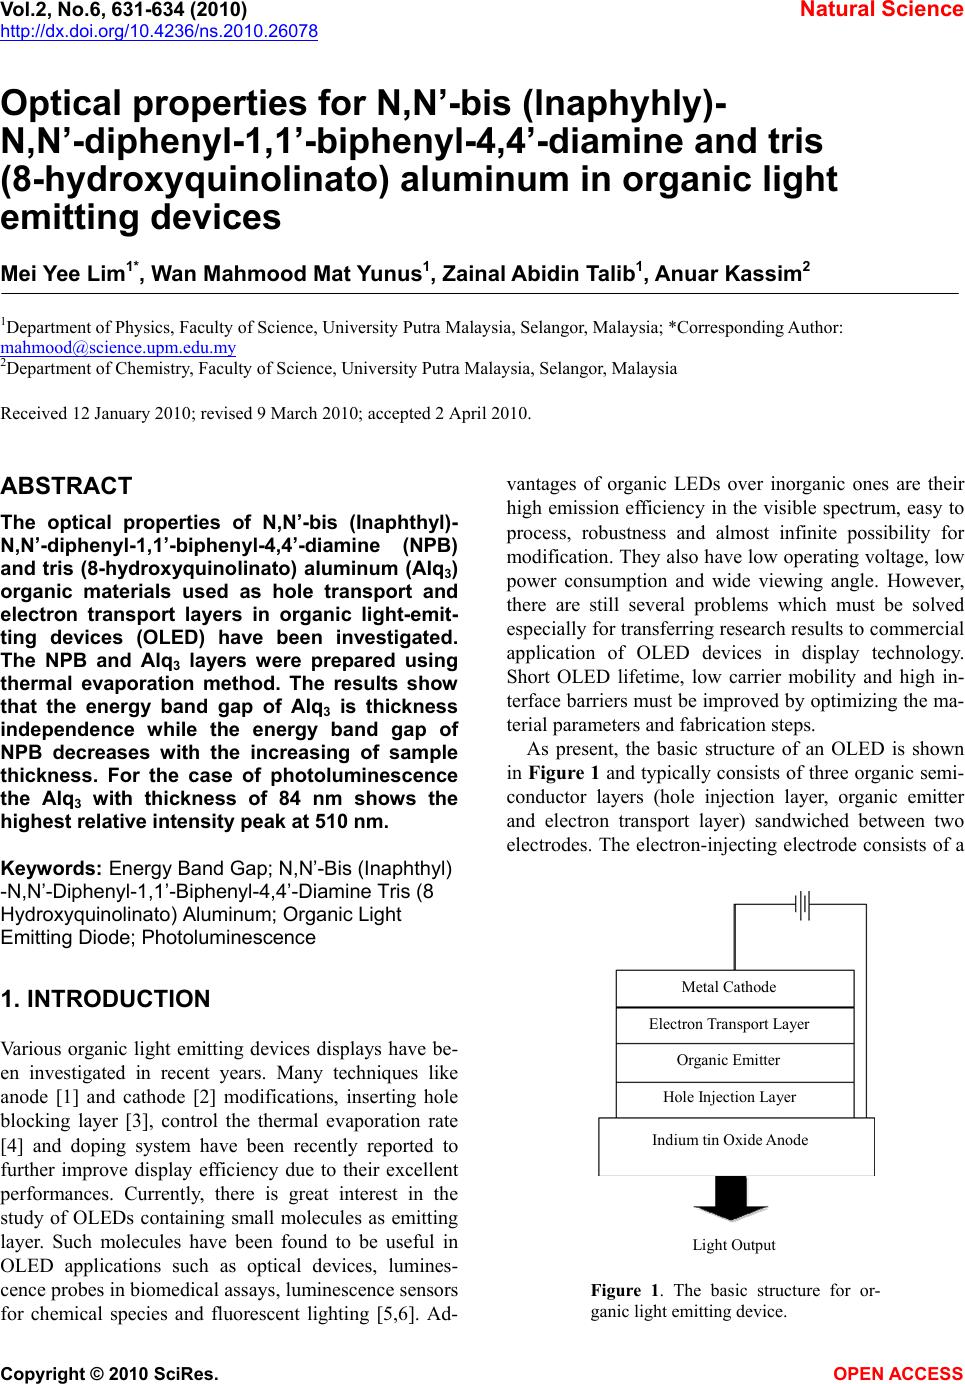
low work function metal alloy, typically Mg-Ag or Li-Al,
deposited by vacuum evaporation. The bottom, hole-
injecting, electrode is typically a thin-film of the trans-
parent semiconductor indium tin oxide (ITO) [7]. Upon
recombination, energy is released as light, which is emi-
tted from the light-transmissive anode and substrate.
N’-bis (Inaphthyl)-N,N’-diphenyl-1,1’-biphenyl-4,4’-di-
amine (NPB) was chosen as hole injection layer because
it can be easily manufactured and is abundantly available
in powder form. However, tris (8-hydroxyquinolinato)
aluminum (Alq3) is used as an ETL because Alq3 is ther-
mally and morphologically stable therefore can be easily
evaporated into thin films form. Easily synthesized and
purified, molecularly shaped to avoid exciplex formation
(e.g. with N,N’-bis (Inaphthyl)-N,N’-diphenyl-1,1’-bi-
phenyl-4,4’-diamine at the interface), and produce green
fluorescent light become another reason to be a good
host emitter [8].
2. EXPERIMENTAL
For the preparation of Alq3 and NPB organic layers, the
indium tin oxide (ITO) glasses substrate was cut into
square plates (2 cm × 2 cm). The ITO glasses were im-
mersed in ultrasonic baths with acetone for 10 minutes.
Then, the ITO glasses were rinsing in deionised water
for 10 min and then blow dried with nitrogen gas. This
procedure was applied to remove organic contamination
and particles from the ITO surface. Thermal evaporation
technique using resistively heated tantalum boats in
vacuum, at a base pressure of 1.0 × 10⁻⁵ Torr was used to
prepare thin film sample. Different thickness of organic
layers was deposited on the ITO at a rate of 2.5 A/s at
room temperature. The thicknesses of the layers were
measured by Tencor P-12 Disk Profile. The PL spectra
of the devices were measured by a EL spectra USB 2000
FLG Spectrofluorometer. The spectra of optical absorp-
tion measurements were made over the wavelength
range of 360 nm-800 nm to obtain the energy band gap.
3. RESULTS AND DISCUSSION
3.1. Energy Band Gap
The spectra of optical absorption measurements were
made over the wavelength range of 360 nm-800 nm. The
variation in the absorbance with wavelength is shown in
Figures 2 and 3 for Alq3 and NPB with varying thick-
ness.
The optical absorption spectra of both samples, Alq3
and NPB are similar thus the optical band gap was cal-
culated using a well known equation as
g
Ehch
2
)( (1)
400 500 600 700 800
-0.1
0.0
0.1
0.2
0.3
0.4
Absorbance, Abs
Wavelength, nm
ITO
16 nm
33 nm
50 nm
67 nm
84 nm
101 nm
118 nm
134 nm
Figure 2. The optical absorption of Alq3 at various thickness.
400 500 600700 800
0.0
0.5
1.0
1.5
2.0
2.5
Absorbance, Abs
Wavelength, nm
28 nm
55 nm
83 nm
110 nm
138 nm
165 nm
193 nm
Figure 3. The optical absorption of NPB measured at different
thicknesses.
where c is a constant, Eg is the optical band gap, hv is
photon energy. The energy band gap was obtained by
plotting (αhv) 2 as a function of photon energy,
h.
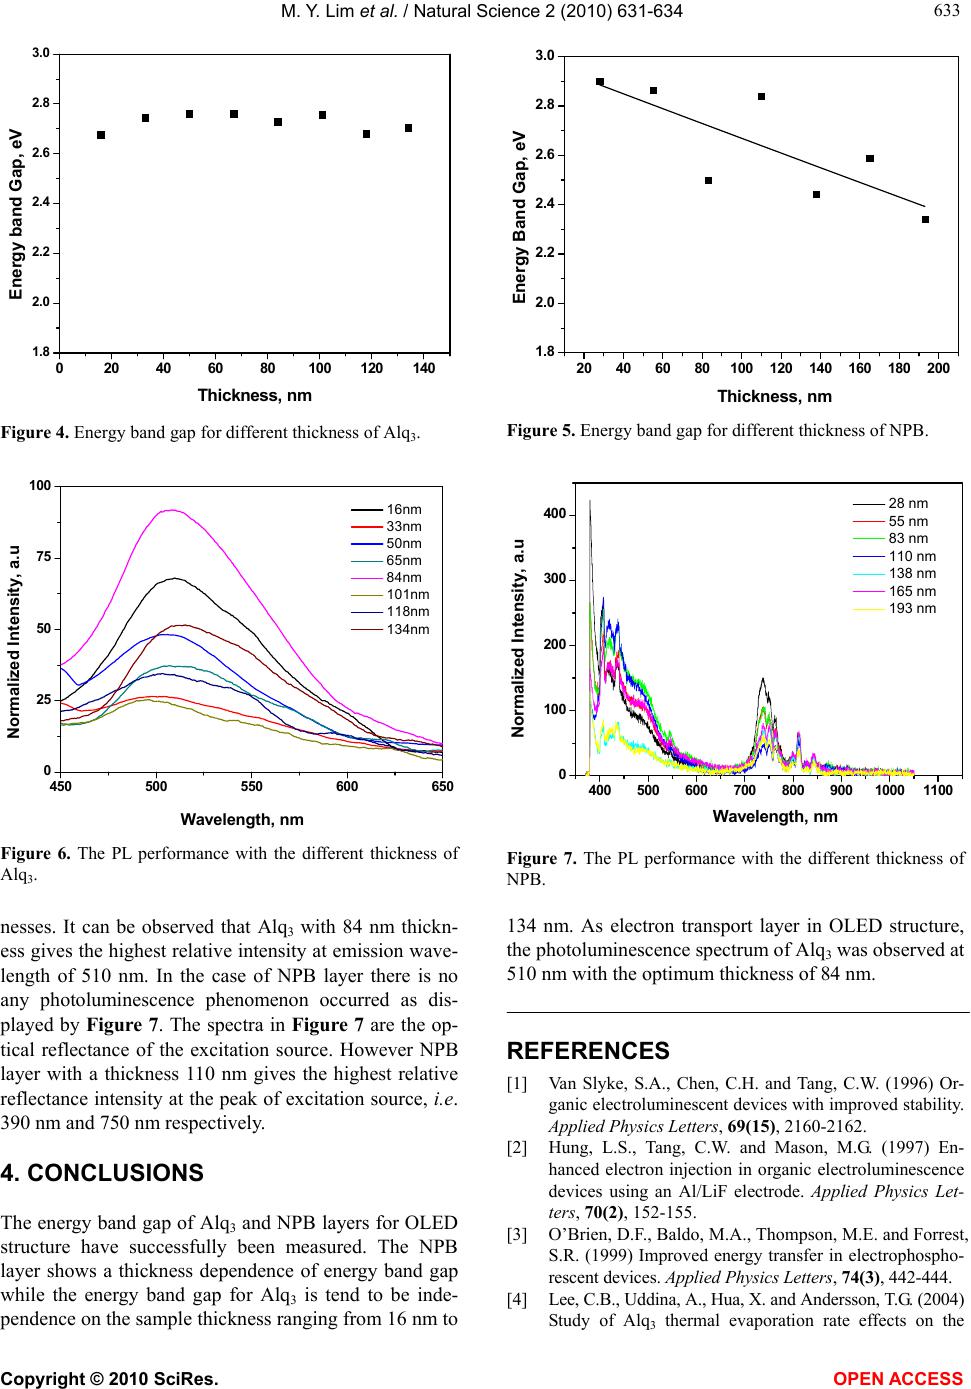
The result shows that the energy band gap for the Alq3,
is tend to be independent on the layer thickness as shown
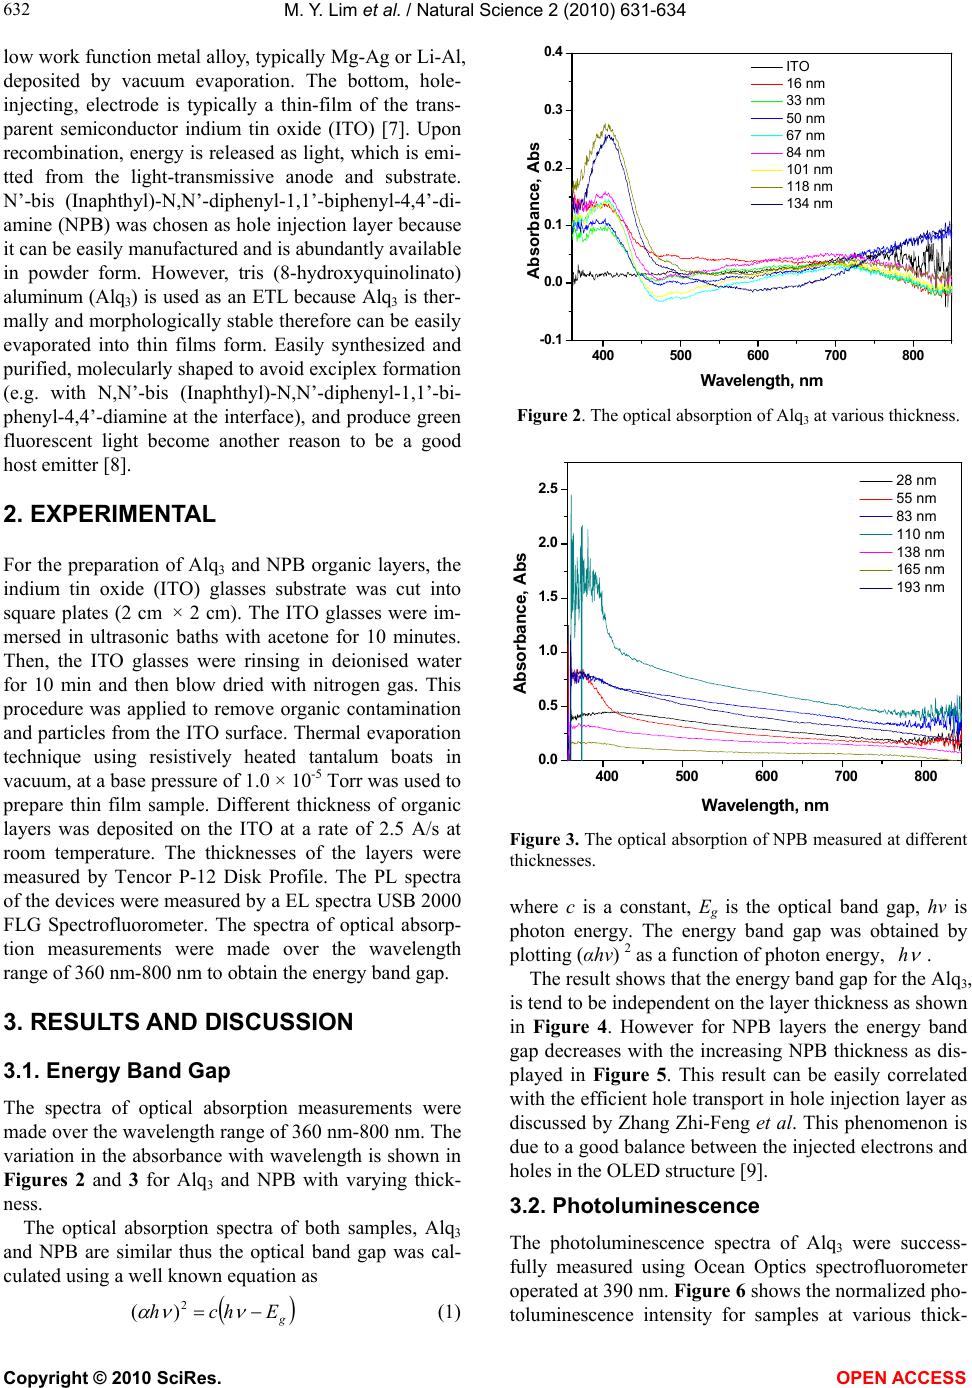
in Figure 4. However for NPB layers the energy band
gap decreases with the increasing NPB thickness as dis-
played in Figure 5. This result can be easily correlated
with the efficient hole transport in hole injection layer as
discussed by Zhang Zhi-Feng et al. This phenomenon is
due to a good balance between the injected electrons and
holes in the OLED structure [9].
3.2. Photoluminescence
The photoluminescence spectra of Alq3 were success-
fully measured using Ocean Optics spectrofluorometer
operated at 390 nm. Figure 6 shows the normalized pho-
toluminescence intensity for samples at various thick-