

Paper Menu >>
Journal Menu >>
 Open Journal of Synthesis Theory and Applications, 2012, 1, 18-22 http://dx.doi.org/10.4236/ojsta.2012.12004 Published Online July 2012 (http://www.SciRP.org/journal/ojsta) Preparation and Characterization of Silver Doped ZnO Nanostructures Nguyen Van Nghia*, Tran Nam Trung, Nguyen Ngoc Khoa Truong, Doan Minh Thuy Department of Physics, Quy Nhon University, Quy Nhon, Vietnam Email: *[email protected] Received April 25, 2012; revised June 7, 2012; accepted July 3, 2012 ABSTRACT ZnO was prepared by hydrothermal method. The result of scanning electron microscopy showed that the materials had nano rod structures. Ag-doped ZnO was prepared by UV-photoreduction. Crystalline phases and optical absorption of the prepared Ag-doped ZnO samples were determined by X-ray diffraction, Raman spectrum, UV-visible, and UV- photoreduction spectrophotometer. X-ray analyses revealed that Ag was doped ZnO crystallizes in hexagonal wurtzite structure. The incorporation of Ag+ in the site of Zn2+ provoked an increase in the size of nanocrystals as compared to pure ZnO. The photocatalytic and photoluminescence properties of materials were considered. Keywords: Nanostructures; Photocatalysis; Hydrothermal; ZnO; Silver Doping 1. Introduction Nanostructured ZnO materials have received consider- able interest from scientists due to their remarkable per- formance in electronics, optics and photonics. ZnO is a wide band gap (3.37 eV at room temperature) compound semiconductor that is appropriate for short wavelength optoelectronics applications. The large exciton binding en- ergy (60 meV) in ZnO crystal allows efficient excitonic emission at room temperature. Therefore, ZnO nanos- tructures have had a wide range of high technology ap- plications like surface acoustic wave filters, photonic crystals, gas sensors, photocatalysis [1-3]. Because of having a wide bandgap, ZnO can only be activated by ultraviolet light of wavelength below 385 nm. The ultra- violet light reaching the earth’s surface is less than 5% of the solar energy, which is too low to attain significant photodegradation in commercial application. Some in- teresting approaches have been adopted to extend the photoresponse of ZnO toward the visible spectral region, such as implanting transitional metal ions [4,5]. Metal silver is also a significant visible light photosen- sitizer, which is stable and nontoxic. Ag is also relatively cheap; thus Ag modification is of great significance for industrial practice. The improvement in efficiency of photocatalytic reactions under visible light is explained as the result of a vectorial transfer of photogenerated elec- trons and holes from metal to semiconductor. Moreover, ZnO modified by Ag can improve the distribution of surface charges, accept a conduction band generated by solar light irradiation during photoreaction, prevent the recombination of the photogenerated electron-hole. Many researchers reported that ZnO thin film with Ag doping, which enhances ultraviolet emission and improves elec- trical and optical properties, was prepared by wet chemi- cal [6], DC magnetron sputtering [7] and pulsed laser deposition [8]. In this work, silver nanoparticles were deposited on the surface of ZnO nanorods (prepared by hydrothermal method) by using a photochemical reduction under UV irradiation. We also have compared the photocatalytic properties of Ag-doped ZnO and ZnO nanorods (ZnO- NRs). 2. Experimental 2.1. ZnO -NRs Preparation 4,6 g of zinc acetate (Zn(OAc)2 powders were dissolved in 40 ml a solvent etanol under stirring for 1 h (called M1 solution). The M2 solution was prepared by adding 2,5 g oxalic acid (H2C2O4) into 40 ml etanol under stirring. M2 was slowly poured in the M1 solution under ultrasonic wave (35 kHz, 100 W) for 30 minutes. The sonicated solution was then moved to a teflon vessel and put in a stainless steel autoclave for carrying out the hydrother- mal treatment at 140˚C for 20 hours. The stainless steel was then opened at room temperature and the precipitates were separated and washed repeatedly by deionized wa- ter until the pH value of the washing solution became lower than 7. The final as-prepared product was dried under vacuum at temperature of 80˚C for 12 hours. Then *Corresponding author. C opyright © 2012 SciRes. OJSTA 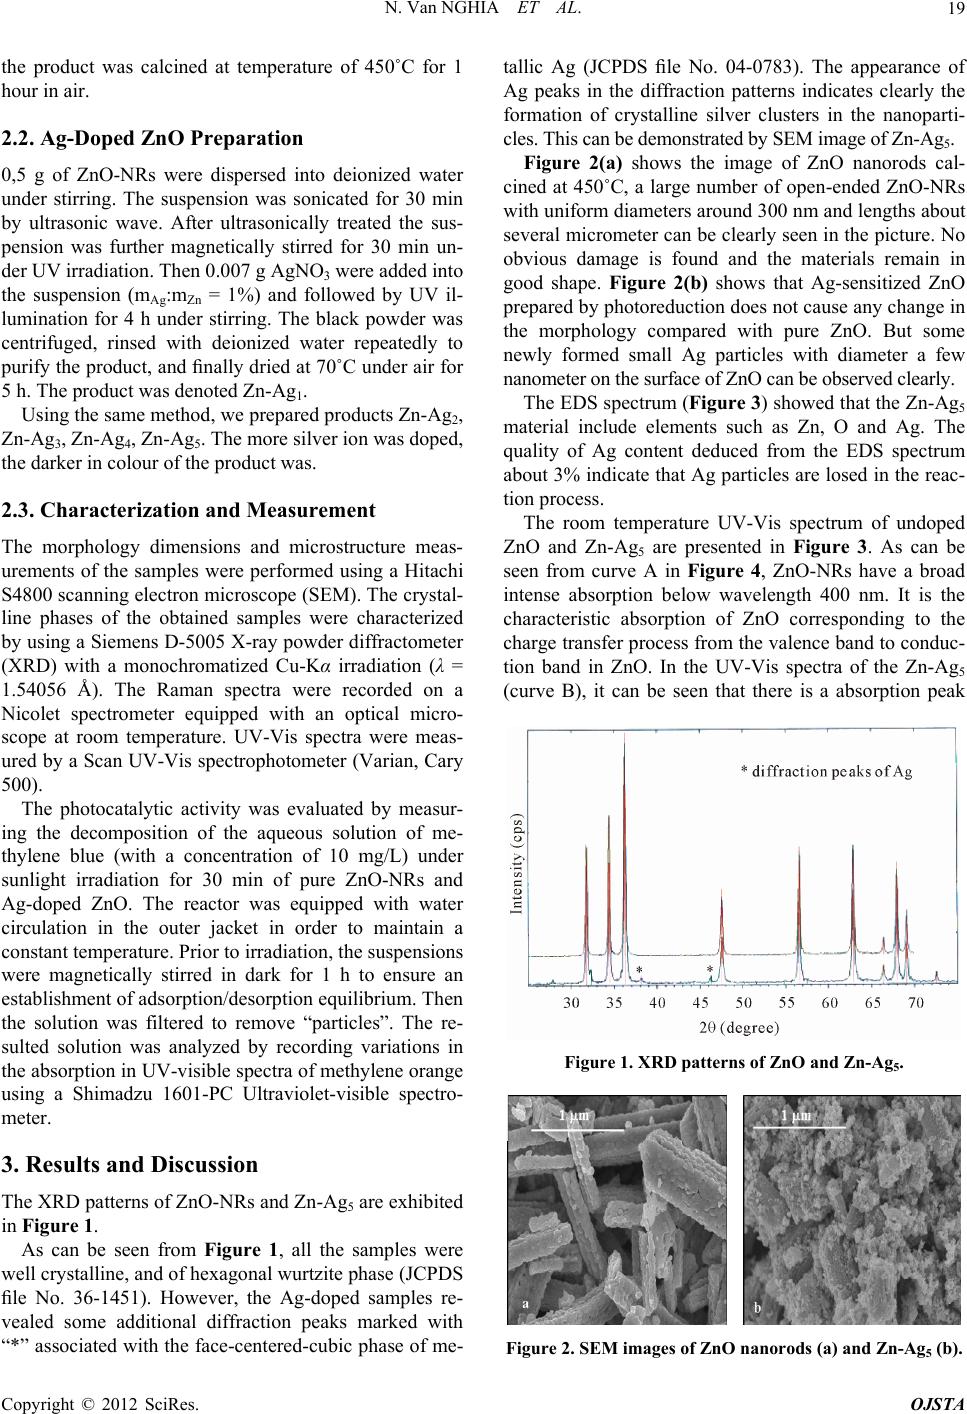 N. Van NGHIA ET AL. 19 the product was calcined at temperature of 450˚C for 1 hour in air. 2.2. Ag-Doped ZnO Preparation 0,5 g of ZnO-NRs were dispersed into deionized water under stirring. The suspension was sonicated for 30 min by ultrasonic wave. After ultrasonically treated the sus- pension was further magnetically stirred for 30 min un- der UV irradiation. Then 0.007 g AgNO3 were added into the suspension (mAg:mZn = 1%) and followed by UV il- lumination for 4 h under stirring. The black powder was centrifuged, rinsed with deionized water repeatedly to purify the product, and finally dried at 70˚C under air for 5 h. The product was denoted Zn-Ag1. Using the same method, we prepared products Zn-Ag2, Zn-Ag3, Zn-Ag4, Zn-Ag5. The more silver ion was doped, the darker in colour of the product was. 2.3. Characterization and Measurement The morphology dimensions and microstructure meas- urements of the samples were performed using a Hitachi S4800 scanning electron microscope (SEM). The crystal- line phases of the obtained samples were characterized by using a Siemens D-5005 X-ray powder diffractometer (XRD) with a monochromatized Cu-Kα irradiation (λ = 1.54056 Å). The Raman spectra were recorded on a Nicolet spectrometer equipped with an optical micro- scope at room temperature. UV-Vis spectra were meas- ured by a Scan UV-Vis spectrophotometer (Varian, Cary 500). The photocatalytic activity was evaluated by measur- ing the decomposition of the aqueous solution of me- thylene blue (with a concentration of 10 mg/L) under sunlight irradiation for 30 min of pure ZnO-NRs and Ag-doped ZnO. The reactor was equipped with water circulation in the outer jacket in order to maintain a constant temperature. Prior to irradiation, the suspensions were magnetically stirred in dark for 1 h to ensure an establishment of adsorption/desorption equilibrium. Then the solution was filtered to remove “particles”. The re- sulted solution was analyzed by recording variations in the absorption in UV-visible spectra of methylene orange using a Shimadzu 1601-PC Ultraviolet-visible spectro- meter. 3. Results and Discussion The XRD patterns of ZnO-NRs and Zn-Ag5 are exhibited in Figure 1. As can be seen from Figure 1, all the samples were well crystalline, and of hexagonal wurtzite phase (JCPDS file No. 36-1451). However, the Ag-doped samples re- vealed some additional diffraction peaks marked with “*” associated with the face-centered-cubic phase of me- tallic Ag (JCPDS file No. 04-0783). The appearance of Ag peaks in the diffraction patterns indicates clearly the formation of crystalline silver clusters in the nanoparti- cles. This can be demonstrated by SEM image of Zn-Ag5. Figure 2(a) shows the image of ZnO nanorods cal- cined at 450˚C, a large number of open-ended ZnO-NRs with uniform diameters around 300 nm and lengths about several micrometer can be clearly seen in the picture. No obvious damage is found and the materials remain in good shape. Figure 2(b) shows that Ag-sensitized ZnO prepared by photoreduction does not cause any change in the morphology compared with pure ZnO. But some newly formed small Ag particles with diameter a few nanometer on the surface of ZnO can be observed clearly. The EDS spectrum (Figure 3) showed that the Zn-Ag5 material include elements such as Zn, O and Ag. The quality of Ag content deduced from the EDS spectrum about 3% indicate that Ag particles are losed in the reac- tion process. The room temperature UV-Vis spectrum of undoped ZnO and Zn-Ag5 are presented in Figure 3. As can be seen from curve A in Figure 4, ZnO-NRs have a broad intense absorption below wavelength 400 nm. It is the characteristic absorption of ZnO corresponding to the charge transfer process from the valence band to conduc- tion band in ZnO. In the UV-Vis spectra of the Zn-Ag5 (curve B), it can be seen that there is a absorption peak Figure 1. XRD patterns of ZnO and Zn-Ag5. Figure 2. SEM images of ZnO nanorods (a) and Zn-Ag5 (b). Copyright © 2012 SciRes. OJSTA 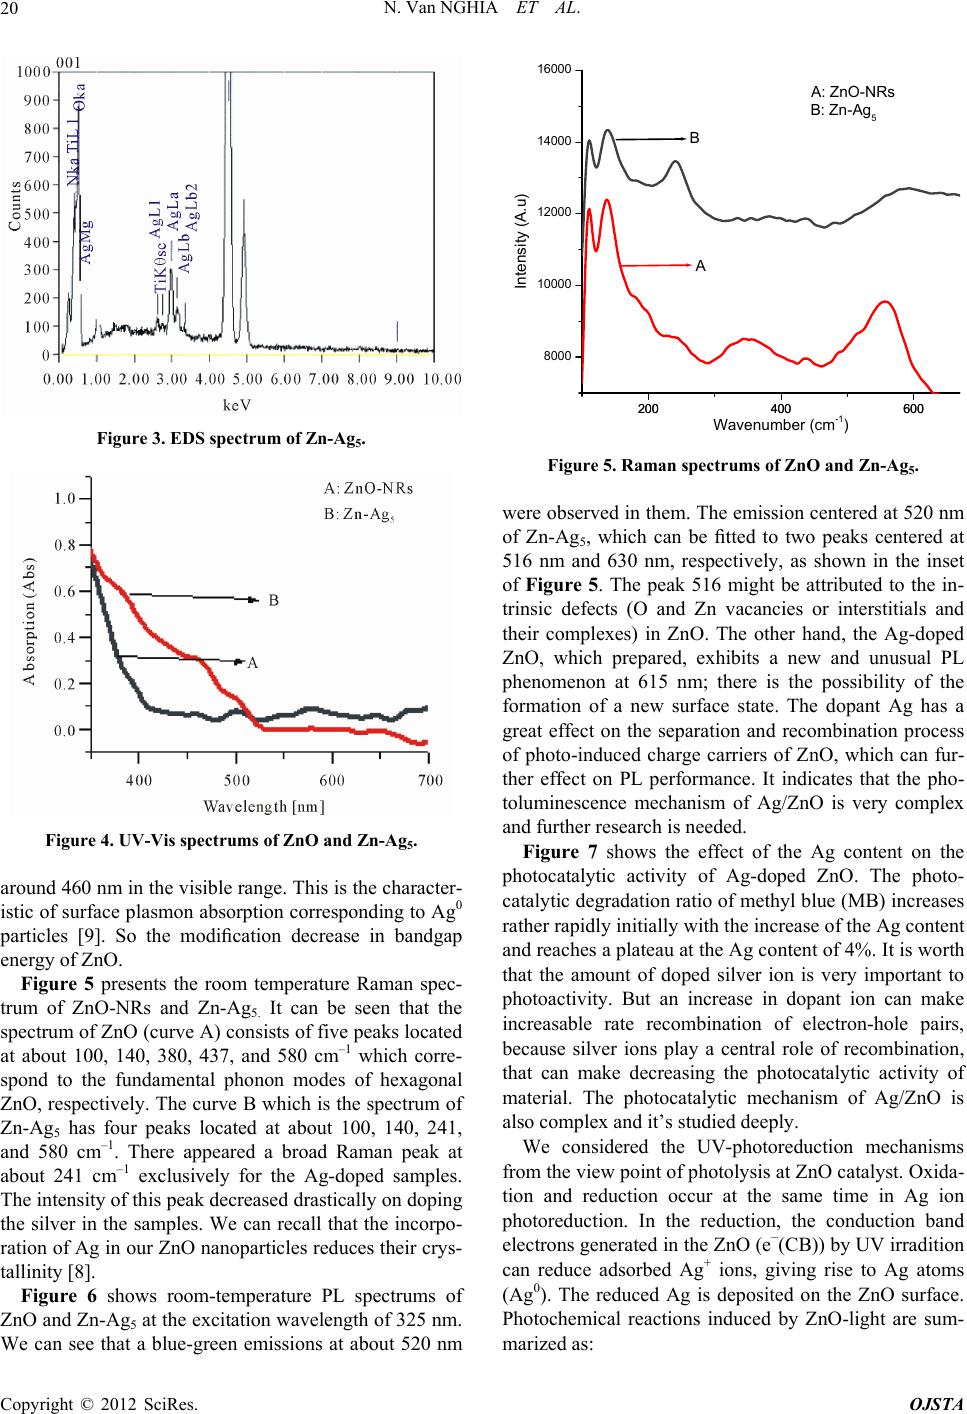 N. Van NGHIA ET AL. 20 Figure 3. EDS spectrum of Zn-Ag5. Figure 4. UV-Vis spectrums of ZnO and Zn-Ag5. around 460 nm in the visible range. This is the character- istic of surface plasmon absorption corresponding to Ag0 particles [9]. So the modification decrease in bandgap energy of ZnO. Figure 5 presents the room temperature Raman spec- trum of ZnO-NRs and Zn-Ag5. It can be seen that the spectrum of ZnO (curve A) consists of five peaks located at about 100, 140, 380, 437, and 580 cm–1 which corre- spond to the fundamental phonon modes of hexagonal ZnO, respectively. The curve B which is the spectrum of Zn-Ag5 has four peaks located at about 100, 140, 241, and 580 cm–1. There appeared a broad Raman peak at about 241 cm–1 exclusively for the Ag-doped samples. The intensity of this peak decreased drastically on doping the silver in the samples. We can recall that the incorpo- ration of Ag in our ZnO nanoparticles reduces their crys- tallinity [8]. Figure 6 shows room-temperature PL spectrums of ZnO and Zn-Ag5 at the excitation wavelength of 325 nm. We can see that a blue-green emissions at about 520 nm 200 400 600 8000 10000 12000 14000 16000 200 400 600 B A Intensity (A.u) B: Zn-Ag5 A: ZnO-NRs Wavenumber (cm-1) Figure 5. Raman spectrums of ZnO and Zn-Ag5. were observed in them. The emission centered at 520 nm of Zn-Ag5, which can be fitted to two peaks centered at 516 nm and 630 nm, respectively, as shown in the inset of Figure 5. The peak 516 might be attributed to the in- trinsic defects (O and Zn vacancies or interstitials and their complexes) in ZnO. The other hand, the Ag-doped ZnO, which prepared, exhibits a new and unusual PL phenomenon at 615 nm; there is the possibility of the formation of a new surface state. The dopant Ag has a great effect on the separation and recombination process of photo-induced charge carriers of ZnO, which can fur- ther effect on PL performance. It indicates that the pho- toluminescence mechanism of Ag/ZnO is very complex and further research is needed. Figure 7 shows the effect of the Ag content on the photocatalytic activity of Ag-doped ZnO. The photo- catalytic degradation ratio of methyl blue (MB) increases rather rapidly initially with the increase of the Ag content and reaches a plateau at the Ag content of 4%. It is worth that the amount of doped silver ion is very important to photoactivity. But an increase in dopant ion can make increasable rate recombination of electron-hole pairs, because silver ions play a central role of recombination, that can make decreasing the photocatalytic activity of material. The photocatalytic mechanism of Ag/ZnO is also complex and it’s studied deeply. We considered the UV-photoreduction mechanisms from the view point of photolysis at ZnO catalyst. Oxida- tion and reduction occur at the same time in Ag ion photoreduction. In the reduction, the conduction band electrons generated in the ZnO (e−(CB)) by UV irradition can reduce adsorbed Ag+ ions, giving rise to Ag atoms (Ag0). The reduced Ag is deposited on the ZnO surface. Photochemical reactions induced by ZnO-light are sum- maized as: r Copyright © 2012 SciRes. OJSTA  N. Van NGHIA ET AL. Copyright © 2012 SciRes. OJSTA 21 400 500 600 700800 900400 500 600 700800 900 0 1000 2000 3000 4000 5000 6000 Zn-Ag5 ZnO Intensity (A.u) Wavelength (nm) 500600 700 800 9001000 0 1000 2000 3000 4000 5000 Fit Curve Intensity (au) Wavelength (nm) Figure 6. Room-temperature PL spectrum of Zn-Ag5. In the inset, the curves “…”show Gaussian curve fitting. 012345 20 40 60 80 100 The degradation of MB (%) The ratio Ag-Doped (%) Figure 7. The degradation of MB on the Ag-doped ZnO. ZnO + h → e–(CB) + h+(VB) (1) Ag+ + e–(CB) → Ag0 (2) 2H2O + h+(VB) → O2 + 4H+ (3) 4. Conclusion Nanorod ZnO was successfully synthesized by a simple hydrothermal method. Ag-doped ZnO composites were prepared by method of UV-photoreduction with as-syn- thesized ZnO-NRs. Photocatalytic reactions show that doping Ag into ZnO hole remarkably improves the pho- tocatalytic activity of ZnO under simulated solar light. The PL spectrum result shows that Ag-sensitized ZnO composite not only has the emission intensities at about 318 nm and 520 nm, but also exhibits a new and unusual PL phenomenon at 615 nm, indicating that the dopant Ag has great effects on separation and recombination proc- esses of photo-induced charge carriers of ZnO. REFERENCES [1] N. W. Emanetoglu, C. Gorla, Y. Liu, S. Liang and Y. Lu, “Epitaxial ZnO Piezoelectric Thin Films for Saw Filters,” Materials Science in Semiconductor Processing, Vol. 2, No. 3, 1999, pp. 247-252. doi:10.1016/S1369-8001(99)00022-0 [2] Y. Chen, D. Bagnall and T. Yao, “ZnO as a Novel  N. Van NGHIA ET AL. 22 Photonic Material for the UV Region,” Materials Science and Engineering: B, Vol. 75, No. 2-3, 2000, pp. 190-198. doi:10.1016/S0921-5107(00)00372-X [3] P. Mitra, A. P. Chatterjee and H. S. Maiti, “ZnO Thin Film Sensor,” Materials Letters, Vol. 35, No. 1-2, 1998, pp. 33-38. doi:10.1016/S0167-577X(97)00215-2 [4] G. Skanadan, Y. J. Chen, N. Glumac and B. H. Kear, “Synthesis of Oxide Nanoparticles in Low Pressure Flames,” Nanostructured Materials, Vol. 11, No. 2, 1999, pp. 149-153. doi:10.1016/S0965-9773(99)00028-8 [5] T. Shinagawa, M. Izaki, H. Inui, K. Murase and Y. Awa- kura, “Characterization of Transparent Ferromagnetic Fe: ZnO Semiconductor Films Chemically Prepared from Aqueous Solutions,” Journal of The Electrochemical So- ciety, Vol. 152, No. 10, 2005, pp. 736-741. doi:10.1149/1.2001247 [6] R. Chen, C. Zou, J. Bian, A. Sandhu and W. Gao, “Mi- crostructure and Optical Properties Ag-Doped ZnO Nano- structures Prepare by a Wet Oxidation Doping Process,” Nanotechnology, Vol. 22, No. 10, 2011, p. 1 [7] S. H. Jeong, B. N. Park, S. B. Lee and J.-H. Boo, “Struc- tural and Optical Properties of Silver-Doped Zinc Oxide Sputtered Films,” Surface & Coatings Technology, Vol. 193, No. 1-3, 2005, pp. 340-344. doi:10.1016/j.surfcoat.2004.08.112 [8] B. D. Ahn, H. S. Kang, J. H. Kim, G. H. Kim, H. W. Chang and S. Y. Lee, “Synthesis and Analysis of Ag- Doped ZnO,” Journal of Applied Physics, Vol. 100, 2006, Article ID: 093701. doi:10.1063/1.2364041 [9] K. Patel, S. Kapoor, D. P. Dave and T. Mukherjee, “Syn- thesis of Nanosized Silver Colloids by Microwave Di- electric Heating,” Journal of Chemical Sciences, Vol. 117, No. 1, 2005, pp. 53-60. Copyright © 2012 SciRes. OJSTA |