

Paper Menu >>
Journal Menu >>
 Open Journal of Organic Polymer Materials, 2012, 2, 45-52 http://dx.doi.org/10.4236/ojopm.2012.23007 Published Online July 2012 (http://www.SciRP.org/journal/ojopm) Stimulation of Selected Cellulases from Trichoderma reesei with White Linearly Polarized Light Ewelina Nowak1, Gohar Khachatryan1, Agnieszka Polit2, Lidia Krzeminska-Fiedorowicz1, Marta Dziedzicka-Wasylewska2, Maciej Fiedorowicz1* 1Department of Chemistry and Physics, University of Agriculture, Krakow, Poland 2Faculty of Biochemistry, Biophysics and Biotechnology, Jagiellonian University, Krakow, Poland Email: *[email protected] Received April 17, 2012; revised May 23, 2012; accepted June 4, 2012 ABSTRACT The impact of the illumination with white linearly polarized light (WLPL) of two commercially available cellulases from Trichoderma reesei on their activity in hydrolysis of microcrystalline cellulose was studied. Enzymes were illu- minated with WLPL for 60 min and 120 min and for each native and illuminated enzyme sample specific activity and kinetics of enzyme catalyzed hydrolysis of microcrystalline cellulose were established. Molecular weight Mw and radii if gyration Rg of protein chains of native and illuminated enzymes were measured by means of high pressure size exclu- sion chromatography coupled with multiangle laser light scattering and refractometric detectors (HPSEC-MALLS-RI). Conformations of protein chains of native and illuminated enzymes were evaluated on the basis of their circular dichro- ism (CD) spectra. Additionally, molecular weight Mw and radii of gyration Rg of polysaccharide chains of microcrystal- line cellulose native and digested for 10 min, 480 min and 1440 min with original and WLPL stimulated enzymes WT and TR were taken. Illumination with WLPL of both cellulases studied did not change secondary structures of protein molecules of native enzyme. Molecular weight Mw and radii of gyration Rg of illuminated enzymes differed greatly from those found for native enzymes. Illumination of enzymes led to increase of specific activity and rate constants of reaction of hydrolysis microcrystalline cellulose catalyzed by illuminated enzymes as compared with native enzymes. Keywords: Cellulases; Polarized Light; Microcrystalline Cellulose 1. Introduction Cellulose is the most abundant and renewable resource of the biosphere. Degradation of cellulose, particularly that enzymatic, to soluble sugars for fuels and industrially essential chemicals has been expected to solve problems of the energy shortage and, at the same time, environ- ment protection. Thus far, combustion of wood is a prin- cipal way of the cellulose utilization. Low specific activity and high cost of polysaccharide hydrolyzing enzymes [1-3] are the main limiting factors in industrial hydrolysis of biomass containing cellulose. Therefore, attempting to introduce efficient enzymes is well rationalized. Hydrolysis of crystalline cellulose is the rate-limiting step in the biomass conversion to etha- nol because aqueous enzyme solutions cannot access the contact with active centers of this insoluble, highly or- dered structure. In the rate-limiting step disruption of a single substrate chain from its native matrix takes place instead of catalytic cleavage of the hydrolysis of the ma- terial, thereby rendering it accessible to the catalytically active cellulase site. Understanding cellulase structure function relationships [4] is one of the key problems of successful implementation of novel enzymes. Similarly, understanding of microcrystalline cellulose molecular structure and interactions between polysaccharide chain with enzyme proteins will allow tailoring enzymes of improved hydrolytic properties. In the last 20 years, white linearly polarized light (WLPL) has found many applications in medicine. Medical cases being treated with polarized light include severe second degree burns [5,6], wound healing [7], leg ulcers, psoriasis and egzema [8,9]. The biostimulating action of low-energy laser light, which is widely used in medicine, could be attributed to the polarization of the laser light [10]. Recently a stimulating influence of white linearly polarized light (WLPL) on enzymes belonging to hydrolyases family i.e. α-amylase in starch α-amylolysis [11], xylanase in degradation of xylan [12], chitinase and chitosanase in degradation of chitin and chitosan [13] was reported. It was shown that WLPL action also stimulates catalytic activity of cyclodextrin glucosyl- transferase [14] and glucose oxidase [15] belonging to *Corresponding author. C opyright © 2012 SciRes. OJOPM E. NOWAK ET AL. 46 cyclase and oxidase families respectively. The mecha- nisms of the enzyme activity enhancement with WLPL is unknown. It has been demonstrated [11] that 1 hr illumi- nation with WLPL of α-amylase solutions led to statisti- cally significant changes in the protein conformation of illuminated enzyme, accompanied by acceleration of the potato starch hydrolysis catalyzed by the activated en- zyme. Such results indicate that the enhancement of the activity of WLPL stimulated enzymes could be related to conformational changes of the protein molecules. In this study this problem is approached by examina- tion of the effect of illumination with WLPL of two commercially available cellulases, isolated from different microorganisms. This effect is checked involving kinet- ics of the hydrolysis of microcrystalline cellulose cata- lysed with so stimulated enzymes. Absolute molecular weight and conformation of protein chains of native and illuminated enzymes was also compared. Additionally, changes of molecular weight of cellulose chains in the course of enzymatic degradation were recorded, to check the enzyme source and/or WLPL stimulation have any impact upon the molecular structure of enzymatically degraded polysaccharide chains. 2. Experimental 2.1. Materials Cellulase (TR) isolated from Trichoderma reesei (EC 3.2.1.4) in aqueous solution (TR) and as a solid powder (WT) was purchased from Sigma (Poznań, Poland) and Worthington Biochemical Corporation (Lakewood NJ, USA), respectively. Microcrystalline cellulose and N,N-dimethylacetamide (DMAc, HPLC grade) was purchased from Sigma, Poz- nan, Poland. 2.2. Stimulation of the Enzymes by WLPL Illumination Cellulase WT batch solution was prepared by dissolving 20 mg solid enzyme in 20 ml acetate buffer (pH = 5). In the case of cellulase TR 2 ml aliquot of original enzyme preparation was dissolved in 18 ml pH 5 acetate buffer. Solutions of both enzymes were divided into three 6 ml samples. One sample of each enzyme solution was stored in the dark, whereas the other samples were placed in the glass cells and illuminated with WLPL for 60 and 120 min respectively. Samples were illuminated from the 30 cm distance with a KB 502 slit illuminator (Kabid, Chorzów, Poland) equipped with 150 W xenon arc (XBO 150. Oriel, Maidstone, UK). An HN 22 linear polarizing filter (Polaroid, Waltham MA, USA) with a glass filter cutting off wavelengths below 500 nm was mounted be- tween the slit illuminator and the sample. The light source emitted continuous radiation in the visible range. Its energy flux at the position of the sample was 8 mW/c m2 as checked by YSI radiometer (Yellow Springs, OH, USA). During the illumination temperature in the place of the samples was controlled and did not exceeded 20˚C. Immediately after termination of the illumination specific activity of each enzyme sample was measured. 2.3. Determination of Specific Activity of Native and WLPL Stimulated Enzymes Specific activity of enzymes prior to and after WLPL illumination was determined by its effect on microcrys- talline cellulose with respect to glucose formation. Re- leased glucose was determined in a hexokinase/glucose-6- phosphate dehydrogenase system at 340 nm using Glu- cose (HK) Assay Kit (SIGMA, Poznan, Poland) em- ploying procedure reported elsewhere [16]. One unit of activity releases 0.01 mg glucose per hour from micro- crystalline cellulose at 37˚C. 2.4. Enzymatic Hydrolysis of Microcrystalline Cellulose Catalyzed by Native and Illuminated Enzymes Cellulose samples (800 mg) were exactly weighed in Erlenmeyer flasks and suspended in acetate buffer (pH = 5, 38 ml). Erlenmeyer flasks containing cellulose sus- pensions were placed in water bath for 5 min at 37˚C, than aliquots (2 ml) of native and WLPL illuminated solutions of respective enzymes were added and reaction mixtures were incubated in a shaking water bath. In the specified time intervals 0.4 ml aliquots were removed from the reaction mixture, centrifuged at 8000 rpm for 10 min and supernatants were diluted with deionized water to obtain final sample volume (2 ml). In each sample reducing sugars were determined by the DNS method [16]. 2.5. Determination of Molecular Weight (Mw) and Radii of Gyration (Rg) of, Native and Enzymatically Digested Microcrystalline Cellulose Chains 2.5.1. Sample Preparation for Chromatographic Assay Microcrystalline cellulose samples were dissolved in 8% LiCl/DMac by slightly modified method described else- where [17,18]. Thus, 4 × 10⁻² g cellulose was placed in 10 ml measuring flask then cellulose was activated by two consecutive swellings in 10 ml deionised water at 40˚C, for 8 hr, followed by two consecutive transfers of the sam- ples into 8 ml methanol for 45 min and finally into two consecutive transfers into 8 ml DMAc for 12 hr. After each exchange, solvent was removed by vacuum filtra- Copyright © 2012 SciRes. OJOPM E. NOWAK ET AL. 47 tion. After the last DMAc exchange 10 ml of 8% LiCl/ DMAc was added to the sample. The samples were stirred initially at room temperature for 24 hr, than stirring con- tinued at 4˚C up to complete dissolution (2 to 3 days). Af- ter dissolution 2 ml aliquots were taken for chroma- tographic analysis, diluted to 20 ml volume with LiCl/ DMAc and filtered thorough a 0.5 μm pore PTFE filter (Whatman, England) prior to the injection. 2.5.2. Enzyme Digested Cellulose Samples Aliquots (2 ml) of the reaction mixture were collected at time intervals (10 min, 8 hr, 24 hr), placed in boiled water bath for 5 min, than centrifuged from denatured enzyme protein. Supernatant was slowly evaporated to dryness at 60˚C and resulted solid was dissolved in the same manner as native microcrystalline cellulose, omitting step of the cellulose activation by solvent exchange with water and methanol. Before analysis each sample was diluted to 20 ml vol- ume with LiCl/DMAc and filtered thorough a 0.5 μm pore PTFE filter (Whatman, England). Anhydrous DMAc, carefully dried over aluminium so- dium silicate molecular sieve, 0.4 nm effective pore size (Fisher Scientific, Springfield, NJ, USA), was used for activation, and for the preparation of the dissolution sol- vent and SEC mobile phase. LiCl was oven dried and, prior to use, stored in desiccator in pre-weighted amounts. 2.5.3. High Performance Size Exclusion Chromatography (HPSEC-MALLS-RI) The high performance size exclusion chromatography (HPSEC) system for determination of average molecular weight and radii of gyration of native and digested microcrystalline cellulose chains consisted of a pump (Shimadzu 10AC, Tokyo, Japan), an injection valve with 500 μl loop (model 7021, Rheodyne, Palo Alto, CA, USA), a SDV guard column (50 × 8 mm, 20 μm, PSS, Mainz, Germany), and two connected size exclusion columns SDV (300 × 8mm, 20 μm, PSS, Mainz, Ger- many) and SDV Linear XL (600 × 8 mm, 10 μm, PSS, Mainz, Germany). The columns were placed in a ther- mostated column compartment and the system was oper- ated at 60˚C. A multiangle laser light scattering detector (MALLS) operating in chromatographic mode using a He-Ne laser light source (630.0 nm) (Dawn-DSP-F, Wyatt Technology, Santa Barbara, CA, USA) and a dif- ferential refractive index detector (L-7490, Merck, Dar- mstadt, Germany) were connected to the columns. The mobile phase (0.5% LiCl/DMAc) was filtered through 0.2 μm PTFE (Whatman, England) and vacuum degassed. The flow rate of the mobile phase and the sample injec- tion volume were 1.0 ml/min and 500 μl, respectively. The output voltage of refractive index (RI) and light scattering (LS) at 18 angles was used for calculation of the weight-average molecular weight (Mw) and radius of gyration (Rg) using Astra 4.73.04 software (Wyatt Tech- nology, Santa Barbara, CA, USA). In calculations of Mw and Rg dn/dc value 0.077 (ml/g) for cellulose [19] was applied. The Berry plot with third order polynomial fit was ap- plied in the calculation of Mw and Rg values. Separations were run in duplicates. 2.6. Determination of Molecular Weight (Mw) and Radii of Gyration (Rg) of Enzyme Protein Chains. Average molecular weight (Mw) and radii of gyration (Rg) of original and illuminated enzyme protein chains were determined using HPSEC-MALLS-RI system described in previous section. The separation was carried out on a set of two con- nected size exclusion columns TSKgel GMPWXL (300 7.8 mm, Tosoh Corporation, Tokyo, Japan) and TSKgel 2500 PWXL (300 7.8 mm, Tosoh Corporation, Tokyo, Japan). The columns and the refractive index detector were maintained at 25˚C. The mobile phase (0.15 M NaNO3 with 0.02% sodium azide) was filtered through 0.2 and 0.1 μm cellulose acetate filters (Whatman, Eng- land) and vacuum degassed. The flow rate of the mobile phase and the sample injection volume were 0.4 ml/min−1 and 500 μl respectively. Prior to injection, the batch solu- tions of original and illuminated enzymes were filtered through a 0.5 μm pore cellulose acetate filter (Whatman, England). 2.7. Evaluation of Protein Conformation of Enzymes Cd Spectra Circular dichroism spectra of the WT and TR cellulase solutions kept in the dark and illuminated for 1 h and 2 h with visible nonpolarized and linearly polarized light were recorded using a JASCO J-710 (Jasco, Japan) spec- trophotometer (upgraded to a J-715). Sample Preparation Water batch solutions (30 ml) of each enzyme at concen- tration of 2 mg/ml were divided into 3 parts. One sample was stored in the dark. Two other samples of each en- zyme were illuminated with WLPL for 1 h and 2 h, re- spectively, under conditions described above. Immedi- ately after termination of illuminations samples were dialyzed and protein concentration in each sample was determined. Samples were diluted with water to obtain final protein concentration of 0.7 mg/ml. For evaluation of the secondary protein structure, CD spectra of each enzyme sample were recorded in the range of 250 - 190 nm using quartz cylindrical cells with the l of 0.2 mm optical path and scanning speed 20 nm/min. Subse- Copyright © 2012 SciRes. OJOPM 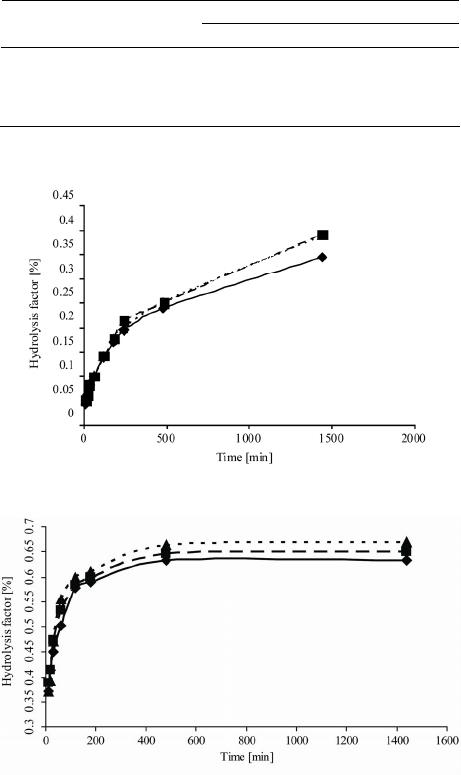 E. NOWAK ET AL. 48 quently, in order to evaluate the tertiary protein structure, spectra were recorded in the range of 350 - 250 nm using a quartz cylindrical 1 cm optical path cell. Each spectrum was the average of three scans with the average buffer control spectrum subtracted. Data obtained were not smoothed. Proteins secondary structure content was per- formed with 1.51 Spectra Manager software using refer- ence set containing five proteins: hemoglobin, lysozyme, myoglobin, ribonuclease A and α-chymotripsin A. 3. Results and Discussion Specific activity of WT and TR enzymes, original and WLPL illuminated for 60 (WT60, TR60) and 120 min (WT120, TR120) are presented in Table 1. Specific activity of enzyme WT illuminated with WLPL for 60 min was slightly, although statistically sig- nificantly, higher, than activity of original enzyme. Pro- longed (120 min) illumination of this sample led to fur- ther, more pronounced, increase in the enzyme specific activity. In the case of enzyme TR, Illumination with WLPL for 60 min did not change specific activity of TR enzyme. However, its illumination for 120 min led to significant increase in its specific activity. Hydrolysis kinetics curves of microcrystalline cellu- lose digested by solutions of non-illuminated and WLPL illuminated enzymes WT and TR are presented in Fig- ures 1(a) and (b) respectively. Enzymes degrading carbohydrate polymers can follow three fundamentally different mechanisms [20]. They are 1) a multiple chain mechanism, where the enzyme-sub- strate complex dissociates after each reaction; 2) a sin- gle-chain mechanism, where the enzyme remains associ- ated with the substrate until every cleavage-plaint linkage in the chain hydrolyzes; and 3) a multiple attack mecha- nism, where a given average number of attacks were per- formed after the formation of the enzyme-substrate com- plex. As it can be seen in Figures 1(a) and (b), the deg- radation of cellulose by original and illuminated enzymes follows two rate laws. Rate constants for both stages of enzymatic degrada- tion of cellulose with native and WLPL stimulated en- zymes WT and TR are given in Table 2 Illumination of enzyme WT with WLPL for 60 min led to slight, al though statistically significant rise of the rate constant for the first stage of cellulose degradation. Rate constant for the first step of the cellulose hydrolysis catalyzed by WT illuminated for 120 min remained unchanged. In the case of enzyme TR, illumination with WLPL for 120 min led to significant rise of rate constant of the first stage of the cellulose degradation. In the case of the second, much slower stage of the cel- lulose degradation, illumination of both WT and TR en- zymes with WLPL for 120 min led to a rise of k2 rate con- stant. Acceleration of the second step of the cellulose deg- radation was much more pronounced in the case of en- zyme WT stimulated with WLPL for 120 min as com- pared to similarly treated enzyme TR. In order to check whether stimulation of cellulases by means of illumination with WLPL have any impact on molecular structure of cellulose chains in the course of hydrolysis average molecular weight (Mw) and radii of gyration (Rg) of microcrystalline cellulose chains native and digested for 10min, 480 min and 1440 min with original and WLPL stimulated enzymes WT and TR were taken. Measurements were performed for the material eluted under whole polysaccharide peak from HPLC col- umn (Table 3). Table 1. Specific activity of enzymes WT and TR prior to and after illumination with the WLPLa. Enzyme specific activity Enzyme illumination time [min] WT [u/mg] TR [u/ml] 0 65.0 ± 0.6 820.1 ± 10.0 60 68.3 ± 0.8 823.0 ± 9.1 120 73.4 ± 0.9 1166.6 ± 10.1 aMeans of three independent experiments ± standard deviation. (a) (b) Figure 1. (a) Kinetics of the microcrystalline cellulose hy- drolysis with enzyme WT; (b) Kinetics of the microcrystal- line cellulose hydrolysis with enzyme TR. Samples of en- zymes native (♦) and illuminated with WLPL for 60 min (■) and 120 min (▲). Copyright © 2012 SciRes. OJOPM  E. NOWAK ET AL. Copyright © 2012 SciRes. OJOPM 49 Table 2. Rate constants of the enzymatic degradation of cel- lulose with enzymes WT and TR prior to and after their stimulation with WLPLa. Samplea k1 × 10−4[mg/mL–1/ min–1] k2 × 10−5[mg/mL–1/min–1] WT 2.60 ± 0.20 4.34 ± 0.21 WT 60 3.00 ± 0.15 4.34 ± 0.32 WT 120 2.60 ± 0.15 8.68 ± 0.34 TR 7.81 ± 0.20 1.30 ± 0.13 TR 60 7.38 ± 0.20 1.30 ± 0.12 TR 120 9.12 ± 0.18 1.74 ± 0.21 aMeans of three independent experiments ± standard deviation. Molecular weight of polysaccharides digested for 10 min by original enzymes WT and TR slightly declined. The same effect was noted for the cellulose molecules digested for 10 min by WT and TR enzymes stimulated with WLPL for 60 min. However, average molecular weight of cellulose chains digested 10 min by WT and TR illuminated with WLPL for 120 min decreased signifi- cantly to 1.58 × 10⁶ and 1.57 × 10⁶, respectively. Calcu- lated average molecular weight of cellulose chains left non-digested in the reaction mixture after 480 min of the hydrolysis differed greatly, depending of the enzyme ori- gin and time of their stimulation with WLPL. Sharp reduc- tion of average molecular weight of the cellulose polysac- charide chains digested for 480 min by original WT (0.761 × 10⁶), WT60 (0.550 × 10⁶) and WT120 min (0.148 × 10⁶) could be noted. Likely, original and WLPL stimulated enzyme in the first stage of the reaction, hydrolyzed mainly long cellulose chains of high molecular weight. In contrast to it, average molecular weight of polysaccharide chains digested for 480 min by original enzyme TR (2.56 × 10⁶) was slightly lower than molecular weight observed for cellulose molecules digested by this enzyme for 10 min (2.88 × 10⁶). Possibly, mainly shorter cellulose chains were attacked by original enzyme TR in the first stage of hydrolysis. Similarly, such assumption could explain that in the reaction catalyzed by TR 120 (1.99 × 10⁶) average molecular weight of non-digested cellulose molecules was higher in the reaction mixture hydrolyzed for 480 min than in the reaction mixture digested for 10 min. Interestingly, the 60 min stimulation with WLPL led to significant de- crease in the average molecular weight of cellulose chains left in the reaction mixture after 480 min digestion by TR60 (0.330 × 10⁶). Average molecular weight of cellu- lose chains remaining in the reaction mixture after com- pleting hydrolysis within 1440 min were much higher than molecular weight of polysaccharide chains left after 480 min digestion for all original and WLPL enzymes studied. It could indicate that in the second stage of hydrolysis en- zymes digested mainly short cellulose chains. Molecular weight of original and WLPL stimulated enzymes WT and TR are presented in Table 4 and results of evaluation of the enzymes protein secondary conformation are summa- rized in Table 5. Table 3. Average molecular weight Mw and radii of gyration Rg of the cellulose chains hydrolyzed by native and illuminated with WLPL enzymes WT and TR prior to and after stimulation with WLPL.a Average molecular weight (Mw) and radii of gyration (Rg) of enzyme digested cellulose chains Hydrolysis time [min] 0 10 480 1440 Sampleb MW × 106 R g [nm] MW × 106 R g [nm] MW × 106 R g [nm] MW × 106 R g [nm] WT native 2.99 ± 0.104 80.15 ± 5.15 2.65 ± 0.105 59.7 ± 4.5 0.761 ± 0.05042.7 ±3.1 0.855 ± 0.025 93.1 ± 3.1 WT 60 2.99 ± 0.104 80.1 ± 5.15 2.67 ± 0.099 40.0 ± 5.0 0.550 ± 0.03447.7 ±3.4 1.35 ± 0.034 59.1 ± 5.0 WT 120 2.99 ± 0.104 80.1± 5.15 1.58 ± 0.099 103.8 ± 5.10.148 ± 0.04054.4 ±2.5 1.99 ± 0.099 39.8 ± 4.5 TR native 2.99 ± 0.104 80.1± 5.15 2.88 ± 0.100 78.3 ± 5.5 2.56 ± 0.09956.3 ± 3.3 1.61 ± 0.87 50.8 ± 4.1 TR 60 2.99 ± 0.104 80.1 ± 5.15 2.19 ± 0.102 42.1 ± 4.1 0.355± 0.02047.8 ± 2.6 2.45 ± 0.099 50.2 ± 2.1 TR 120 2.99 ± 0.104 80.1 ± 5.15 1.57 ± 0.080 40.6 ± 3.9 1.99 ± 0.05854.4 ± 3.2 2.52 ± 0.105 52.8 ± 2.3 aMeans of three independent experiments ± standard deviation; bThe numbers denotes illumination time (min). 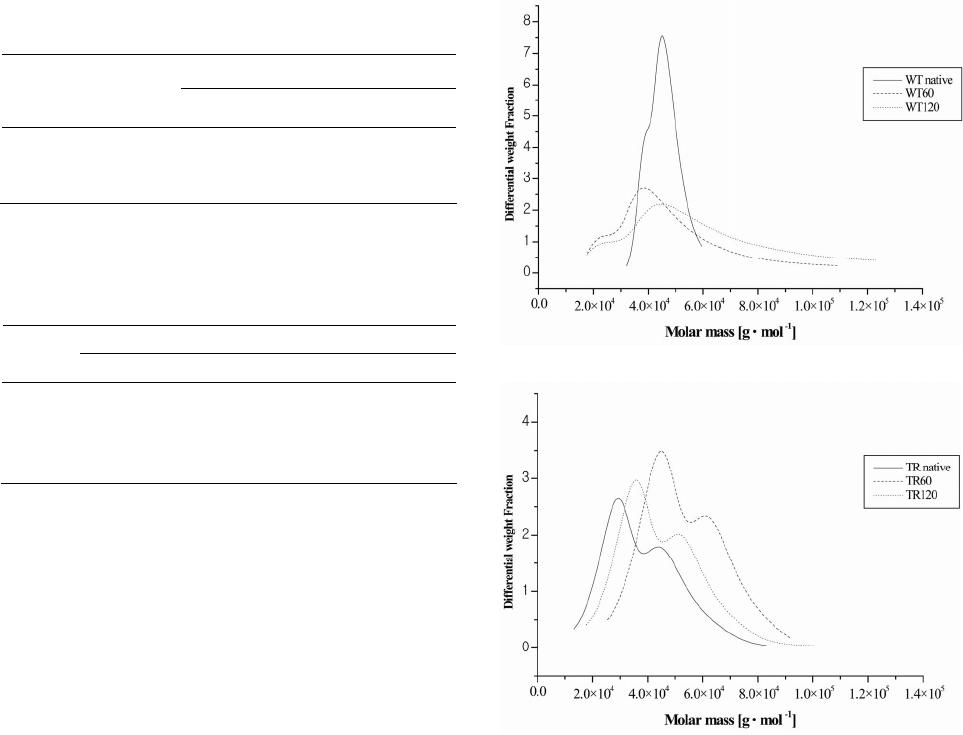 E. NOWAK ET AL. 50 Table 4. Molecular weight of native and WLPL illuminated enzymes WT and TR.a Enzyme molecular weight Enzyme illumination time [min] WT Mw × 104 TR Mw × 104 0 3.62 ± 0.25 4.04 ± 0.22 60 5.54 ±.0.31 6.25 ± 0.30 120 3.82 ± 0.29 4.67 ± 0.29 aMean of three independent experiments ± standard deviation. Table 5. Evaluation of the secondary structure of protein chains of enzymes WT and TR prior to and after WLPL il- lumination for 60 and 120 min. Enzymea Structure WT WT60 WT120 TR TR60TR120 Helix 18.6 18.7 18.0 29.5 27.4 29.6 Beta 34.5 34.3 34.7 29.3 30.5 29.2 Turn 5.8 6.2 7.1 0.0 0.0 0.0 Random 41.0 40.8 40.2 41.2 42.1 41.2 aThe numbers denotes illumination time. In this work we decided to measure molecular weight of original and illuminated enzymes and, based on re- corded CD spectra of the enzymes, evaluate their secon- dary conformation. Illumination with WLPL signifi- cantly changed molecular weight of the enzyme protein molecules. Molecular weight of original WT (3.63 × 10⁴) and TR (4.04 × 10⁴) enzymes increased significantly af- ter 60 min illumination to 5.54 × 10⁴ and 6.25 × 10⁴ re- spectively. Further, 120 min illumination of the enzyme solutions led to decrease in the molecular weight of both WT120 (3.82 × 10⁴) and TR120 (4.67 × 10⁴) enzymes. Using Astra 4.73.04 software both, RI and LS detectors provided differential molar mass distribution. The dif- ferential molar mass distribution offered the amount of polymer (differential weight fraction) in a given molar mass interval [21]. Plots of differential weight fraction vs molar mass for original and illuminated WT and TR en- zymes are given in Figures 2(a) and (b), respectively. Clearly, illumination with WLPL changed the distribu- tion of molecular weight of the enzyme WT protein chains. Polydispersity of molecular weight of the original en- zyme protein chains was much smaller than polydisper- sity observed for enzyme samples illuminated for 60 and 120 min. Samples of illuminated enzymes contained frac- tions with protein chains with much lower and much higher molecular weight than these in original enzymes. It has been established that the cellulase complex of Trichoderma reesei contains at least three enzyme com- ponents that are both physically and enzymatically dis- tinct and that all three components play essential roles in the overall process of converting cellulose to glucose. (a) (b) Figure 2. (a) Plot of Differential Weight Fraction vs Molar Mass for enzyme WT proteins prior to (WT native), and after illumination with WLPL for 60min (WT60) and 120 min (WT120); (b) Plot of Differential Weight Fraction vs Molar Mass for enzyme TR proteins prior to (TR native) and after illumination with WLPL for 60 min (TR60) and 120 min (TR 120). Observed increase of polydispersity of molecular weight of protein chains in WLPL illuminated samples of en- zyme WT could be result of light induced association between protein chains belonging to three different components of enzyme complex. One could expect that self association of protein molecules should lead to the products with molecular weight values periodic as multi- ples of a base molecular weight. However, random asso- ciation, induced by WLPL, between three different pro- tein chains led to the association products exhibiting broad range of molecular weight. Data presented in Table 5 revealed that independently the illumination time the secondary structure of activated proteins in cellulases WT and TR did not change. It has been shown [11] that pre-illumination of α-amylase Copyright © 2012 SciRes. OJOPM  E. NOWAK ET AL. 51 solutions with WLPL enhanced the starch hydrolysis rate and extent. Simultaneously, the illumination of α-amy- lase led to significant changes in the secondary confor- mation of the enzyme protein molecule. It has been as- sumed that conformational changes in the enzyme pro- tein structure were, at least partially, responsible for the observed enhancement of hydrolytic activity of pre-il- luminated α-amylase. Protein compositions of α-amylase and cellulases WT and TR are entirely different. Amy- lase is a single chain glycoprotein of about 475 residues and molecular weight in the range 50,000 [22]. Cellu- lases WT and TR are complex of three physically distinct components [23]. Such differences in molecular structure between amylase and cellulases studied could explain lack of conformational changes in proteins of WLPL activated cellulases. 4. Conclusions 1) Stimulation with white linearly polarized light of two cellulases WT and TR isolated from Trichoderma reesei increases the enzyme specific activity of the microcrystalline cellulose digestion and rate constants of both stages of enzymatic hydrolysis of microcrystalline cellulose. 2) The WLPL stimulation of cellulases significantly influences molecular structure of cellulose chains in di- gested microcrystalline cellulose compared to these re- sulting from the hydrolysis with original enzyme. 3) Illumination of both WT and TR enzymes led to significant changes of molecular weight of enzyme protein chains, however, activation of enzymes with WLPL did not change enzyme protein secondary structure. 5. Acknowledgements This work was financed by grant N N313 265936 from National Science Center, Poland. REFERENCES [1] K. Wickholm, E. Hult, P. Larsson, T. Iversen and H. Lennholm, “Quantification of Cellulose Forms in Com- plex Cellulose Materials: A Chemometric Model,” Cel- lulose, Vol. 8, No. 2, 2001, pp. 139-148. doi:10.1023/A:1016700325434 [2] L. R. Lynd, “Overview and Evaluation of Fuel Ethanol from Cellulosic Biomass: Technology, Economics, the Environment, and Policy,” Annual Review of Energy and the Environment, Vol. 21, 2001, pp. 403-465. doi:10.1146/annurev.energy.21.1.403 [3] L. R. Lynd, R. T. Elander and C. E. Wyman, “Likely Features and Costs of Mature Biomass Ethanol Technol- ogy,” Applied Biochemistry and Biotechnology, Vol. 57- 58, 1996, pp. 741-761. doi:10.1007/BF02941755 [4] L. Laureano-Perez, F. Teymouri, H. Alizadeh and B. E. Dale, “Understanding Factors That Limit Enzymatic Hy- drolysis of Biomass,” Applied Biochemistry and Bio- technology, Vol. 121, 1996, pp. 1081-1100. [5] H. Hoeksema, S. Monstrey, K. Van Landuyt, Ph. Blon- deel, P. Tonnard and A. Verpaele, “The Use of Polarised Light in the Treatment of Severely Burned Patients (Ab- stract),” 10th Congress of the International Society for Burn Injuries, Jerusalem, 1-6 November 1998, pp. 1-6. [6] K. Depuydt, S. Monstrey and H. Hoeksma, “The Stimu- lating Effects of Polarized Light on Wound Healing and Avoiding Surgery in the Treatment of Deep Dermal Burn Wounds Using Polarized Light,” 10th Annual Meeting of the European Association of Plastic Surgeons, Madrid, 21 May 1999, pp. 21-25. [7] W. Vanscheidt, “The Effect of Polarized Light on Wound Healing,” European Journal of Plastic Surgery, Vol. 24, No. 8, 2002, pp. 383-390. doi:10.1007/s00238-001-0306-z [8] E. Bazso, Sz. Varju, P. Szego, K. Roza and P. Apai, “Ap- plication of Incoherent Wide Band Polarised Light to Promote Healing of Wounds,” Central Research Institute for Physics, Budapest, 1982, pp. 121-130. [9] W. Stegmann, “Behandlung des Ulcus Cruris mit Polar- isiertem Licht,” Phlebologie und Proktologie, Vol. 14, 1985, pp. 96-97. [10] M. Fenyö, “Theoretical and Experimental Basis of Bio- stimulation,” Optics & Laser Technology, Vol. 16, 1984, pp. 209-215. doi:10.1016/0030-3992(84)90029-X [11] M. Fiedorowicz and G. Chaczatrian, “Effect of Illumina- tion with the Visible Polarized and Non-Polarized Light on α-Amylolysis of Starches of Different Botanical Ori- gin,” Journal of Agricultural and Food Chemistry, Vol. 51, No. 26, 2003, pp.7815-7819. doi:10.1021/jf026202r [12] A. Konieczna-Molenda, V. M. F. Lai, M. Fiedorowicz, G. Khachatryan and P. Tomasik, “Effect of Linearly Polar- ized Light upon Xylanase Activity,” Biotechnology Pro- gress, Vol. 24, No. 2, 2008, pp. 385-388. doi:10.1021/bp070394z [13] A. Konieczna-Molenda, M. Fiedorowicz, W. Zhong and P. Tomasik, “Polarized Light-Stimulated Enzymatic Hy- drolysis of Chitin and Chitosan,” Carbohydrate Research, Vol. 343, No. 18, 2008, pp. 3117-3119. doi:10.1016/j.carres.2008.09.007 [14] M. Fiedorowicz, A. Konieczna-Molenda and G. Khacha- tryan, “Stimulation of Cyclodextrin-Glycosyltransferase (Turozyme) Activity by Illumination with Linearly Po- larized Visible Light,” Biotechnology Progress, Vol. 25, No. 1, 2009, pp. 147-150. doi:10.1002/btpr.90 [15] A. Konieczna-Molenda, M. Fiedorowicz and P. J. Toma- sik, “Stimulation of Glucose Oxidase with White Linearly Polarized Light,” Biotechnology Progress, Vol. 26, No. 2, 2010, pp. 393-396. [16] G. L. Miller, “Use of Dinitrosalicylic Acid Reagent for Determination of Reducing Sugars,” Analytical Chemis- try, Vol. 31, No. 3, 1959, pp. 426-428. doi:10.1021/ac60147a030 [17] A. Dupont and G. Harrison, “Conformation and dn/dc Determination of Cellulose in N,N-Dimethylacetamide Copyright © 2012 SciRes. OJOPM  E. NOWAK ET AL. Copyright © 2012 SciRes. OJOPM 52 Containing Lithium Chloride,” Carbohydrate Polymers, Vol. 58, 2004, pp. 233-243. doi:10.1016/j.carbpol.2004.07.016 [18] A. Dupont and G. Harrison, “Comparative Evaluation of Size-Exclusion Chromatography and Viscometry for the Characterisation of Cellulose,” Journal of Chromatogra- phy A, Vol. 1026, No. 1, 2004, pp. 129-141. doi:10.1016/j.chroma.2003.11.002 [19] “Worthington Enzyme Manual,” Worthington Biochemi- cal Corporation, Lakewood, 1993. [20] D. W. Schrott, “Differential Molecular Weight Distribu- tions in High Performance Size Exclusion Chromatogra- phy” Journal of Liquid Chromatography & Related Te- chnologies, Vol. 16, No. 16, 1993, pp. 3371-3391. doi:10.1080/10826079308019695 [21] S. J. Horn, A. Sørbotten, B. Synstad, P. Sikorski, M. Sør- lie, K. M. Vårum and V. G. H. Eijsink, “Endo/Exo Mechanism and Processivity of Family 18 Chitinases Pro- duced by Serratia marcescens,” FEBS Journal, Vol. 273, No. 3, 2006, pp. 491-503. doi:10.1111/j.1742-4658.2005.05079.x [22] M. Granger, B. Abadie and G. Marchis-Mouren, “Limited Action of Trypsin on Porcine Pancreatic Amylase: Char- acterization of the Fragments,” FEBS Letters, Vol. 56, No. 2, 1975, pp. 189-197. doi:10.1016/0014-5793(75)81088-X [23] K. King and M. Vessal, “Enzymes of the Cellulase Com- plex,” Advances in Chemistry, Vol. 95, 1969, pp. 130- 149. |