

Paper Menu >>
Journal Menu >>
 Journal of Minerals and Materials Characterization and Engineering, 2012, 11, 730-734 Published Online July 2012 (http://www.SciRP.org/journal/jmmce) Model for Prediction of the Concentration of Extracted Tin during Leaching of Cassiterite in Potassium Hydroxide Solution Onyedika Gerald1*, Ugwu Priscilla1, Ogwuegbu Martin1, Ejike Emmanuel1, Nwoye Chukwuka2, Jiann-Yang Hwang3 1Mineral Processing Unit, Department of Chemistry, Federal University of Technology, Owerri, Nigeria 2Department of Metallurgical and Materials Engineering, Nnamdi Azikiwe University, Awka, Nigeria 3Materials Science and Engineering, Michigan Technological University, Houghton, USA Email: *[email protected] Received May 8, 2012; revised June 19, 2012; accepted July 10, 2012 ABSTRACT Model for prediction of the concentration of tin extracted during potassium hydroxide leaching of cassiterite has been derived. The model: A = Nt1.53, indicates that the concentration of tin extracted is dependent on the residence time. It was found that the validity of the model is rooted in the expression LogA = Log(Nt1.53). Tin extraction per unit time as obtained from experiment and derived model are 2.6666 and 2.6268 mg/min respectively. The maximum deviation of the model-predicted concentration of dissolved tin from the corresponding concentration obtained from the experiment was found to be less than 8%, which is quite within the acceptable deviation limit of experimental results and hence, impacting about 92% confidence coefficient on the model. Keywords: Model; Tin; Potassium Hydroxide; Cassiterite; Leaching 1. Introduction Tin presently finds extensive use in industrial and do- mestic applications. As a result of this, extraction of tin from ores has continued to attract considerable attention. Extraction of metals from their ores and recovery from their various industrial wastes are a major step towards judicious utilization and conservation of our mineral re- sources. Various works have been done to extract metals from their ores [1-4]. Cassiterite, otherwise known as tin ore is the only tin mineral from which tin can be ex- tracted in a commercial quantity. Matell [5] studied the extraction of tin from its ores by reduction of cassiterite to tin metal and then extracting the tin with aqueous in- organic acids. Models are of central importance in many scientific contexts, useful for testing, analysis or training where real-world systems or concepts can be represented by a model [6,7]. One of such models as reported by Hwang et al. [7] is a numerical simulation of heat transfer during the microwave heating process of a two dimensional, magnetic dielectric, magnetite, subjected to heat conduc- tion, convection and radiation. The heat transfer process was modeled using an explicit finite difference approach and the temperature profile for different heating parame- ters was generated through developing a code in mathe- matica 7.0. The derivation of models for the evaluation of the concentration of some metal values leached in some ores, concentrates, calcine or other solid materials containing metal(s) in some aqueous solutions of acids, bases, com- plexing agents, etc has gained very wide interest among researchers in recent time. Many models have been evalu- ated involving the use of different acids for the leaching of some ores. One of such works as reported by Nwoye [8] is the model for the computational analysis of the solution temperature during leaching of iron oxide ore in hydrochloric acid solution. The model is expressed as: N Te (1) 8.9055 Te (2) where T is the solution temperature (˚C) during leaching of iron oxide ore using hydrochloric acid; N = 8.9055 (pH coefficient for hydrochloric acid solution during leaching of iron oxide ore) determined by Nwoye et al. [9]; is the final pH of the leaching solution at the time t when the solution temperature is evaluated. Nwoye [10] also derived a model for computational analysis of the concentration of dissolved haematite and *Corresponding author. Copyright © 2012 SciRes. JMMCE 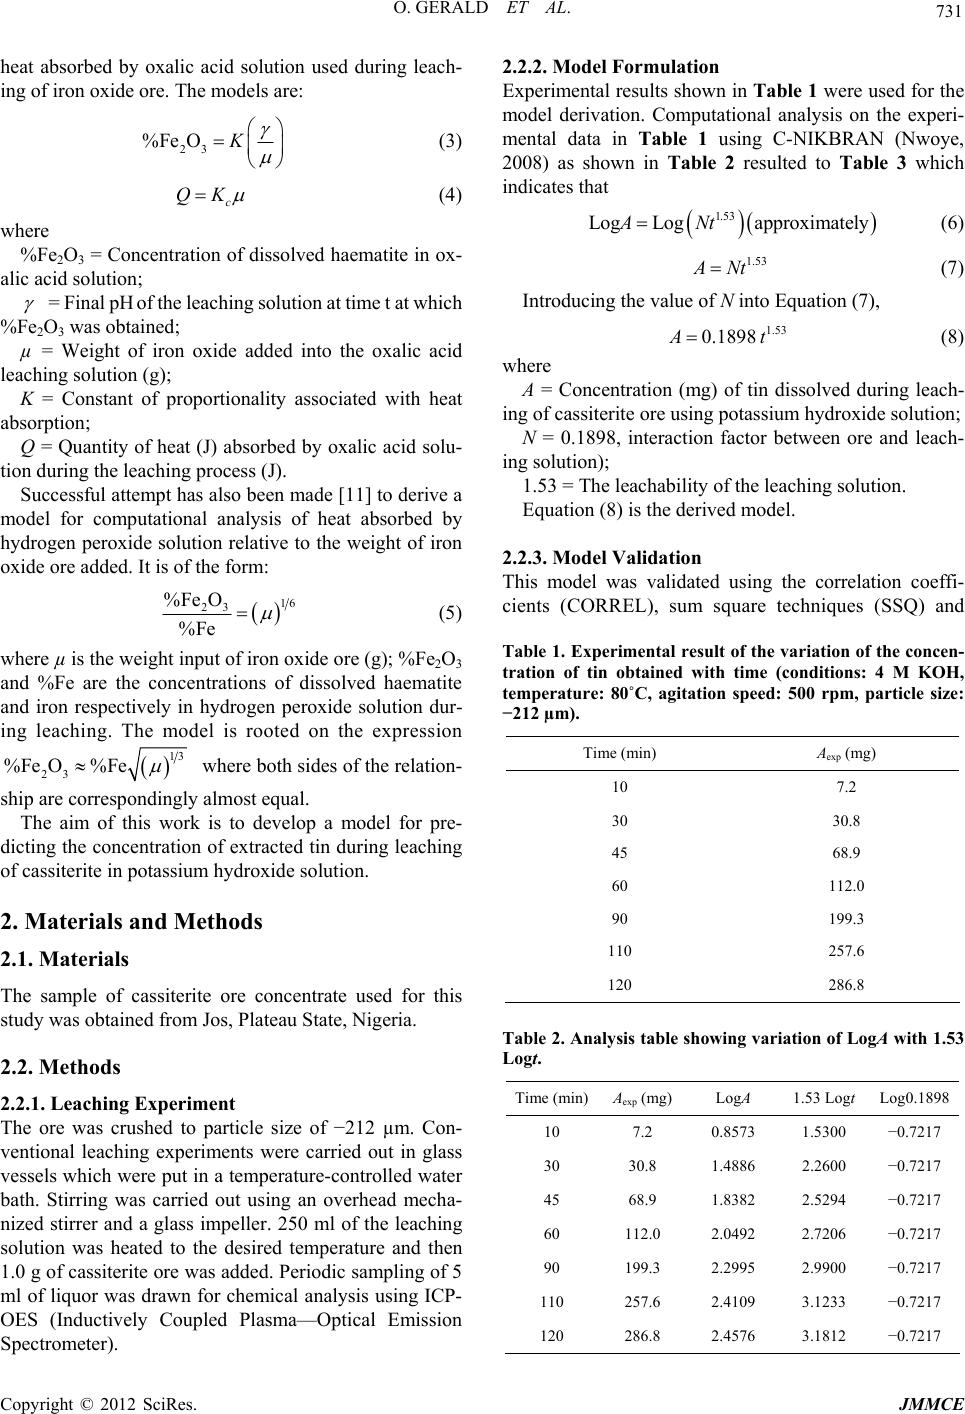 O. GERALD ET AL. 731 heat absorbed by oxalic acid solution used during leach- ing of iron oxide ore. The models are: 23 OK%Fe c QK (3) (4) where %Fe2O3 = Concentration of dissolved haematite in ox- alic acid solution; = Final pH of the leaching solution at time t at which %Fe2O3 was obtained; µ = Weight of iron oxide added into the oxalic acid leaching solution (g); K = Constant of proportionality associated with heat absorption; Q = Quantity of heat (J) absorbed by oxalic acid solu- tion during the leaching process (J). Successful attempt has also been made [11] to derive a model for computational analysis of heat absorbed by hydrogen peroxide solution relative to the weight of iron oxide ore added. It is of the form: 16 23 e O %Fe %F (5) where µ is the weight input of iron oxide ore (g); %Fe2O3 and %Fe are the concentrations of dissolved haematite and iron respectively in hydrogen peroxide solution dur- ing leaching. The model is rooted on the expression 13 %Fe 23 %Fe O where both sides of the relation- ship are correspondingly almost equal. The aim of this work is to develop a model for pre- dicting the concentration of extracted tin during leaching of cassiterite in potassium hydroxide solution. 2. Materials and Methods 2.1. Materials The sample of cassiterite ore concentrate used for this study was obtained from Jos, Plateau State, Nigeria. 2.2. Methods 2.2.1. Leaching Experiment The ore was crushed to particle size of −212 µm. Con- ventional leaching experiments were carried out in glass vessels which were put in a temperature-controlled water bath. Stirring was carried out using an overhead mecha- nized stirrer and a glass impeller. 250 ml of the leaching solution was heated to the desired temperature and then 1.0 g of cassiterite ore was added. Periodic sampling of 5 ml of liquor was drawn for chemical analysis using ICP- OES (Inductively Coupled Plasma—Optical Emission Spectrometer). 2.2.2. Model Formulation Experimental results shown in Table 1 were used for the model derivation. Computational analysis on the experi- mental data in Table 1 using C-NIKBRAN (Nwoye, 2008) as shown in Table 2 resulted to Table 3 which indicates that 1.53 Log LogapproximatelyANt 1.53 (6) A Nt 1.53 0.1898 (7) Introducing the value of N into Equation (7), A t (8) where A = Concentration (mg) of tin dissolved during leach- ing of cassiterite ore using potassium hydroxide solution; N = 0.1898, interaction factor between ore and leach- ing solution); 1.53 = The leachability of the leaching solution. Equation (8) is the derived model. 2.2.3. Model Validation This model was validated using the correlation coeffi- cients (CORREL), sum square techniques (SSQ) and Table 1. Experimental result of the variation of the concen- tration of tin obtained with time (conditions: 4 M KOH, temperature: 80˚C, agitation speed: 500 rpm, particle size: −212 µm). Time (min) Aexp (mg) 10 7.2 30 30.8 45 68.9 60 112.0 90 199.3 110 257.6 120 286.8 Table 2. Analysis table showing variation of LogA with 1.53 Logt. Time (min)Aexp (mg)LogA 1.53 Logt Log0.1898 10 7.2 0.8573 1.5300 −0.7217 30 30.8 1.4886 2.2600 −0.7217 45 68.9 1.8382 2.5294 −0.7217 60 112.0 2.0492 2.7206 −0.7217 90 199.3 2.2995 2.9900 −0.7217 110 257.6 2.4109 3.1233 −0.7217 120 286.8 2.4576 3.1812 −0.7217 Copyright © 2012 SciRes. JMMCE 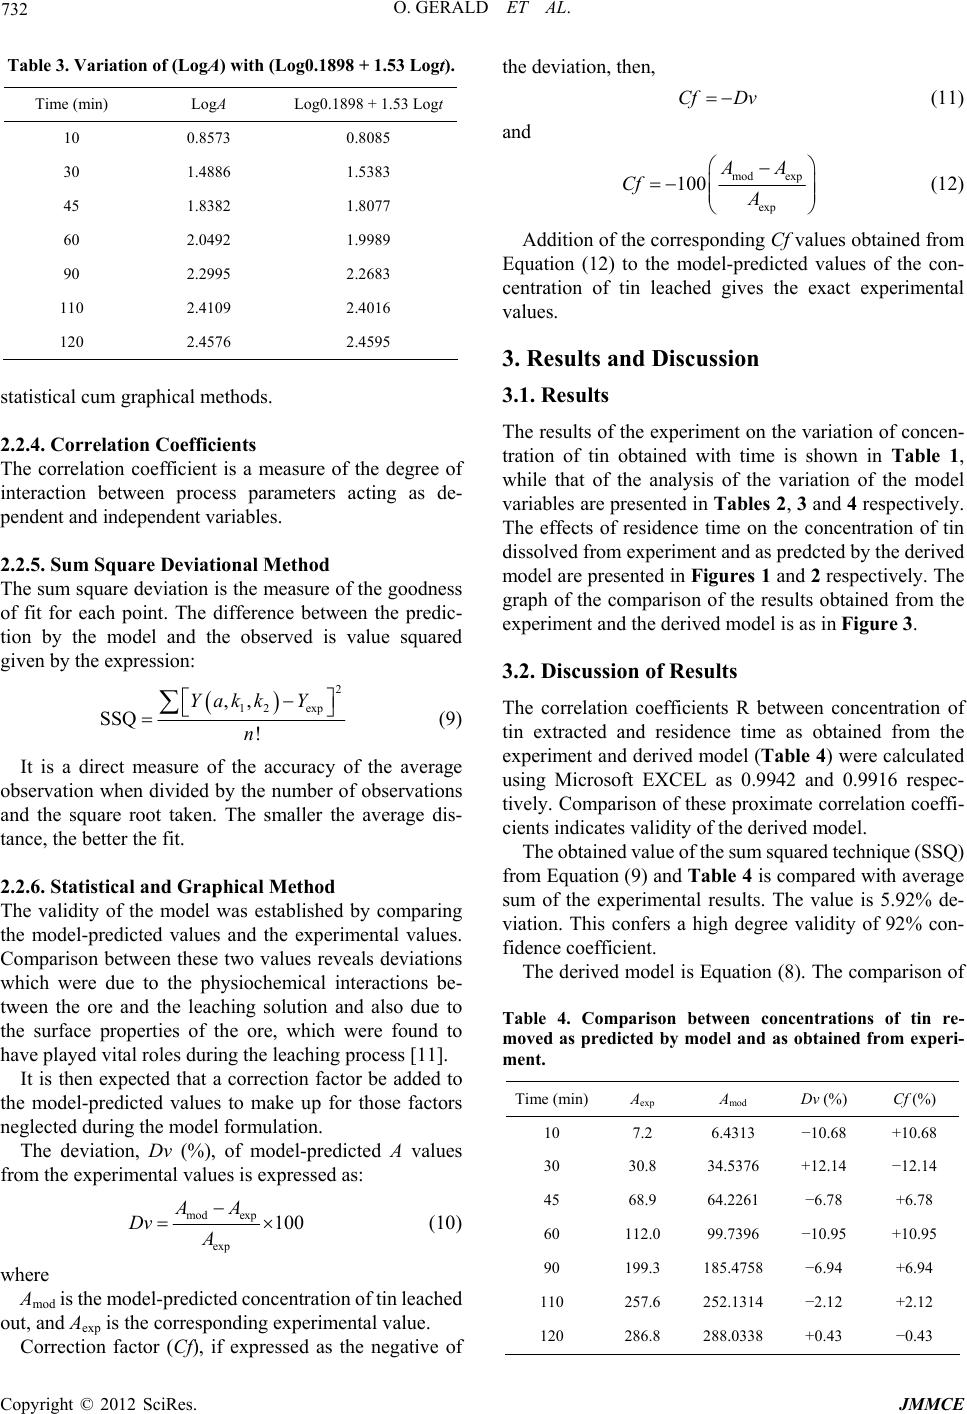 O. GERALD ET AL. 732 Table 3. Variation of (LogA) with (Log0.1898 + 1.53 Logt). Time (min) LogA Log0.1898 + 1.53 Logt 10 0.8573 0.8085 30 1.4886 1.5383 45 1.8382 1.8077 60 2.0492 1.9989 90 2.2995 2.2683 110 2.4109 2.4016 120 2.4576 2.4595 statistical cum graphical methods. 2.2.4. Correlation Coefficients The correlation coefficient is a measure of the degree of interaction between process parameters acting as de- pendent and independent variables. 2.2.5. Sum Square Deviational Method The sum square deviation is the measure of the goodness of fit for each point. The difference between the predic- tion by the model and the observed is value squared given by the expression: 2 12 exp ,, ! kkY n SSQ Ya (9) It is a direct measure of the accuracy of the average observation when divided by the number of observations and the square root taken. The smaller the average dis- tance, the better the fit. 2.2.6. Statistical and Graphical Method The validity of the model was established by comparing the model-predicted values and the experimental values. Comparison between these two values reveals deviations which were due to the physiochemical interactions be- tween the ore and the leaching solution and also due to the surface properties of the ore, which were found to have played vital roles during the leaching process [11]. It is then expected that a correction factor be added to the model-predicted values to make up for those factors neglected during the model formulation. The deviation, Dv (%), of model-predicted A values from the experimental values is expressed as: mo Dv d exp exp 100 AA A Cf Dv (10) where Amod is the model-predicted concentration of tin leached out, and Aexp is the corresponding experimental value. Correction factor (Cf), if expressed as the negative of the deviation, then, (11) and mod exp exp 100 AA Cf A (12) Addition of the corresponding Cf values obtained from Equation (12) to the model-predicted values of the con- centration of tin leached gives the exact experimental values. 3. Results and Discussion 3.1. Results The results of the experiment on the variation of concen- tration of tin obtained with time is shown in Table 1, while that of the analysis of the variation of the model variables are presented in Tables 2, 3 and 4 respectively. The effects of residence time on the concentration of tin dissolved from experiment and as predcted by the derived model are presented in Figures 1 and 2 respectively. The graph of the comparison of the results obtained from the experiment and the derived model is as in Figure 3. 3.2. Discussion of Results The correlation coefficients R between concentration of tin extracted and residence time as obtained from the experiment and derived model (Table 4) were calculated using Microsoft EXCEL as 0.9942 and 0.9916 respec- tively. Comparison of these proximate correlation coeffi- cients indicates validity of the derived model. The obtained value of the sum squared technique (SSQ) from Equation (9) and Table 4 is compared with average sum of the experimental results. The value is 5.92% de- viation. This confers a high degree validity of 92% con- fidence coefficient. The derived model is Equation (8). The comparison of Table 4. Comparison between concentrations of tin re- moved as predicted by model and as obtained from experi- ment. Time (min)Aexp Amod Dv (%) Cf (%) 10 7.2 6.4313 −10.68 +10.68 30 30.8 34.5376 +12.14 −12.14 45 68.9 64.2261 −6.78 +6.78 60 112.0 99.7396 −10.95 +10.95 90 199.3 185.4758 −6.94 +6.94 110 257.6 252.1314 −2.12 +2.12 120 286.8 288.0338 +0.43 −0.43 Copyright © 2012 SciRes. JMMCE 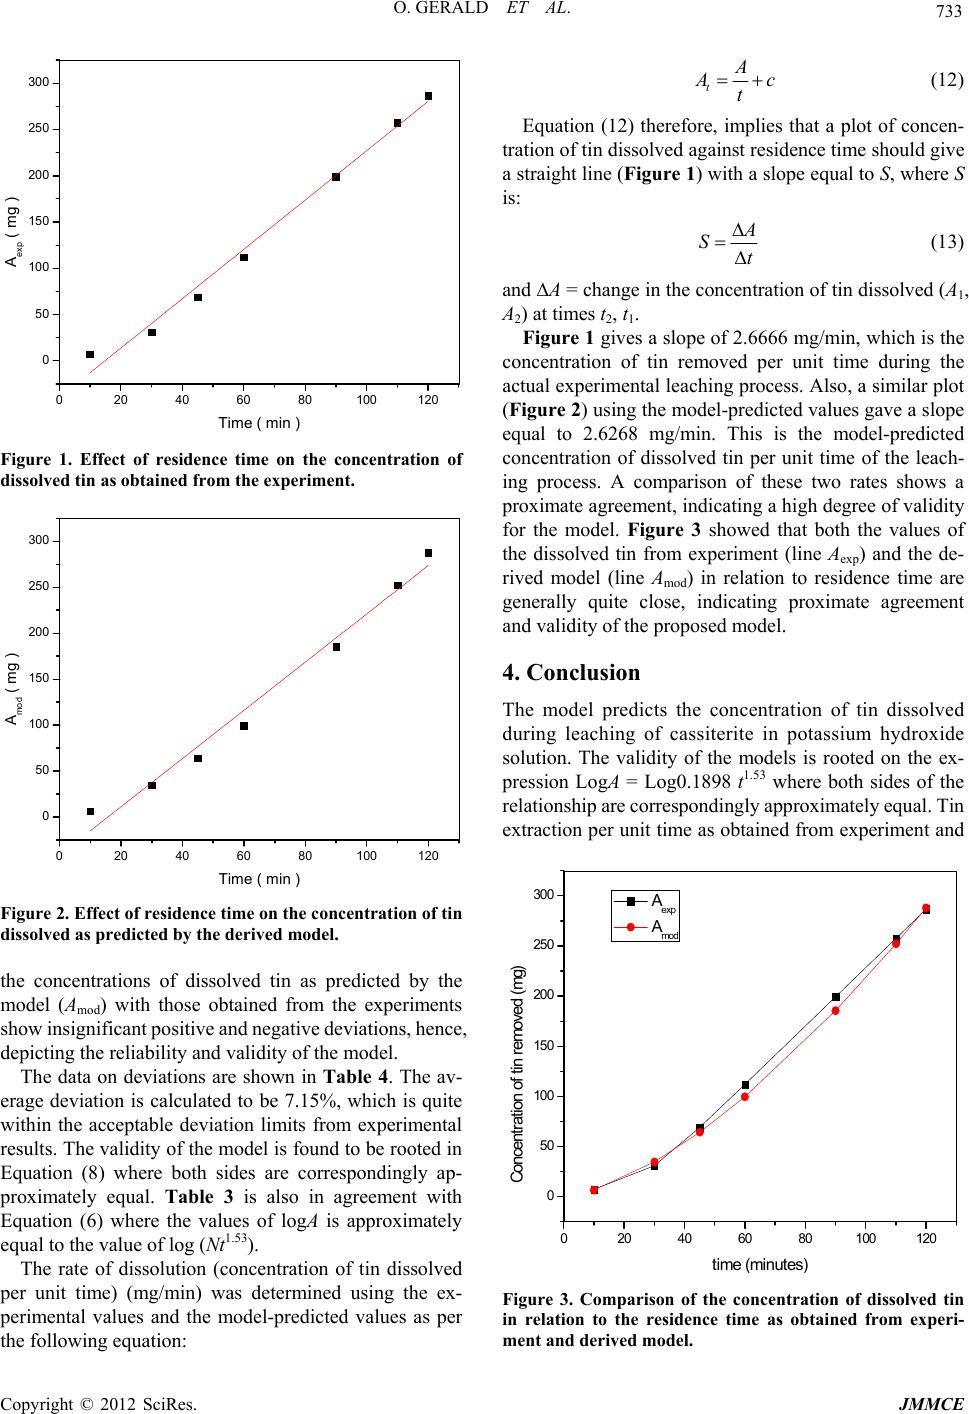 O. GERALD ET AL. 733 020 40 60 80 0 50 100 150 200 250 300 100 120 Aexp ( mg ) Time ( mi n ) Figure 1. Effect of residence time on the concentration of dissolved tin as obtained from the experiment. 0 20406080 0 50 100 150 200 250 300 100120 Amod ( mg ) Time ( mi n ) Figure 2. Effect of residence time on the concentration of tin dissolved as predicted by the derived model. the concentrations of dissolved tin as predicted by the model (Amod) with those obtained from the experiments show insignificant positive and negative deviations, hence, depicting the reliability and validity of the model. The data on deviations are shown in Table 4. The av- erage deviation is calculated to be 7.15%, which is quite within the acceptable deviation limits from experimental results. The validity of the model is found to be rooted in Equation (8) where both sides are correspondingly ap- proximately equal. Table 3 is also in agreement with Equation (6) where the values of logA is approximately equal to the value of log (Nt1.53). The rate of dissolution (concentration of tin dissolved per unit time) (mg/min) was determined using the ex- perimental values and the model-predicted values as per the following equation: tA A c t (12) Equation (12) therefore, implies that a plot of concen- tration of tin dissolved against residence time should give a straight line (Figure 1) with a slope equal to S, where S is: A St (13) and ∆A = change in the concentration of tin dissolved (A1, A2) at times t2, t1. Figure 1 gives a slope of 2.6666 mg/min, which is the concentration of tin removed per unit time during the actual experimental leaching process. Also, a similar plot (Figure 2) using the model-predicted values gave a slope equal to 2.6268 mg/min. This is the model-predicted concentration of dissolved tin per unit time of the leach- ing process. A comparison of these two rates shows a proximate agreement, indicating a high degree of validity for the model. Figure 3 showed that both the values of the dissolved tin from experiment (line Aexp) and the de- rived model (line Amod) in relation to residence time are generally quite close, indicating proximate agreement and validity of the proposed model. 4. Conclusion The model predicts the concentration of tin dissolved during leaching of cassiterite in potassium hydroxide solution. The validity of the models is rooted on the ex- pression LogA = Log0.1898 t1.53 where both sides of the relationship are correspondingly approximately equal. Tin extraction per unit time as obtained from experiment and 0 20406080100120 0 50 100 150 200 250 300 Aexp A mod Concentration of tin removed (mg) time ( min u tes ) Figure 3. Comparison of the concentration of dissolved tin in relation to the residence time as obtained from experi- ment and derived model. Copyright © 2012 SciRes. JMMCE  O. GERALD ET AL. Copyright © 2012 SciRes. JMMCE 734 derived model are 2.6666 and 2.6268 mg/min respec- tively. The average deviation of the amount of the model- predicted concentration of tin from the corresponding experimental values was found to be less than 8%, which is quite within the acceptable range of deviation limit of experimental results. Also, the rate of dissolution as ob- tained from experiment and derived model show proxi- mate agreement, and hence, indicates a very high degree of validity for the model. REFERENCES [1] A. A. Baba, F. A. Adekola and A. O. Folashade, “Quan- titative Leaching of a Nigerian Iron Ore in Hydrochloric Acid,” Journal of Applied Sciences & Environmental Ma- nagement, Vol. 9, No. 3, 2005, pp. 15-20. [2] P. K. Jena, “Chloride Process in Treating Ores and Wastes,” Institute of Advanced Technology and Envi- ronmental Studies and Natural Resources Development Foundation, Boulder, 80A-81A, 2000. [3] M. O. C. Ogwuegbu and F. Chileshe, “Coordination Chem- istry in Mineral Processing,” Mineral Processing and Ex- tractive Metallurgy Review, Vol. 21, 2000, pp. 497 -525. [4] E. A. Brocchi and F. J. Moura, “Chlorination Methods Applied to Recover Refractory Metals from Tin Slags,” Minerals Engineering, Vol. 21, No. 2, 2008, pp. 150-156. doi:10.1016/j.mineng.2007.08.011 [5] S. A. Martell, “Extraction of Tin from Its Ores,” United States Patent No. 4638074. [6] G. E. P. Box and N. R. Draper, “Empirical Model- Building and Response Surfaces,” Wiley, London, 1987, p. 424. [7] Z. Peng, J.-Y. Hwang, C. Park, B. Kim and G. Onyedika, “Numerical Analysis of Heat Transfer Characteristics in Microwave Heating of Magnetic Dielectrics,” Metallur- gical and Materials Transaction A, Vol. 43, No. 3, 2012, pp. 1070-1078. [8] C. I. Nwoye, G. C. Obasi, U. Mark, C. C. Nwankwo and S. Inyama, “Model for Calculating the Concentration of Leached Iron Relative to the Final Solution Temperature during Sulphuric Acid Leaching of Iiron Oxide Ore,” New York Science Journal, Vol. 2, No. 3, 2009, pp. 49- 54. [9] C. I. Nwoye, “Synchro Well Research Work Report,” DFM Unit, Boulder, No. 2561178, 2006, pp. 66-83. [10] C. I. Nwoye, “Model for Computational Analysis of Dis- solved Haematite and Heat Absorbed by Oxalic Acid So- lution during Leaching of Iron Oxide Ore,” Journal of Engineering and Applied Sciences, Vol. 4, 2008, pp. 22- 25. [11] C. I. Nwoye, R. A. Umana, G. C. Obasi, U. C. Nwoye and C. C. Nwakwuo, “Model for the Calculation of the Concentration of Dissolved Haematite during Hydrogen Peroxide Leaching of Iron Oxide Ore,” International Journal of Engineering and Applied Science, Vol. 8, 2009, pp. 339-347. |