

Paper Menu >>
Journal Menu >>
 Journal of Minerals and Materials Characterization and Engineering, 2012, 11, 671-678 Published Online July 2012 (http://www.SciRP.org/journal/jmmce) Mechanical Properties of Iron Ore Tailings Filled-Polypropylene Composites Segun Mathew Adedayo1, Modupe Adeoye Onitiri2* 1Department of Mechanical Engineering, University of Ilorin, Ilorin, Nigeria 2Department of Mechanical Engineering, University of Lagos, Lagos, Nigeria Email: *[email protected] Received February 4, 2012; revised March 20, 2012; accepted April 15, 2012 ABSTRACT Iron ore tailings filled polypropylene (PP) composites were produced using the compo-indirect squeeze casting (C-ISC) process. Particle sizes 150, 212 and 300 µm where considered for different volume fractions of 5% to 30% at intervals of 5%. The tensile and impact behavior of the produced composites were investigated, experimentally, by carrying out uniaxial tensile and izod impact tests to obtain tensile strength, elongation at break, modulus of elasticity and impact strength. Empirical data were compared with results obtained from models proposed by Nielsen, Bigg and Einstein. The experimental results show that elongation at break for iron ore tailings filled PP reduces with increasing 150 µm particle size. Tensile strength reduces with increasing filler. The Bigg equation exhibited improved predictability with decreas- ing particle size of filler in PP; while the Einstein equation which assumes poor adhesion gives the best prediction of modulus of elasticity with increasing particle size in PP. Izod impact strength decreases with particle size but increases with increasing volume content of iron ore tailings from 5% to 25% for each particle size considered. Keywords: Compo-Indirect Squeeze Casting; Iron Ore Tailings; Polypropylene; Izod; Composite 1. Introduction Particle reinforced plastics composites (PRPCs) are com- posites to which fillers (discrete particles) have been added to modify or improve the properties of the matrix and/or replace some of the matrix volume with a less expensive material. Common applications of PRPCs in- clude structural materials in construction, packaging, automobile tyres, medicine, etc. Determination of effec- tive properties of composites is an essential problem in many engineering applications [1,2]. These properties are influenced by the size, shape, properties and spatial dis- tributions of the reinforcement [1,3,4]. Among the various studies carried out with particle filled PP worth mentioning, are works by Maiti and Ma- hapatro [5,6] on the tensile and impact behavior of nickel- powder-filled PP and CaCO3 filled PP composites. It was discovered that the addition of nickel-powder causes de- crease in tensile modulus, tensile strength and elonga- tion-at-break with increasing filler. In the case of the addition of CaCO3, tensile modulus increased while ten- sile strength and elongation-at-break decreased with in- creasing filler. Izod impact strength for the composites at first increased up to a critical filler content, beyond which the value decreased inappreciably. In a related work, Tavman [7], performed tensile test on aluminum powder reinforced high-density polyethylene composites. The empirical data obtained were compared with theo- retical findings from the Nielsen’s, Bigg’s and Einstein’s mathematical models. He discovered that Einstein’s model explains the experimental results below 12% volume content of aluminum particles quite well. This present work intends to investigate, experimen- tally, the tensile and impact behavior of PP filled with iron ore tailings. Empirical data obtained from the tensile test will be compared with the Nielsen’s, Bigg’s and Ein- stein’s models. The effect of particle size which was not considered in Tavman’s work will also be considered. 2. Theory Among the challenges which particle reinforced plastics composites (PRPCs) present is the complexity of their mechanical behavior, particularly during plastic defor- mation. This makes it difficult to predict performance analytically and hence leads to conservative designs and extensive test programmes [8]. The tensile behavior of rigid particle reinforced com- posites is influenced by the particle size, filler concentra- tion, filler surface treatment, matrix and filler properties, superimposed pressure and the rate of strain. It is well established that the fracture of particulate composites is *Corresponding author. Copyright © 2012 SciRes. JMMCE 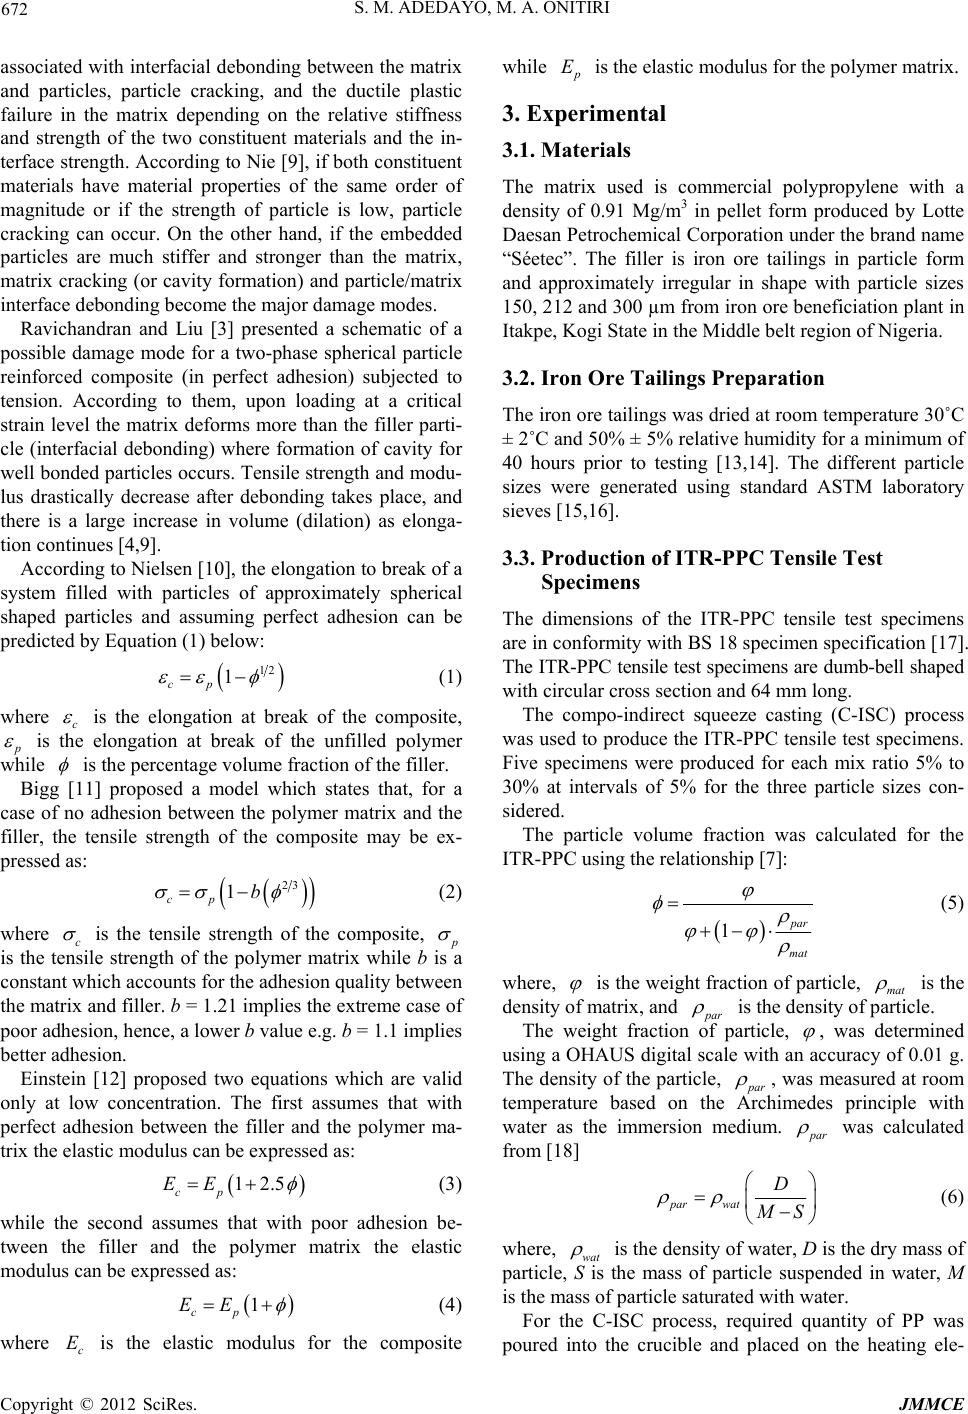 S. M. ADEDAYO, M. A. ONITIRI 672 associated with interfacial debonding between the matrix and particles, particle cracking, and the ductile plastic failure in the matrix depending on the relative stiffness and strength of the two constituent materials and the in- terface strength. According to Nie [9], if both constituent materials have material properties of the same order of magnitude or if the strength of particle is low, particle cracking can occur. On the other hand, if the embedded particles are much stiffer and stronger than the matrix, matrix cracking (or cavity formation) and particle/matrix interface debonding become the major damage modes. Ravichandran and Liu [3] presented a schematic of a possible damage mode for a two-phase spherical particle reinforced composite (in perfect adhesion) subjected to tension. According to them, upon loading at a critical strain level the matrix deforms more than the filler parti- cle (interfacial debonding) where formation of cavity for well bonded particles occurs. Tensile strength and modu- lus drastically decrease after debonding takes place, and there is a large increase in volume (dilation) as elonga- tion continues [4,9]. According to Nielsen [10], the elongation to break of a system filled with particles of approximately spherical shaped particles and assuming perfect adhesion can be predicted by Equation (1) below: 12 1 cp (1) where c is the elongation at break of the composite, p is the elongation at break of the unfilled polymer while is the percentage volume fraction of the filler. Bigg [11] proposed a model which states that, for a case of no adhesion between the polymer matrix and the filler, the tensile strength of the composite may be ex- pressed as: 23 1b cp (2) where c is the tensile strength of the composite, p is the tensile strength of the polymer matrix while b is a constant which accounts for the adhesion quality between the matrix and filler. b = 1.21 implies the extreme case of poor adhesion, hence, a lower b value e.g. b = 1.1 implies better adhesion. Einstein [12] proposed two equations which are valid only at low concentration. The first assumes that with perfect adhesion between the filler and the polymer ma- trix the elastic modulus can be expressed as: 12.5 cp EE (3) while the second assumes that with poor adhesion be- tween the filler and the polymer matrix the elastic modulus can be expressed as: 1 cp EE c E wh (4) where is the elastic modulus for the composite ile p E is the elastic modulus for the polymer matrix. 3. Experimental 3.1. Materials The matrix used is commercial polypropylene with a density of 0.91 Mg/m3 in pellet form produced by Lotte Daesan Petrochemical Corporation under the brand name “Séetec”. The filler is iron ore tailings in particle form and approximately irregular in shape with particle sizes 150, 212 and 300 µm from iron ore beneficiation plant in Itakpe, Kogi State in the Middle belt region of Nigeria. 3.2. Iron Ore Tailings Preparation The iron ore tailings was dried at room temperature 30˚C ± 2˚C and 50% ± 5% relative humidity for a minimum of 40 hours prior to testing [13,14]. The different particle sizes were generated using standard ASTM laboratory sieves [15,16]. 3.3. Production of ITR-PPC Tensile Test Specimens The dimensions of the ITR-PPC tensile test specimens are in conformity with BS 18 specimen specification [17]. The ITR-PPC tensile test specimens are dumb-bell shaped with circular cross section and 64 mm long. The compo-indirect squeeze casting (C-ISC) process was used to produce the ITR-PPC tensile test specimens. Five specimens were produced for each mix ratio 5% to 30% at intervals of 5% for the three particle sizes con- sidered. The particle volume fraction was calculated for the ITR-PPC using the relationship [7]: (5) p ar mat 1 is the weight fraction of particle, mat where, is the density of matrix, and p ar is the density of particle. The weight fraction of particle, , was determined using a OHAUS digital scale with an accuracy of 0.01 g. The density of the particle, p ar , was measured at room temperature based on the Archimedes principle with water as the immersion medium. p ar was calculated from [18] parwat D M S (6) where, wat is the density of water, D is the dry mass of particle, S is the mass of particle suspended in water, M is the mass of particle saturated with water. For the C-ISC process, required quantity of PP was poured into the crucible and placed on the heating ele- Copyright © 2012 SciRes. JMMCE 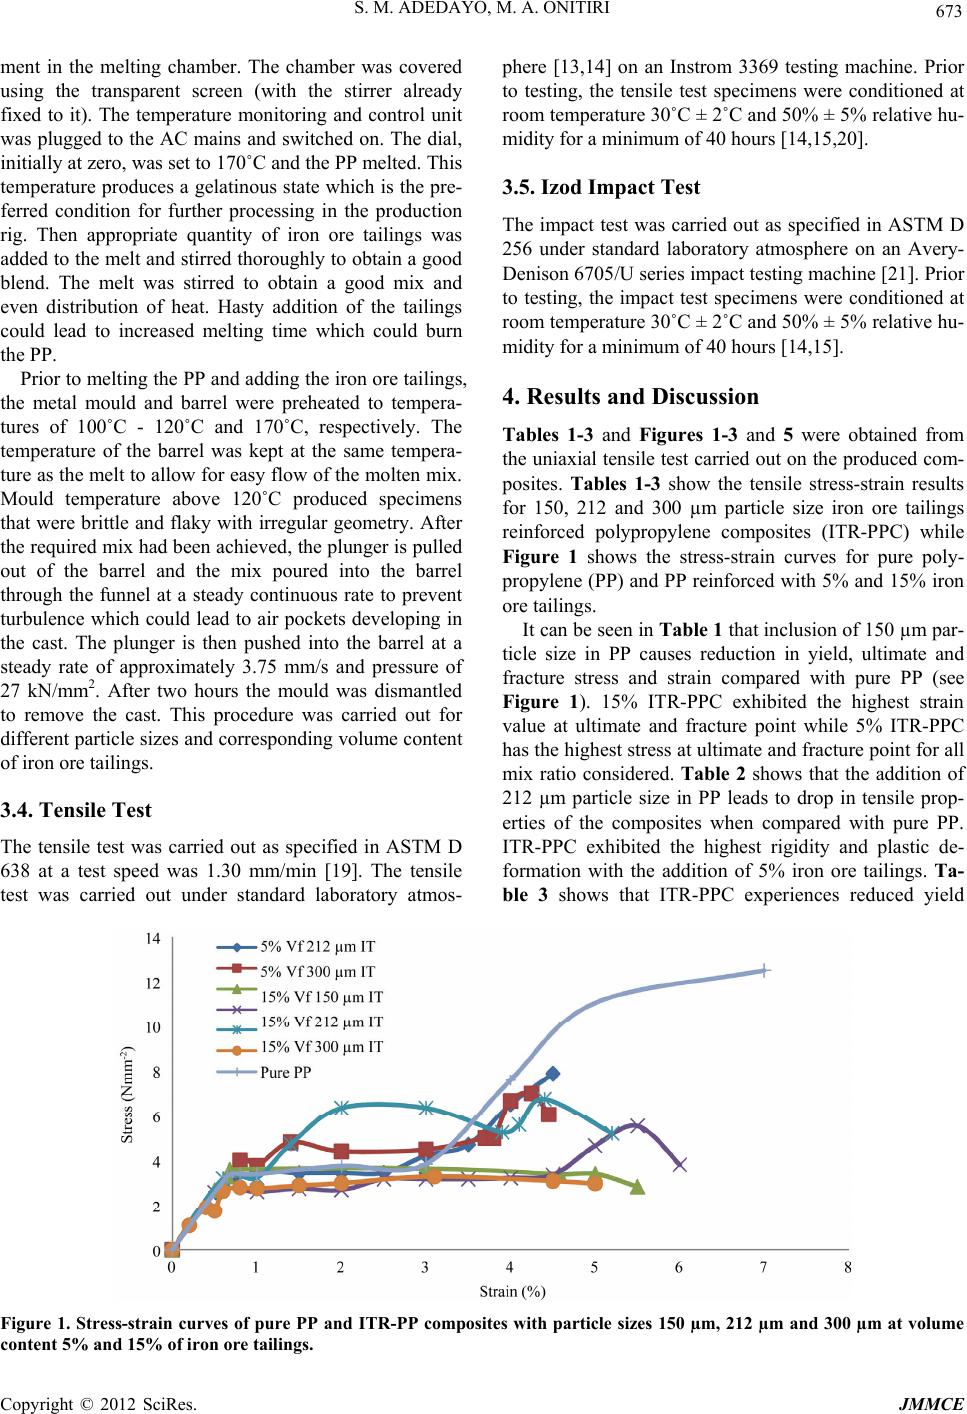 S. M. ADEDAYO, M. A. ONITIRI Copyright © 2012 SciRes. JMMCE 673 phere [13,14] on an Instrom 3369 testing machine. Prior to testing, the tensile test specimens were conditioned at room temperature 30˚C ± 2˚C and 50% ± 5% relative hu- midity for a minimum of 40 hours [14,15,20]. ment in the melting chamber. The chamber was covered using the transparent screen (with the stirrer already fixed to it). The temperature monitoring and control unit was plugged to the AC mains and switched on. The dial, initially at zero, was set to 170˚C and the PP melted. This temperature produces a gelatinous state which is the pre- ferred condition for further processing in the production rig. Then appropriate quantity of iron ore tailings was added to the melt and stirred thoroughly to obtain a good blend. The melt was stirred to obtain a good mix and even distribution of heat. Hasty addition of the tailings could lead to increased melting time which could burn the PP. 3.5. Izod Impact Test The impact test was carried out as specified in ASTM D 256 under standard laboratory atmosphere on an Avery- Denison 6705/U series impact testing machine [21]. Prior to testing, the impact test specimens were conditioned at room temperature 30˚C ± 2˚C and 50% ± 5% relative hu- midity for a minimum of 40 hours [14,15]. Prior to melting the PP and adding the iron ore tailings, the metal mould and barrel were preheated to tempera- tures of 100˚C - 120˚C and 170˚C, respectively. The temperature of the barrel was kept at the same tempera- ture as the melt to allow for easy flow of the molten mix. Mould temperature above 120˚C produced specimens that were brittle and flaky with irregular geometry. After the required mix had been achieved, the plunger is pulled out of the barrel and the mix poured into the barrel through the funnel at a steady continuous rate to prevent turbulence which could lead to air pockets developing in the cast. The plunger is then pushed into the barrel at a steady rate of approximately 3.75 mm/s and pressure of 27 kN/mm2. After two hours the mould was dismantled to remove the cast. This procedure was carried out for different particle sizes and corresponding volume content of iron ore tailings. 4. Results and Discussion Tables 1-3 and Figures 1-3 and 5 were obtained from the uniaxial tensile test carried out on the produced com- posites. Tables 1-3 show the tensile stress-strain results for 150, 212 and 300 µm particle size iron ore tailings reinforced polypropylene composites (ITR-PPC) while Figure 1 shows the stress-strain curves for pure poly- propylene (PP) and PP reinforced with 5% and 15% iron ore tailings. It can be seen in Table 1 that inclusion of 150 µm par- ticle size in PP causes reduction in yield, ultimate and fracture stress and strain compared with pure PP (see Figure 1). 15% ITR-PPC exhibited the highest strain value at ultimate and fracture point while 5% ITR-PPC has the highest stress at ultimate and fracture point for all mix ratio considered. Table 2 shows that the addition of 212 µm particle size in PP leads to drop in tensile prop- erties of the composites when compared with pure PP. ITR-PPC exhibited the highest rigidity and plastic de- formation with the addition of 5% iron ore tailings. Ta- ble 3 shows that ITR-PPC experiences reduced yield 3.4. Tensile Test The tensile test was carried out as specified in ASTM D 638 at a test speed was 1.30 mm/min [19]. The tensile test was carried out under standard laboratory atmos- Figure 1. Stress-strain curves of pure PP and ITR-PP composites with particle sizes 150 µm, 212 µm and 300 µm at volume content 5% and 15% of iron ore tailings. 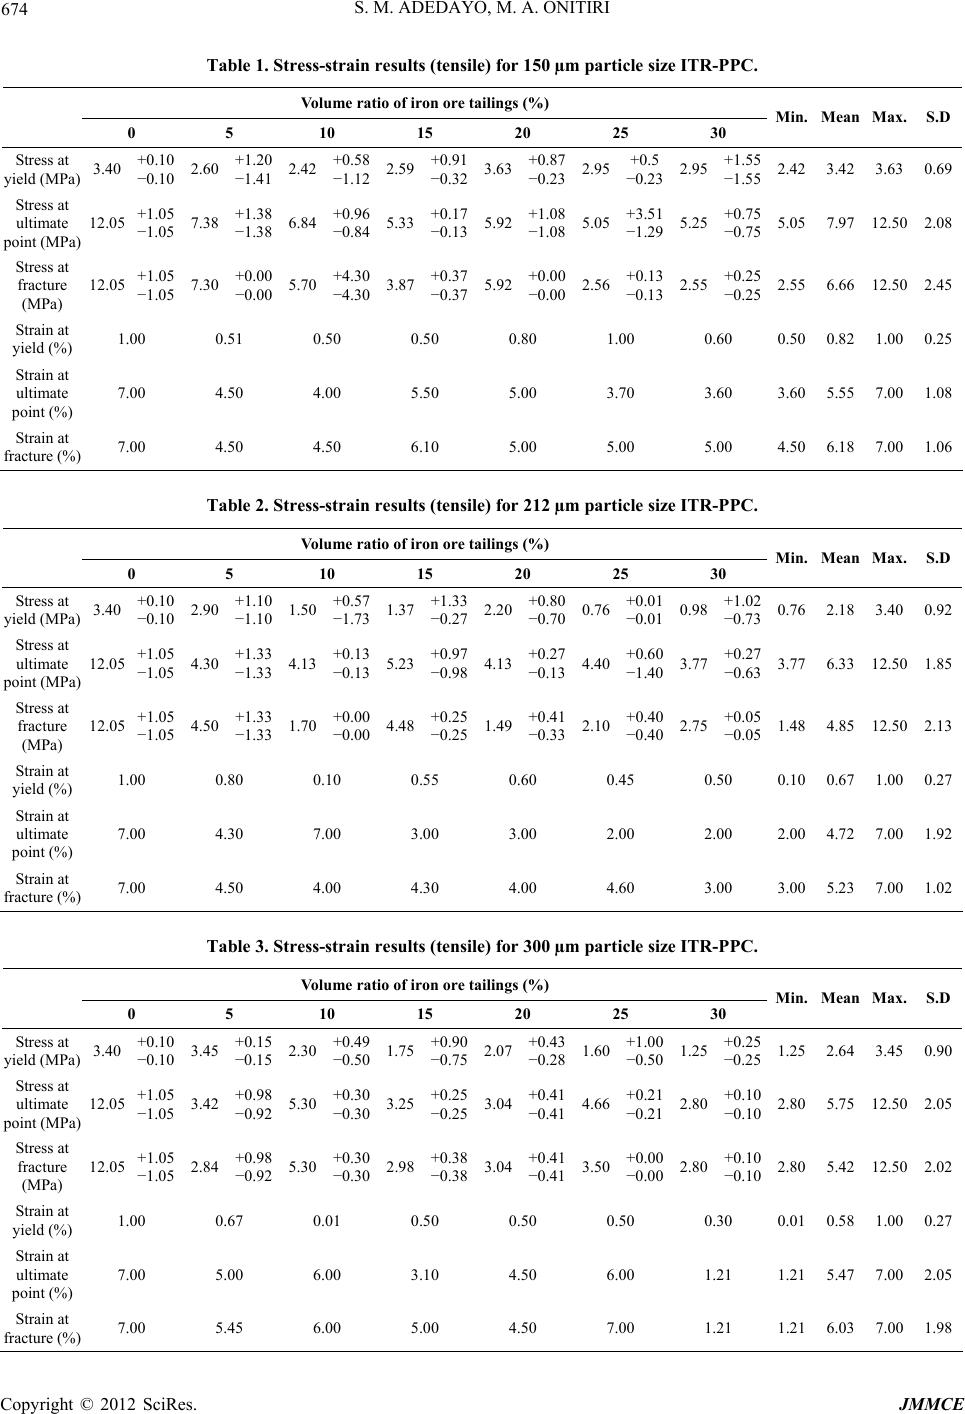 S. M. ADEDAYO, M. A. ONITIRI 674 Table 1. Stress-strain results (tensile) for 150 µm particle size ITR-PPC. Volume ratio of iron ore tailings (%) 0 5 10 15 20 25 30 Min. Mean Max.S.D Stress at yield (MPa) 3.40 +0.10 −0.10 2.60 +1.20 −1.41 2.42 +0.58 −1.12 2.59 +0.91 −0.32 3.63 +0.87 −0.23 2.95 +0.5 −0.23 2.95 +1.55 −1.55 2.42 3.42 3.63 0.69 Stress at ultimate point (MPa) 12.05 +1.05 −1.05 7.38 +1.38 −1.38 6.84 +0.96 −0.84 5.33 +0.17 −0.13 5.92 +1.08 −1.08 5.05 +3.51 −1.29 5.25 +0.75 −0.75 5.05 7.97 12.502.08 Stress at fracture (MPa) 12.05 +1.05 −1.05 7.30 +0.00 −0.00 5.70 +4.30 −4.30 3.87 +0.37 −0.37 5.92 +0.00 −0.00 2.56 +0.13 −0.13 2.55 +0.25 −0.25 2.55 6.66 12.502.45 Strain at yield (%) 1.00 0.51 0.50 0.50 0.80 1.00 0.60 0.50 0.82 1.000.25 Strain at ultimate point (%) 7.00 4.50 4.00 5.50 5.00 3.70 3.60 3.60 5.55 7.001.08 Strain at fracture (%) 7.00 4.50 4.50 6.10 5.00 5.00 5.00 4.50 6.18 7.001.06 Table 2. Stress-strain results (tensile) for 212 µm particle size ITR-PPC. Volume ratio of iron ore tailings (%) 0 5 10 15 20 25 30 Min. Mean Max.S.D Stress at yield (MPa) 3.40 +0.10 −0.10 2.90 +1.10 −1.10 1.50 +0.57 −1.73 1.37 +1.33 −0.27 2.20 +0.80 −0.70 0.76 +0.01 −0.01 0.98 +1.02 −0.73 0.76 2.18 3.40 0.92 Stress at ultimate point (MPa) 12.05 +1.05 −1.05 4.30 +1.33 −1.33 4.13 +0.13 −0.13 5.23 +0.97 −0.98 4.13 +0.27 −0.13 4.40 +0.60 −1.40 3.77 +0.27 −0.63 3.77 6.33 12.501.85 Stress at fracture (MPa) 12.05 +1.05 −1.05 4.50 +1.33 −1.33 1.70 +0.00 −0.00 4.48 +0.25 −0.25 1.49 +0.41 −0.33 2.10 +0.40 −0.40 2.75 +0.05 −0.05 1.48 4.85 12.502.13 Strain at yield (%) 1.00 0.80 0.10 0.55 0.60 0.45 0.50 0.10 0.67 1.000.27 Strain at ultimate point (%) 7.00 4.30 7.00 3.00 3.00 2.00 2.00 2.00 4.72 7.001.92 Strain at fracture (%) 7.00 4.50 4.00 4.30 4.00 4.60 3.00 3.00 5.23 7.001.02 Table 3. Stress-strain results (tensile) for 300 µm particle size ITR-PPC. Volume ratio of iron ore tailings (%) 0 5 10 15 20 25 30 Min. Mean Max.S.D Stress at yield (MPa) 3.40 +0.10 −0.10 3.45 +0.15 −0.15 2.30 +0.49 −0.50 1.75 +0.90 −0.75 2.07 +0.43 −0.28 1.60 +1.00 −0.50 1.25 +0.25 −0.25 1.25 2.64 3.45 0.90 Stress at ultimate point (MPa) 12.05 +1.05 −1.05 3.42 +0.98 −0.92 5.30 +0.30 −0.30 3.25 +0.25 −0.25 3.04 +0.41 −0.41 4.66 +0.21 −0.21 2.80 +0.10 −0.10 2.80 5.75 12.502.05 Stress at fracture (MPa) 12.05 +1.05 −1.05 2.84 +0.98 −0.92 5.30 +0.30 −0.30 2.98 +0.38 −0.38 3.04 +0.41 −0.41 3.50 +0.00 −0.00 2.80 +0.10 −0.10 2.80 5.42 12.502.02 Strain at yield (%) 1.00 0.67 0.01 0.50 0.50 0.50 0.30 0.01 0.58 1.000.27 Strain at ultimate point (%) 7.00 5.00 6.00 3.10 4.50 6.00 1.21 1.21 5.47 7.002.05 Strain at racture (%) 7.00 5.45 6.00 5.00 4.50 7.00 1.21 1.21 6.03 7.001.98 f Copyright © 2012 SciRes. JMMCE 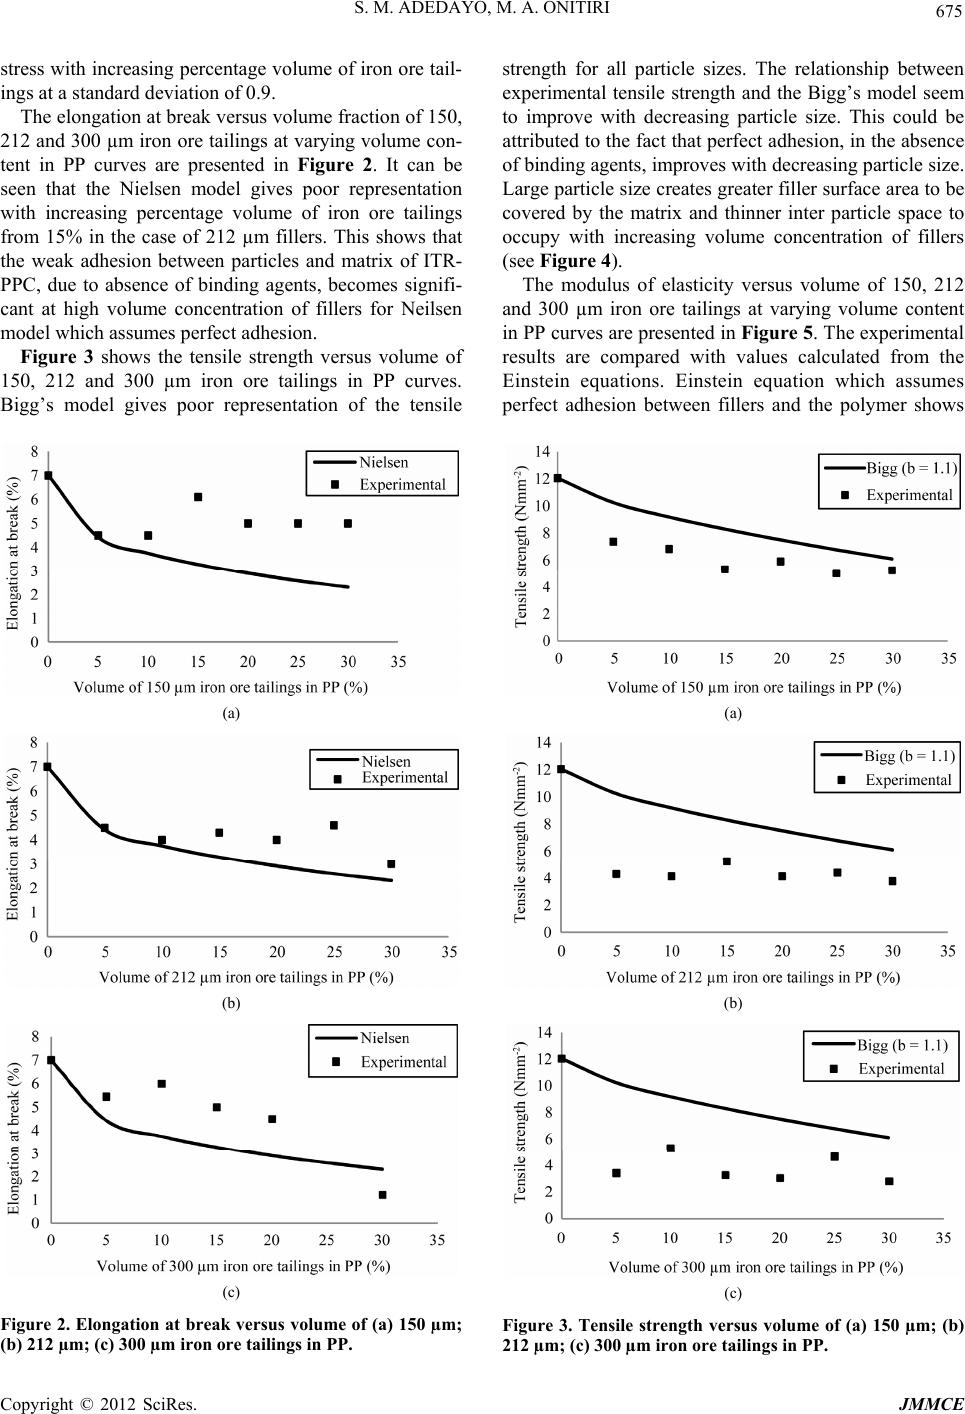 S. M. ADEDAYO, M. A. ONITIRI Copyright © 2012 SciRes. JMMCE 675 strength for all particle sizes. The relationship between experimental tensile strength and the Bigg’s model seem to improve with decreasing particle size. This could be attributed to the fact that perfect adhesion, in the absence of binding agents, improves with decreasing particle size. Large particle size creates greater filler surface area to be covered by the matrix and thinner inter particle space to occupy with increasing volume concentration of fillers (see Fi g u r e 4). stress with increasing percentage volume of iron ore tail- ings at a standard deviation of 0.9. The elongation at break versus volume fraction of 150, 212 and 300 µm iron ore tailings at varying volume con- tent in PP curves are presented in Figure 2. It can be seen that the Nielsen model gives poor representation with increasing percentage volume of iron ore tailings from 15% in the case of 212 µm fillers. This shows that the weak adhesion between particles and matrix of ITR- PPC, due to absence of binding agents, becomes signifi- cant at high volume concentration of fillers for Neilsen model which assumes perfect adhesion. The modulus of elasticity versus volume of 150, 212 and 300 µm iron ore tailings at varying volume content in PP curves are presented in Figure 5. The experimental results are compared with values calculated from the Einstein equations. Einstein equation which assumes perfect adhesion between fillers and the polymer shows Figure 3 shows the tensile strength versus volume of 150, 212 and 300 µm iron ore tailings in PP curves. Bigg’s model gives poor representation of the tensile (a) (a) (b) (b) (c) (c) Figure 2. Elongation at break versus volume of (a) 150 µm; (b) 212 µm; (c) 300 µm iron ore tailings in PP. Figure 3. Tensile strength versus volume of (a) 150 µm; (b) 212 µm; (c) 300 µm iron ore tailings in PP. 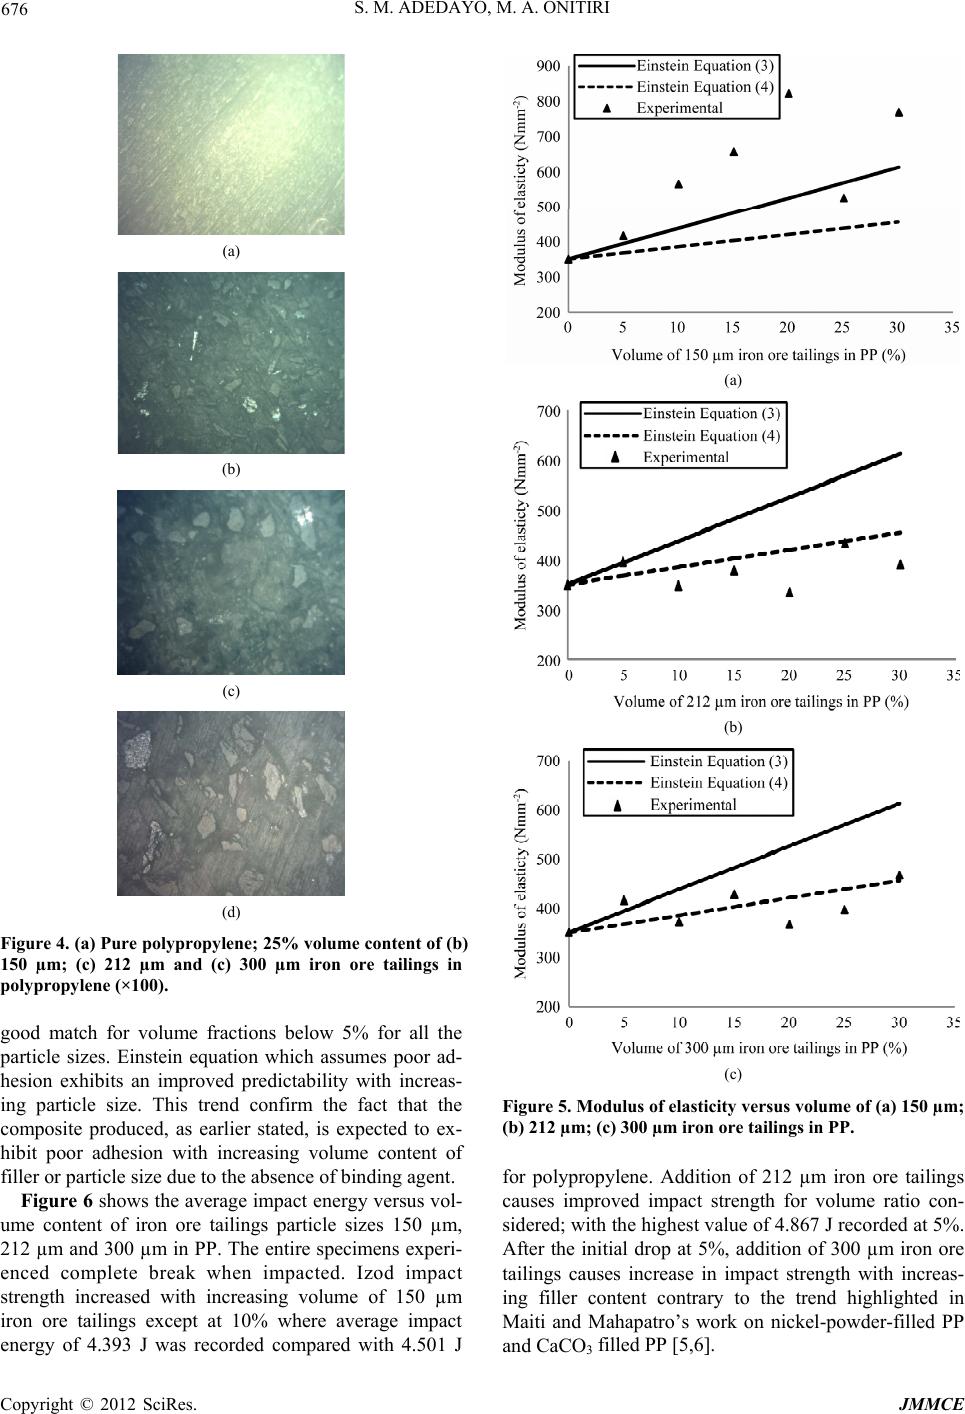 S. M. ADEDAYO, M. A. ONITIRI 676 (a) (b) (c) (d) Figure 4. (a) Pure polypropylene; 25% volume content of (b) 150 µm; (c) 212 µm and (c) 300 µm iron ore tailings in polypropylene (×100). good match for volume fractions below 5% for all the particle sizes. Einstein equation which assumes poor ad- hesion exhibits an improved predictability with increas- ing particle size. This trend confirm the fact that the composite produced, as earlier stated, is expected to ex- hibit poor adhesion with increasing volume content of filler or particle size due to the absence of binding agent. Figure 6 shows the average impact energy versus vol- ume content of iron ore tailings particle sizes 150 µm, 212 µm and 300 µm in PP. The entire specimens experi- enced complete break when impacted. Izod impact strength increased with increasing volume of 150 µm iron ore tailings except at 10% where average impact energy of 4.393 J was recorded compared with 4.501 J (a) (b) (c) Figure 5. Modulus of elasticity versus volume of (a) 150 µm; (b) 212 µm; (c) 300 µm iron ore tailings in PP. for polypropylene. Addition of 212 µm iron ore tailings causes improved impact strength for volume ratio con- sidered; with the highest value of 4.867 J recorded at 5%. After the initial drop at 5%, addition of 300 µm iron ore tailings causes increase in impact strength with increas- ing filler content contrary to the trend highlighted in Maiti and Mahapatro’s work on nickel-powder-filled PP and CaCO3 filled PP [5,6]. Copyright © 2012 SciRes. JMMCE 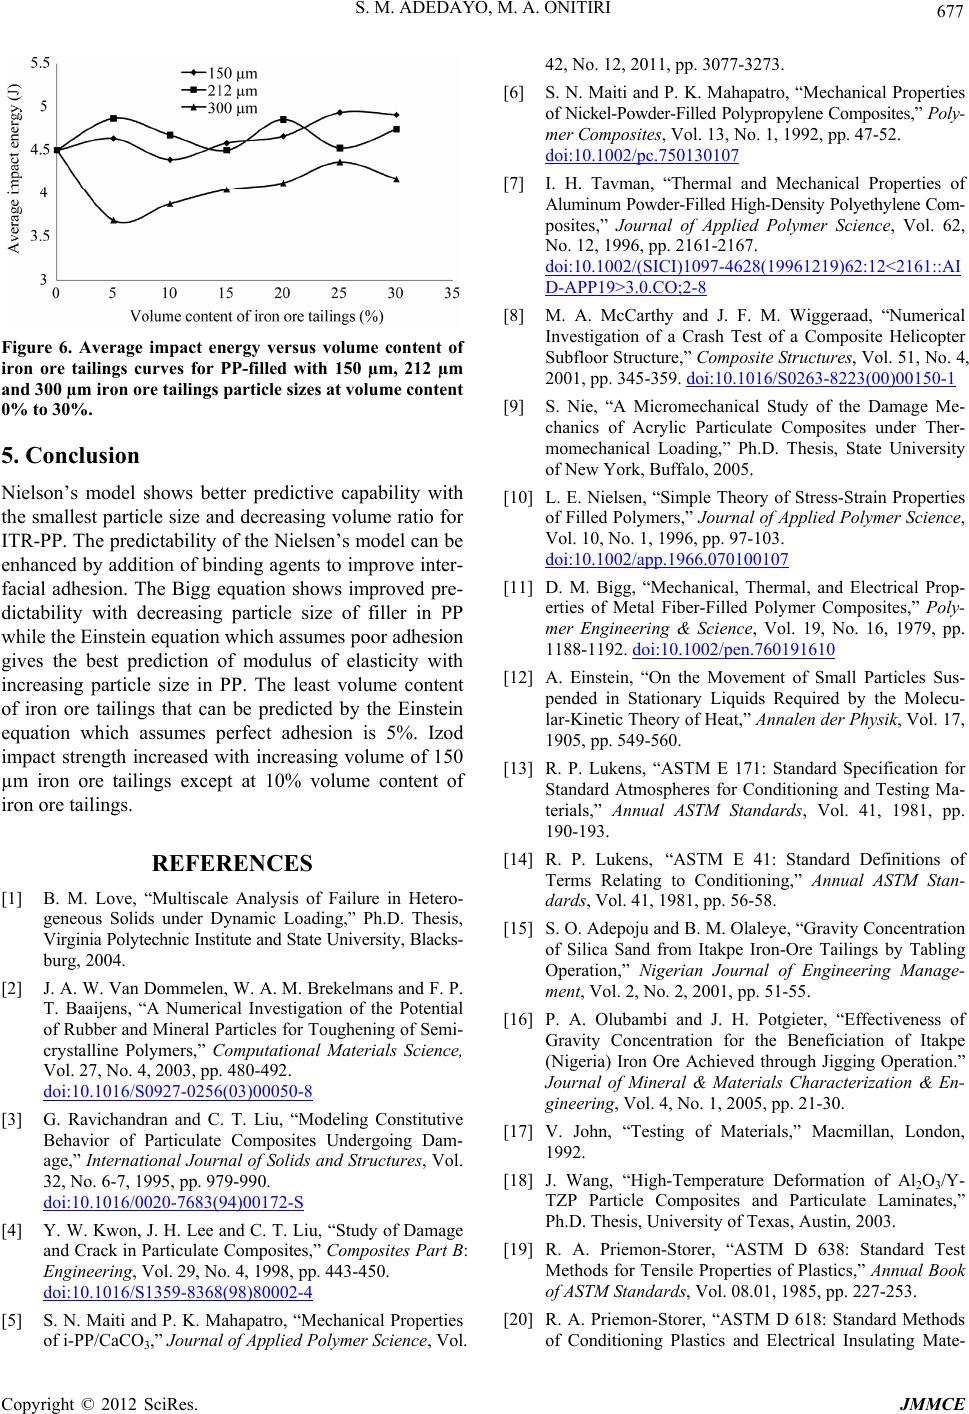 S. M. ADEDAYO, M. A. ONITIRI 677 Figure 6. Average impact energy versus volume content of iron ore tailings curves for PP-filled with 150 µm, 212 µm and 300 µm iron ore tailings particle sizes at volume content 0% to 30%. 5. Conclusion Nielson’s model shows better predictive capability with the smallest particle size and decreasing volume ratio for ITR-PP. The predictability of the Nielsen’s model can be enhanced by addition of binding agents to improve inter- facial adhesion. The Bigg equation shows improved pre- dictability with decreasing particle size of filler in PP while the Einstein equation which assumes poor adhesion gives the best prediction of modulus of elasticity with increasing particle size in PP. The least volume content of iron ore tailings that can be predicted by the Einstein equation which assumes perfect adhesion is 5%. Izod impact strength increased with increasing volume of 150 µm iron ore tailings except at 10% volume content of iron ore tailings. REFERENCES [1] B. M. Love, “Multiscale Analysis of Failure in Hetero- geneous Solids under Dynamic Loading,” Ph.D. Thesis, Virginia Polytechnic Institute and State University, Blacks- burg, 2004. [2] J. A. W. Van Dommelen, W. A. M. Brekelmans and F. P. T. Baaijens, “A Numerical Investigation of the Potential of Rubber and Mineral Particles for Toughening of Semi- crystalline Polymers,” Computational Materials Science, Vol. 27, No. 4, 2003, pp. 480-492. doi:10.1016/S0927-0256(03)00050-8 [3] G. Ravichandran and C. T. Liu, “Modeling Constitutive Behavior of Particulate Composites Undergoing Dam- age,” International Journal of Solids and Structures, Vol. 32, No. 6-7, 1995, pp. 979-990. doi:10.1016/0020-7683(94)00172-S [4] Y. W. Kwon, J. H. Lee and C. T. Liu, “Study of Damage and Crack in Particulate Composites,” Composites Part B: Engineering, Vol. 29, No. 4, 1998, pp. 443-450. doi:10.1016/S1359-8368(98)80002-4 [5] S. N. Maiti and P. K. Mahapatro, “Mechanical Properties of i-PP/CaCO3,” Journal of Applied Polymer Science, Vol. 42, No. 12, 2011, pp. 3077-3273. [6] S. N. Maiti and P. K. Mahapatro, “Mechanical Properties of Nickel-Powder-Filled Polypropylene Composites,” Poly- mer Composites, Vol. 13, No. 1, 1992, pp. 47-52. doi:10.1002/pc.750130107 [7] I. H. Tavman, “Thermal and Mechanical Properties of Aluminum Powder-Filled High-Density Polyethylene Com- posites,” Journal of Applied Polymer Science, Vol. 62, No. 12, 1996, pp. 2161-2167. doi:10.1002/(SICI)1097-4628(19961219)62:12<2161::AI D-APP19>3.0.CO;2-8 [8] M. A. McCarthy and J. F. M. Wiggeraad, “Numerical Investigation of a Crash Test of a Composite Helicopter Subfloor Structure,” Composite Structures, Vol. 51, No. 4, 2001, pp. 345-359. doi:10.1016/S0263-8223(00)00150-1 [9] S. Nie, “A Micromechanical Study of the Damage Me- chanics of Acrylic Particulate Composites under Ther- momechanical Loading,” Ph.D. Thesis, State University of New York, Buffalo, 2005. [10] L. E. Nielsen, “Simple Theory of Stress-Strain Properties of Filled Polymers,” Journal of Applied Polymer Science, Vol. 10, No. 1, 1996, pp. 97-103. doi:10.1002/app.1966.070100107 [11] D. M. Bigg, “Mechanical, Thermal, and Electrical Prop- erties of Metal Fiber-Filled Polymer Composites,” Poly- mer Engineering & Science, Vol. 19, No. 16, 1979, pp. 1188-1192. doi:10.1002/pen.760191610 [12] A. Einstein, “On the Movement of Small Particles Sus- pended in Stationary Liquids Required by the Molecu- lar-Kinetic Theory of Heat,” Annale n de r Phy sik, Vol. 17, 1905, pp. 549-560. [13] R. P. Lukens, “ASTM E 171: Standard Specification for Standard Atmospheres for Conditioning and Testing Ma- terials,” Annual ASTM Standards, Vol. 41, 1981, pp. 190-193. [14] R. P. Lukens, “ASTM E 41: Standard Definitions of Terms Relating to Conditioning,” Annual ASTM Stan- dards, Vol. 41, 1981, pp. 56-58. [15] S. O. Adepoju and B. M. Olaleye, “Gravity Concentration of Silica Sand from Itakpe Iron-Ore Tailings by Tabling Operation,” Nigerian Journal of Engineering Manage- ment, Vol. 2, No. 2, 2001, pp. 51-55. [16] P. A. Olubambi and J. H. Potgieter, “Effectiveness of Gravity Concentration for the Beneficiation of Itakpe (Nigeria) Iron Ore Achieved through Jigging Operation.” Journal of Mineral & Materials Characterization & En- gineering, Vol. 4, No. 1, 2005, pp. 21-30. [17] V. John, “Testing of Materials,” Macmillan, London, 1992. [18] J. Wang, “High-Temperature Deformation of Al2O3/Y- TZP Particle Composites and Particulate Laminates,” Ph.D. Thesis, University of Texas, Austin, 2003. [19] R. A. Priemon-Storer, “ASTM D 638: Standard Test Methods for Tensile Properties of Plastics,” Annual Book of ASTM Standards, Vol. 08.01, 1985, pp. 227-253. [20] R. A. Priemon-Storer, “ASTM D 618: Standard Methods of Conditioning Plastics and Electrical Insulating Mate- Copyright © 2012 SciRes. JMMCE 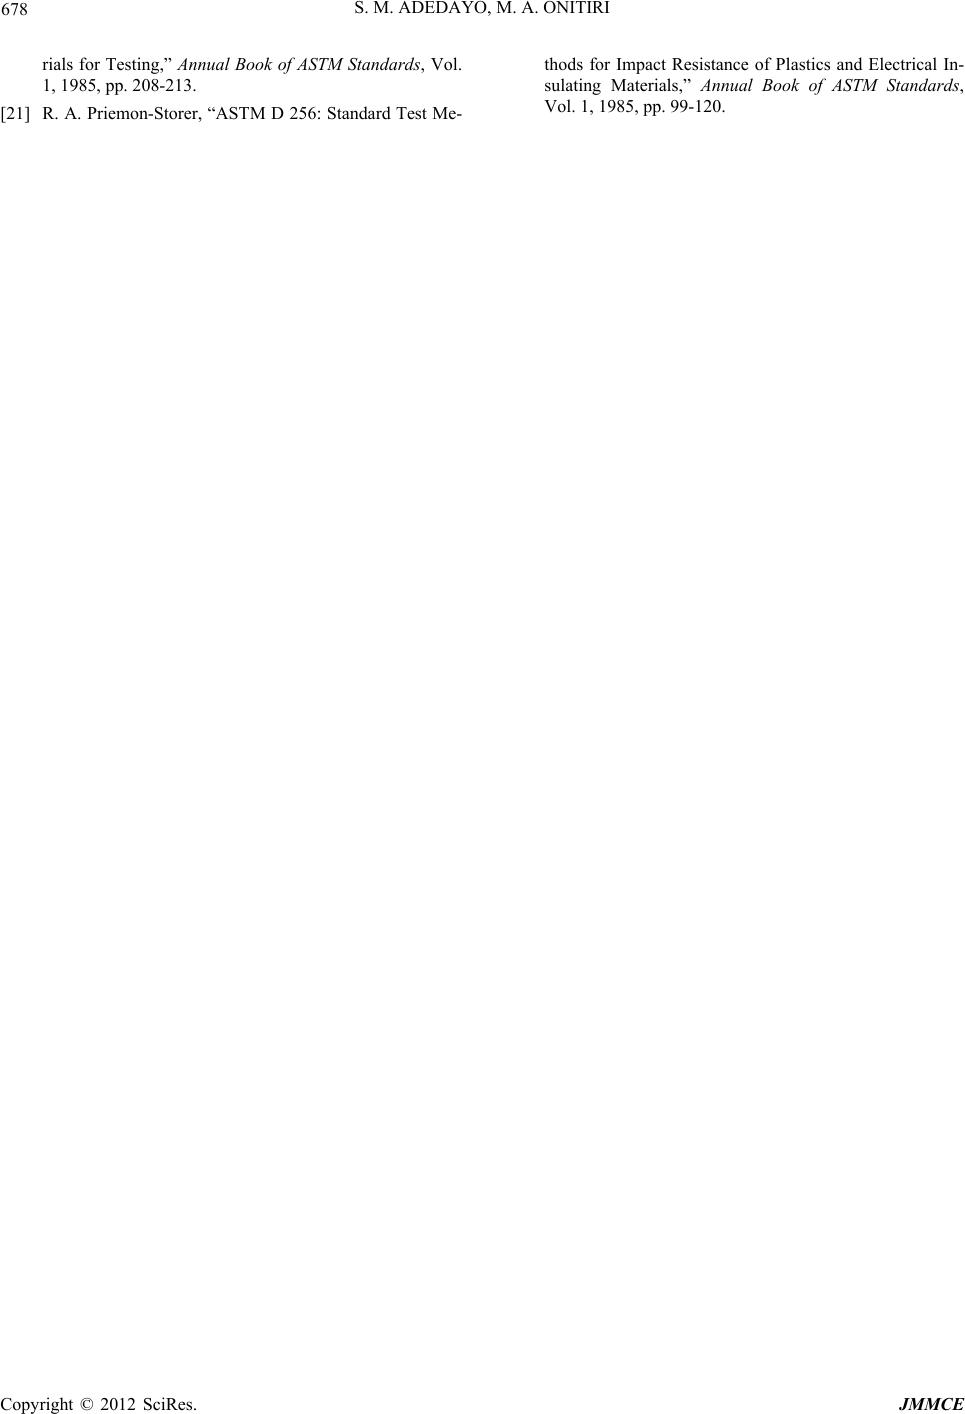 S. M. ADEDAYO, M. A. ONITIRI Copyright © 2012 SciRes. JMMCE 678 rials for Testing,” Annual Book of ASTM Standards, Vol. 1, 1985, pp. 208-213. [21] R. A. Priemon-Storer, “ASTM D 256: Standard Test Me- thods for Impact Resistance of Plastics and Electrical In- sulating Materials,” Annual Book of ASTM Standards, Vol. 1, 1985, pp. 99-120. |