

Paper Menu >>
Journal Menu >>
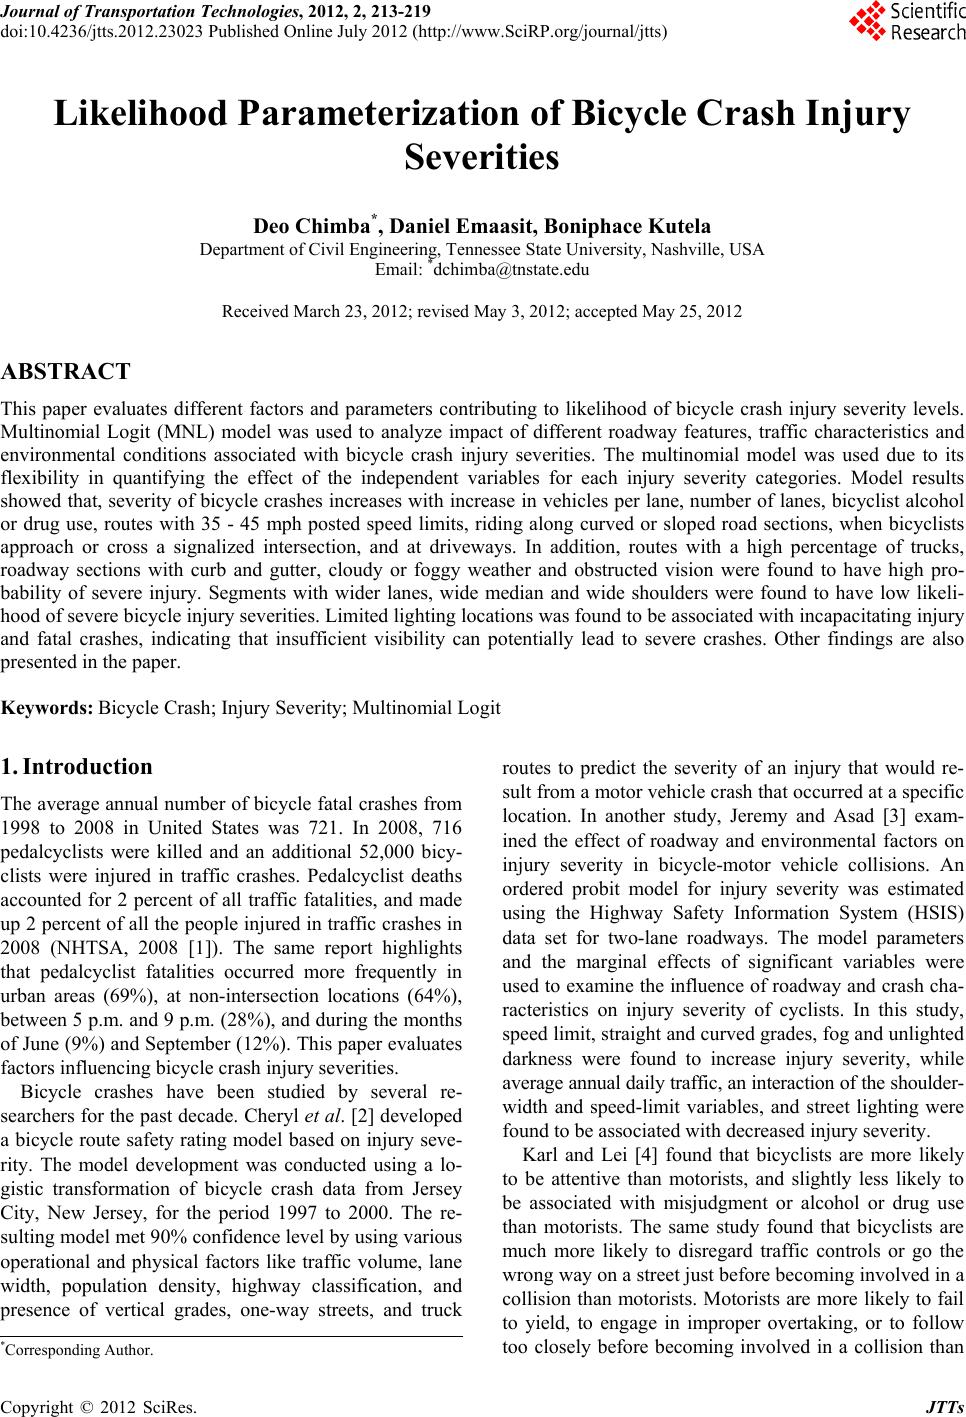 Journal of Transportation Technologies, 2012, 2, 213-219 doi:10.4236/jtts.2012.23023 Published Online July 2012 (http://www.SciRP.org/journal/jtts) Likelihood Parameterization of Bicycle Crash Injury Severities Deo Chimba*, Daniel Emaasit, Boniphace Kutela Department of Civil Engineering, Tennessee State University, Nashville, USA Email: *[email protected] Received March 23, 2012; revised May 3, 2012; accepted May 25, 2012 ABSTRACT This paper evaluates different factors and parameters contributing to likelihood of bicycle crash injury severity levels. Multinomial Logit (MNL) model was used to analyze impact of different roadway features, traffic characteristics and environmental conditions associated with bicycle crash injury severities. The multinomial model was used due to its flexibility in quantifying the effect of the independent variables for each injury severity categories. Model results showed that, severity of bicycle crashes increases with increase in vehicles per lane, number of lanes, bicyclist alcohol or drug use, routes with 35 - 45 mph posted speed limits, riding along curved or sloped road sections, when bicyclists approach or cross a signalized intersection, and at driveways. In addition, routes with a high percentage of trucks, roadway sections with curb and gutter, cloudy or foggy weather and obstructed vision were found to have high pro- bability of severe injury. Segments with wider lanes, wide median and wide shoulders were found to have low likeli- hood of severe bicycle injury severities. Limited lig hting locatio ns was found to be associated with in capacitatin g injury and fatal crashes, indicating that insufficient visibility can potentially lead to severe crashes. Other findings are also presented in the paper. Keywords: Bicycle Crash; Injury Severity; Multinomial Logit 1. Introduction The av erage annu al number o f bicycle fatal crashes from 1998 to 2008 in United States was 721. In 2008, 716 pedalcyclists were killed and an additional 52,000 bicy- clists were injured in traffic crashes. Pedalcyclist deaths accounted for 2 percent of all traffic fatalities, and made up 2 percent of all the people injured in traffic crashes in 2008 (NHTSA, 2008 [1]). The same report highlights that pedalcyclist fatalities occurred more frequently in urban areas (69%), at non-intersection locations (64%), between 5 p.m. and 9 p.m. (28%), and during the months of June (9%) and September (12%). This paper evaluates factors influencing bicycle crash injury severities. Bicycle crashes have been studied by several re- searchers for the past decade. Cheryl et al. [2] developed a bicycle route safety rating model based on injury seve- rity. The model development was conducted using a lo- gistic transformation of bicycle crash data from Jersey City, New Jersey, for the period 1997 to 2000. The re- sulting model met 90% confidence level by using various operational and physical factors like traffic volume, lane width, population density, highway classification, and presence of vertical grades, one-way streets, and truck routes to predict the severity of an injury that would re- sult from a motor vehicle crash that occurred at a specific location. In another study, Jeremy and Asad [3] exam- ined the effect of roadway and environmental factors on injury severity in bicycle-motor vehicle collisions. An ordered probit model for injury severity was estimated using the Highway Safety Information System (HSIS) data set for two-lane roadways. The model parameters and the marginal effects of significant variables were used to examine the influ ence of roadw ay and crash ch a- racteristics on injury severity of cyclists. In this study, speed limit, straight and curved grades, fog and unlighted darkness were found to increase injury severity, while average annual daily traffic, an interaction of the shoulder- width and speed-limit variables, and street lighting were found to be associated with decreased injury severity. Karl and Lei [4] found that bicyclists are more likely to be attentive than motorists, and slightly less likely to be associated with misjudgment or alcohol or drug use than motorists. The same study found that bicyclists are much more likely to disregard traffic controls or go the wrong way on a street just before becoming involved in a collision than motorists. Motorists are more likely to fail to yield, to engage in improper overtaking, or to follow too closely before becoming involved in a collision than *Corresponding Aut ho r. Copyright © 2012 SciRes. JTTs 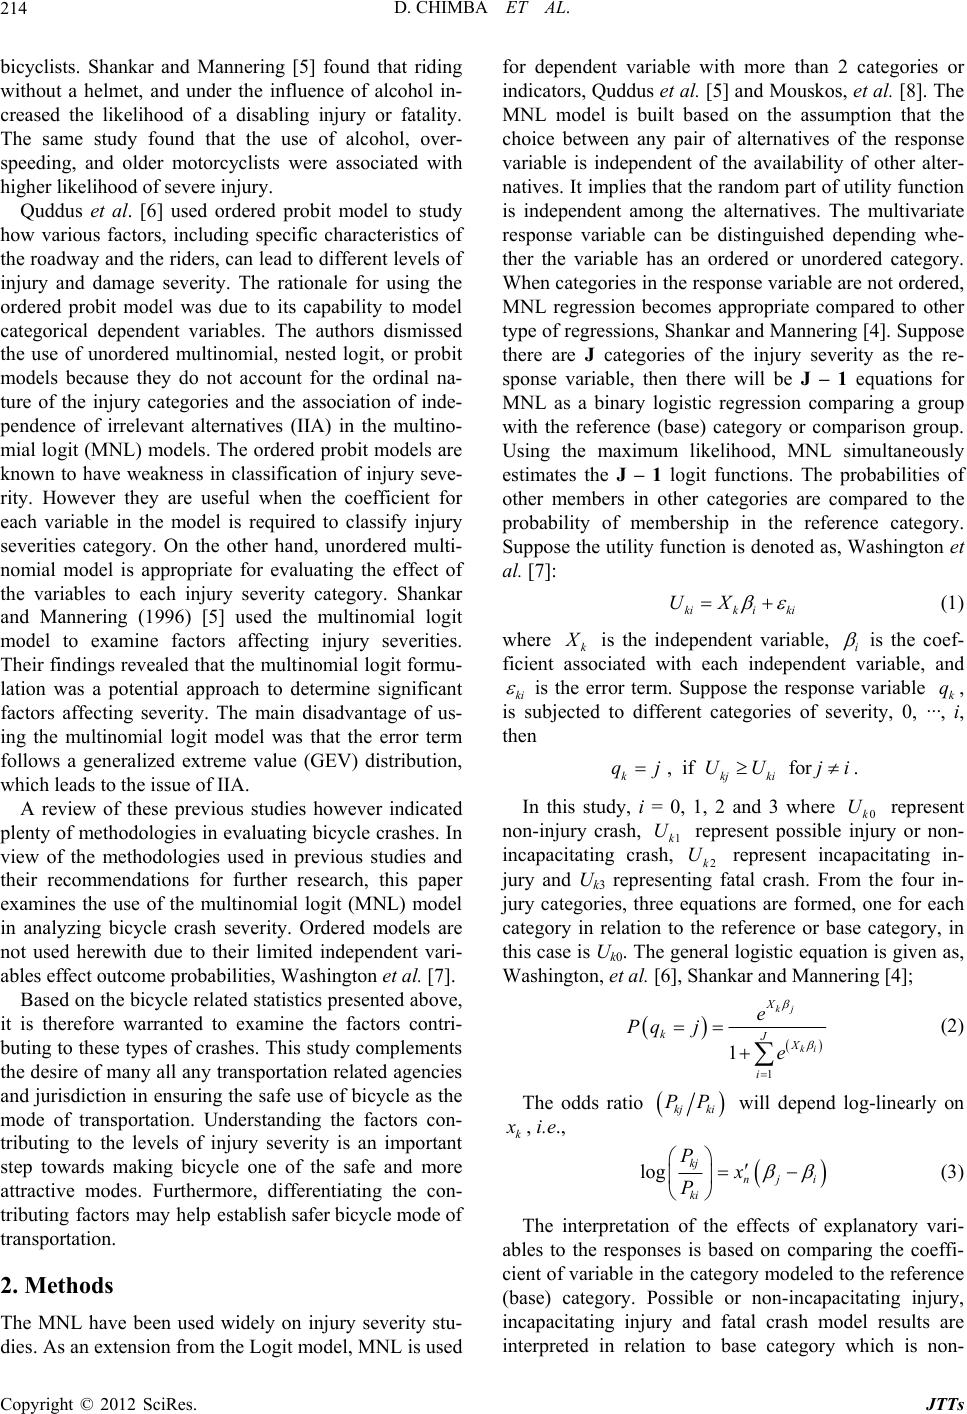 D. CHIMBA ET AL. 214 bicyclists. Shankar and Mannering [5] found that riding without a helmet, and under the influence of alcohol in- creased the likelihood of a disabling injury or fatality. The same study found that the use of alcohol, over- speeding, and older motorcyclists were associated with higher likelihoo d of severe injury. Quddus et al. [6] used ordered probit model to study how various factors, including specific characteristics of the roadway and th e riders, can lead to different levels of injury and damage severity. The rationale for using the ordered probit model was due to its capability to model categorical dependent variables. The authors dismissed the use of unordered multinomial, nested logit, or probit models because they do not account for the ordinal na- ture of the injury categories and the association of inde- pendence of irrelevant alternatives (IIA) in the multino- mial logit (MNL) models. The ordered probit models are known to have weakness in classification of injury seve- rity. However they are useful when the coefficient for each variable in the model is required to classify injury severities category. On the other hand, unordered multi- nomial model is appropriate for evaluating the effect of the variables to each injury severity category. Shankar and Mannering (1996) [5] used the multinomial logit model to examine factors affecting injury severities. Their findings revealed that the multinomial logit formu- lation was a potential approach to determine significant factors affecting severity. The main disadvantage of us- ing the multinomial logit model was that the error term follows a generalized extreme value (GEV) distribution, which leads to the issue of IIA. A review of these previous studies however indicated plenty of methodolog ies in evaluating bicycle crashes. In view of the methodologies used in previous studies and their recommendations for further research, this paper examines the use of the multinomial logit (MNL) model in analyzing bicycle crash severity. Ordered models are not used herewith due to their limited independent vari- ables effect outcome probabilities, Washington et al. [7]. Based on the bicycle related statistics presented above, it is therefore warranted to examine the factors contri- buting to these types of crashes. Th is study complements the desire of many all any tran sportation related agencies and jurisdiction in ensuring the safe use of bicycle as the mode of transportation. Understanding the factors con- tributing to the levels of injury severity is an important step towards making bicycle one of the safe and more attractive modes. Furthermore, differentiating the con- tributing factors may help establish safer bicycle mode of transportation. 2. Methods The MNL have been used widely on injury severity stu- dies. As an extension from the Logit model, MNL is used for dependent variable with more than 2 categories or indicators, Quddus et al. [5] and Mouskos, et al. [8]. The MNL model is built based on the assumption that the choice between any pair of alternatives of the response variable is independent of the availability of other alter- natives. It implies that the random part of utility function is independent among the alternatives. The multivariate response variable can be distinguished depending whe- ther the variable has an ordered or unordered category. When categories in the response variable are not ordered, MNL regression becomes appropriate compared to other type of regressio ns, Shankar and Mann ering [4]. Su ppose there are J categories of the injury severity as the re- sponse variable, then there will be J – 1 equations for MNL as a binary logistic regression comparing a group with the reference (base) category or comparison group. Using the maximum likelihood, MNL simultaneously estimates the J – 1 logit functions. The probabilities of other members in other categories are compared to the probability of membership in the reference category. Suppose the utility functio n is denoted as, Washington et al. [7]: kik iki UX (1) where k X is the independent variable, i is the coef- ficient associated with each independent variable, and ki is the error term. Suppose the response variable k, is subjected to different categories of severity, 0, ···, i, then q , if for kkjki qj UUji . In this study, i = 0, 1, 2 and 3 where 0k represent non-injury crash, 1k represent possible injury or non- incapacitating crash, 2k U represent incapacitating in- jury and Uk3 representing fatal crash. From the four in- jury categories, three equations are formed, one for each category in relation to the reference or base category, in this case is Uk0. The general logistic equation is given as, Washington, et al. [6], Shankar and Mannering [4]; U U 1 1 kj ki X kJX i e Pq j e (2) The odds ratio kj ki PP will depend log-linearly on k x , i.e., log kj nj i ki Px P (3) The interpretation of the effects of explanatory vari- ables to the responses is based on comparing the coeffi- cient of variable in the category modeled to the reference (base) category. Possible or non-incapacitating injury, incapacitating injury and fatal crash model results are interpreted in relation to base category which is non- Copyright © 2012 SciRes. JTTs 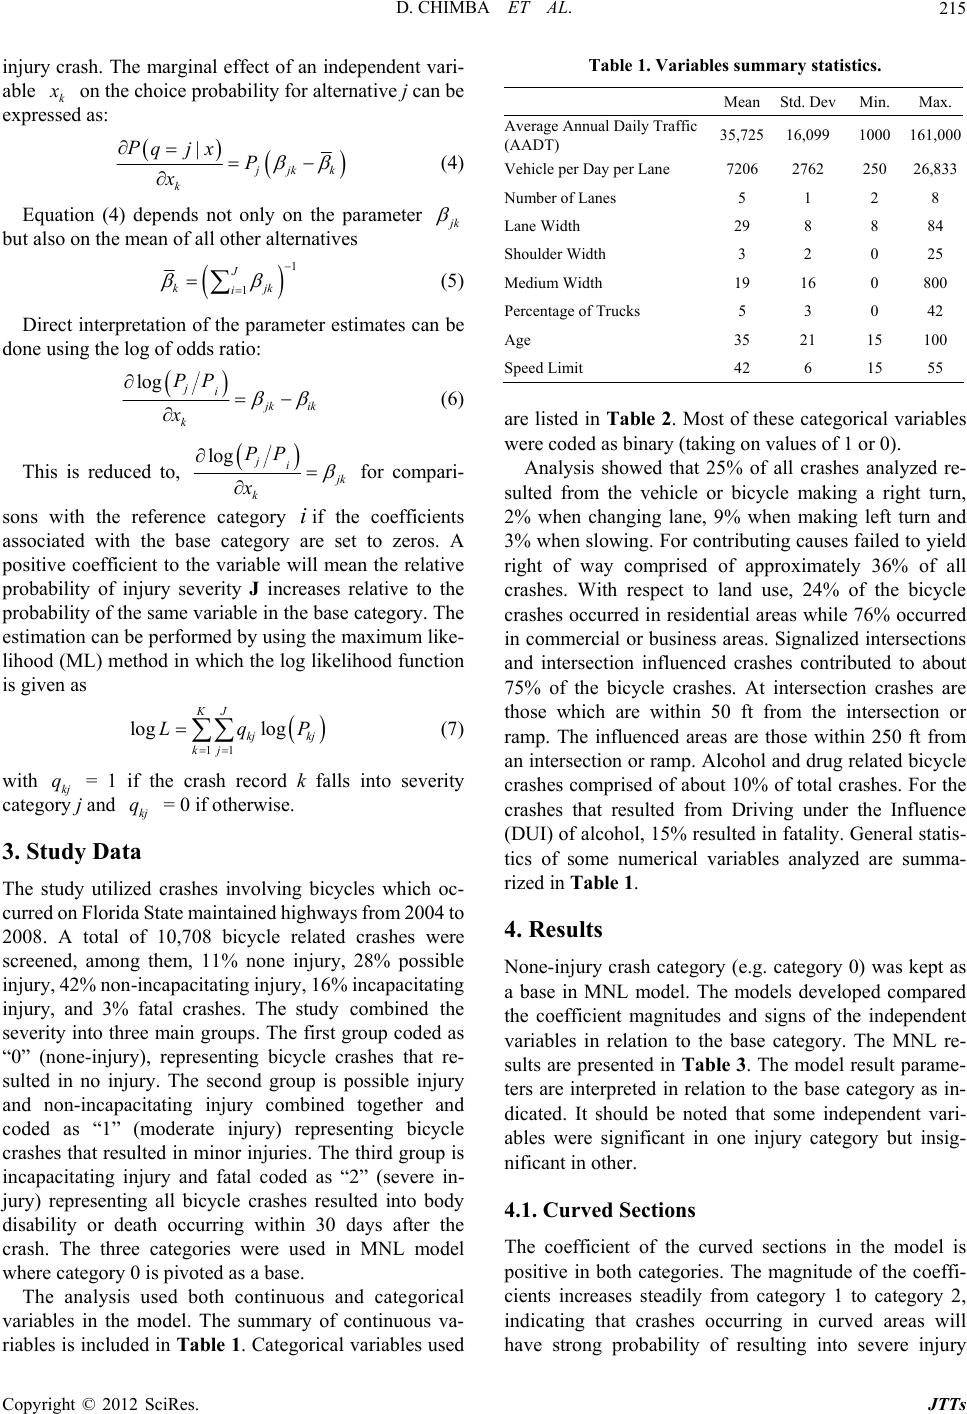 D. CHIMBA ET AL. 215 injury crash. The marginal effect of an independent vari- able k x on the choice probability for alternativ e j can be expressed as: | j jk k k Pqjx P x (4) Equation (4) depends not only on the parameter j k but also on the mean of all other alternatives 1 1 J k i j k (5) Direct interpretation of the parameter estimates can be done usi ng the log of odds ratio: log ji j ki k PP xk (6) This is reduced to, log ji j k k PP x for compari- sons with the reference category iif the coefficients associated with the base category are set to zeros. A positive coefficient to the variable will mean the relative probability of injury severity J increases relative to the probability of the same variable in the base categ ory. The estimation can be performed by using the maximum like- lihood (ML) method in which th e log likelihood function is given as 11 log log KJ kj kj kj LqP (7) with kj = 1 if the crash record k falls into severity category j and = 0 if otherwise. q kj q 3. Study Data The study utilized crashes involving bicycles which oc- curred on Florida State maintained highway s from 2004 t o 2008. A total of 10,708 bicycle related crashes were screened, among them, 11% none injury, 28% possible injury, 42% non-incapacitating injury, 16% incapacitating injury, and 3% fatal crashes. The study combined the severity into three main groups. The first group coded as “0” (none-injury), representing bicycle crashes that re- sulted in no injury. The second group is possible injury and non-incapacitating injury combined together and coded as “1” (moderate injury) representing bicycle crashes that resulted in minor injuries. The third group is incapacitating injury and fatal coded as “2” (severe in- jury) representing all bicycle crashes resulted into body disability or death occurring within 30 days after the crash. The three categories were used in MNL model where category 0 is pivoted as a base. The analysis used both continuous and categorical variables in the model. The summary of continuous va- riables is included in Tab le 1. Categorical variables used Table 1. Variables summary statistics. Mean Std. Dev Min. Max. Average Annual Daily Traffic (AADT) 35,725 16,099 1000 161,000 Vehicle per Day per Lane 7206 2762 250 26,833 Number of Lanes 5 1 2 8 Lane Width 29 8 8 84 Shoulder Width 3 2 0 25 Medium Width 19 16 0 800 Percentage of Trucks 5 3 0 42 Age 35 21 15 100 Speed Limit 42 6 15 55 are listed in Table 2. Most of these categorical variables were coded as binary (taking on values of 1 or 0). Analysis showed that 25% of all crashes analyzed re- sulted from the vehicle or bicycle making a right turn, 2% when changing lane, 9% when making left turn and 3% when slowing. For contributing causes failed to yield right of way comprised of approximately 36% of all crashes. With respect to land use, 24% of the bicycle crashes occurred in residential areas while 76% occurred in commercial or business areas. Signalized intersections and intersection influenced crashes contributed to about 75% of the bicycle crashes. At intersection crashes are those which are within 50 ft from the intersection or ramp. The influenced areas are those within 250 ft from an intersection or ramp. Alcohol and drug related bicycle crashes comprised of about 10% of total crashes. For the crashes that resulted from Driving under the Influence (DUI) of alcohol, 15% resulted in fatality. General statis- tics of some numerical variables analyzed are summa- rized in Table 1. 4. Results None-injury crash category (e.g. category 0) was kept as a base in MNL model. The models developed compared the coefficient magnitudes and signs of the independent variables in relation to the base category. The MNL re- sults are presented in Ta ble 3. The model result p arame- ters are interpreted in relation to the base category as in- dicated. It should be noted that some independent vari- ables were significant in one injury category but insig- nificant in other. 4.1. Curved Sections The coefficient of the curved sections in the model is positive in both categories. The magnitude of the coeffi- cients increases steadily from category 1 to category 2, indicating that crashes occurring in curved areas will have strong probability of resulting into severe injury Copyright © 2012 SciRes. JTTs 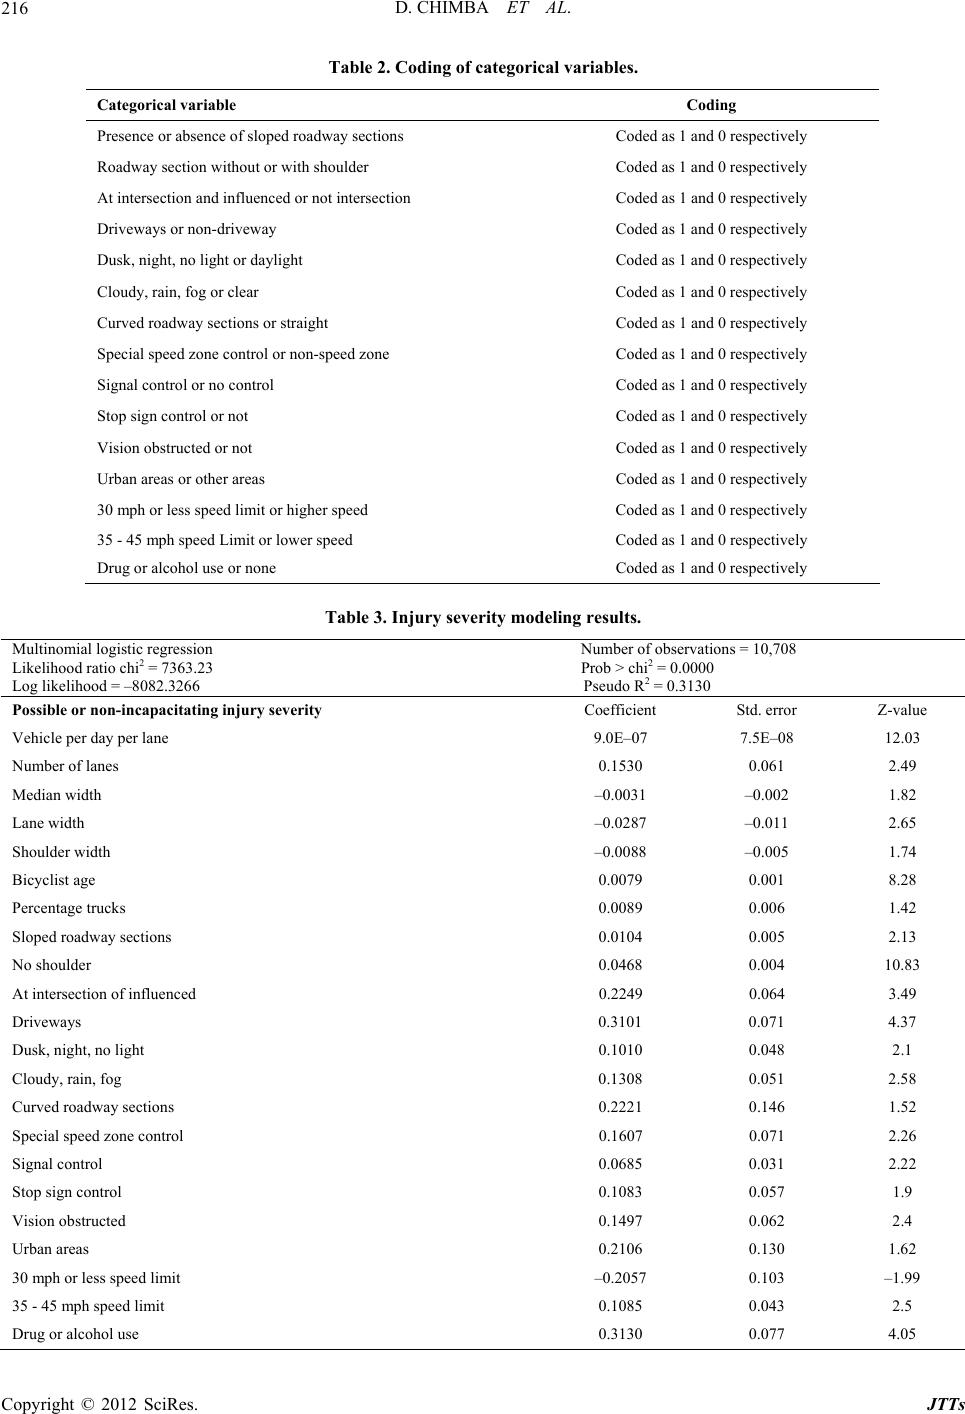 D. CHIMBA ET AL. Copyright © 2012 SciRes. JTTs 216 Table 2. Coding of categorical variables. Categorical variable Coding Presence or absence of sloped roadway sections Coded as 1 and 0 respectively Roadway section without or with shoulder Coded as 1 and 0 respectively At intersection and influenced or not intersection Coded as 1 and 0 respectively Driveways or non-driveway Coded as 1 and 0 respectively Dusk, night, no light or dayli ght Coded as 1 and 0 respectively Cloudy, rai n, fog or clear Coded as 1 and 0 re spectively Curved roadway sections or straight Coded as 1 and 0 respectively Special speed zone control or non-speed zone Coded as 1 and 0 respectively Signal control or no control Coded as 1 and 0 respectively Stop sign control or not Coded as 1 and 0 respectively Vision obstructed or not Coded as 1 and 0 respectively Urban areas or other areas Coded as 1 and 0 respectively 30 mph or less speed limi t or higher speed Coded as 1 and 0 respectively 35 - 45 mph spe e d Limit or lower sp e ed Coded as 1 and 0 respectivel y Drug or alcohol use or none Coded as 1 and 0 respectively Table 3. Injury severity modeling results. Multinomial logistic regression Number of observations = 10,708 Likelihood ratio chi2 = 7363.23 Prob > chi2 = 0.0000 Log likelihood = –8082.3266 Pseudo R2 = 0.3130 Possible or non-incapacitating injury severity Coefficient Std. error Z-value Vehicle per day per lane 9.0E–07 7.5E–08 12.03 Number of lanes 0.1530 0.061 2.49 Median width –0.0031 –0.002 1.82 Lane width –0.0287 –0.011 2.65 Shoulder width –0.0088 –0.005 1.74 Bicyclist age 0.0079 0.001 8.28 Percentage trucks 0.0089 0.006 1.42 Sloped roadway sections 0.0104 0.005 2.13 No shoulder 0.0468 0.004 10.83 At intersection of influ e n c ed 0.2249 0.064 3.49 Driveways 0.3101 0.071 4.37 Dusk, night, no lig ht 0.1010 0.048 2.1 Cloudy, rain, f og 0.1308 0.051 2.58 Curved roadway sections 0.2221 0.146 1.52 Special speed zone control 0.1607 0.071 2.26 Signal control 0.0685 0.031 2.22 Stop sign control 0.1083 0.057 1.9 Vision obstructed 0.1497 0.062 2.4 Urban areas 0 .2106 0.130 1.62 30 mph or less speed li mit –0.2057 0.103 –1.99 35 - 45 mph speed limit 0.1085 0.043 2.5 Drug or alcohol use 0.3130 0.077 4.05 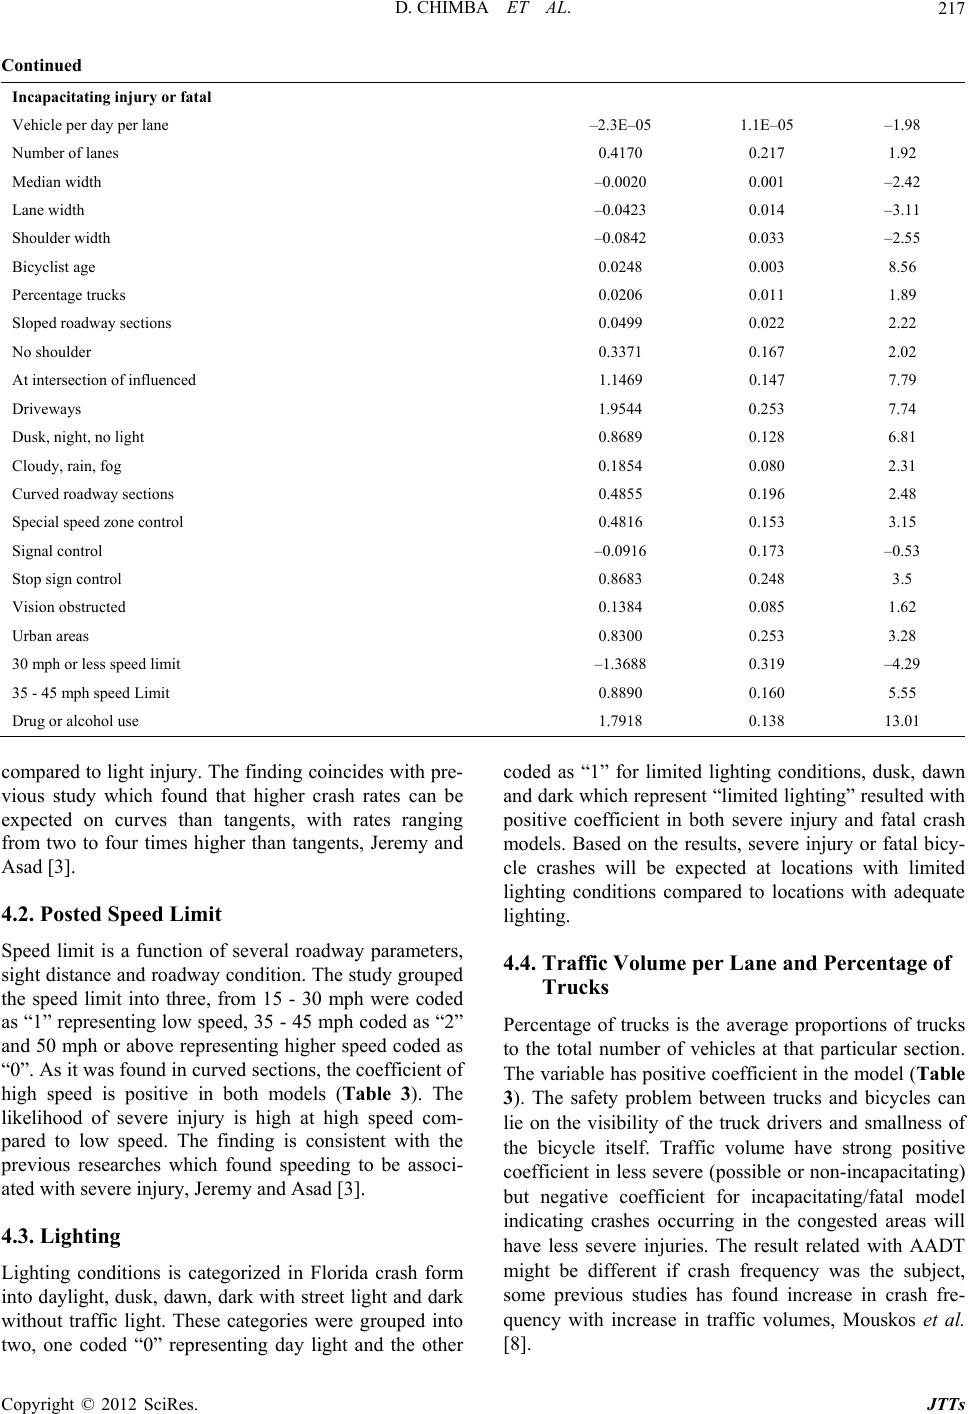 D. CHIMBA ET AL. 217 Continued Incapacitating injury or fatal Vehicle per day per lane –2.3E–05 1.1E–05 –1.98 Number of lanes 0.4170 0.217 1.92 Median width –0.0020 0.001 –2.42 Lane width –0.0423 0.014 –3.11 Shoulder width –0.0842 0.033 –2.55 Bicyclist age 0.0248 0.003 8.56 Percentage trucks 0.0206 0.011 1.89 Sloped roadway sections 0.0499 0.022 2.22 No shoulder 0.3371 0.167 2.02 At intersection of influ e n c ed 1.1469 0.147 7.79 Driveways 1.9544 0.253 7.74 Dusk, night, no lig ht 0.8689 0.128 6.81 Cloudy, rain, f og 0.1854 0.080 2.31 Curved roadway sections 0.4855 0.196 2.48 Special speed zone control 0.4816 0.153 3.15 Signal control –0.0916 0.173 –0.53 Stop sign control 0.8683 0.248 3.5 Vision obstructed 0.1384 0.085 1.62 Urban areas 0 .8300 0.253 3.28 30 mph or less speed li mit –1.3688 0.319 –4.29 35 - 45 mph speed Limit 0.8890 0.160 5.55 Drug or alcohol use 1.7918 0.138 13.01 compared to light injury. The find ing coincides with pre- vious study which found that higher crash rates can be expected on curves than tangents, with rates ranging from two to four times higher than tangents, Jeremy and Asad [3]. 4.2. Posted Speed Limit Speed limit is a function of several roadway parameters, sight distance and roadway co ndition. The study group ed the speed limit into three, from 15 - 30 mph were coded as “1” representing low speed, 35 - 45 mph coded as “2” and 50 mph or above represen ting higher speed coded as “0”. As it was found in curved sections, the coefficient of high speed is positive in both models (Table 3). The likelihood of severe injury is high at high speed com- pared to low speed. The finding is consistent with the previous researches which found speeding to be associ- ated with severe injury, Jeremy and Asad [3]. 4.3. Lighting Lighting conditions is categorized in Florida crash form into daylight, dusk, dawn, dark with street light and dark without traffic light. These categories were grouped into two, one coded “0” representing day light and the other coded as “1” for limited lighting conditions, dusk, dawn and dark which represent “limited lighting” resulted with positive coefficient in both severe injury and fatal crash models. Based on the results, severe injury or fatal bicy- cle crashes will be expected at locations with limited lighting conditions compared to locations with adequate lighting. 4.4. Traffic Volume per Lane and Percentage of Trucks Percentage of trucks is the average proportions of trucks to the total number of vehicles at that particular section. The variable has positiv e coefficient in the model (Table 3). The safety problem between trucks and bicycles can lie on the visibility of the truck drivers and smallness of the bicycle itself. Traffic volume have strong positive coefficient in less severe (possible or non-incapacitating) but negative coefficient for incapacitating/fatal model indicating crashes occurring in the congested areas will have less severe injuries. The result related with AADT might be different if crash frequency was the subject, some previous studies has found increase in crash fre- quency with increase in traffic volumes, Mouskos et al. [8]. Copyright © 2012 SciRes. JTTs 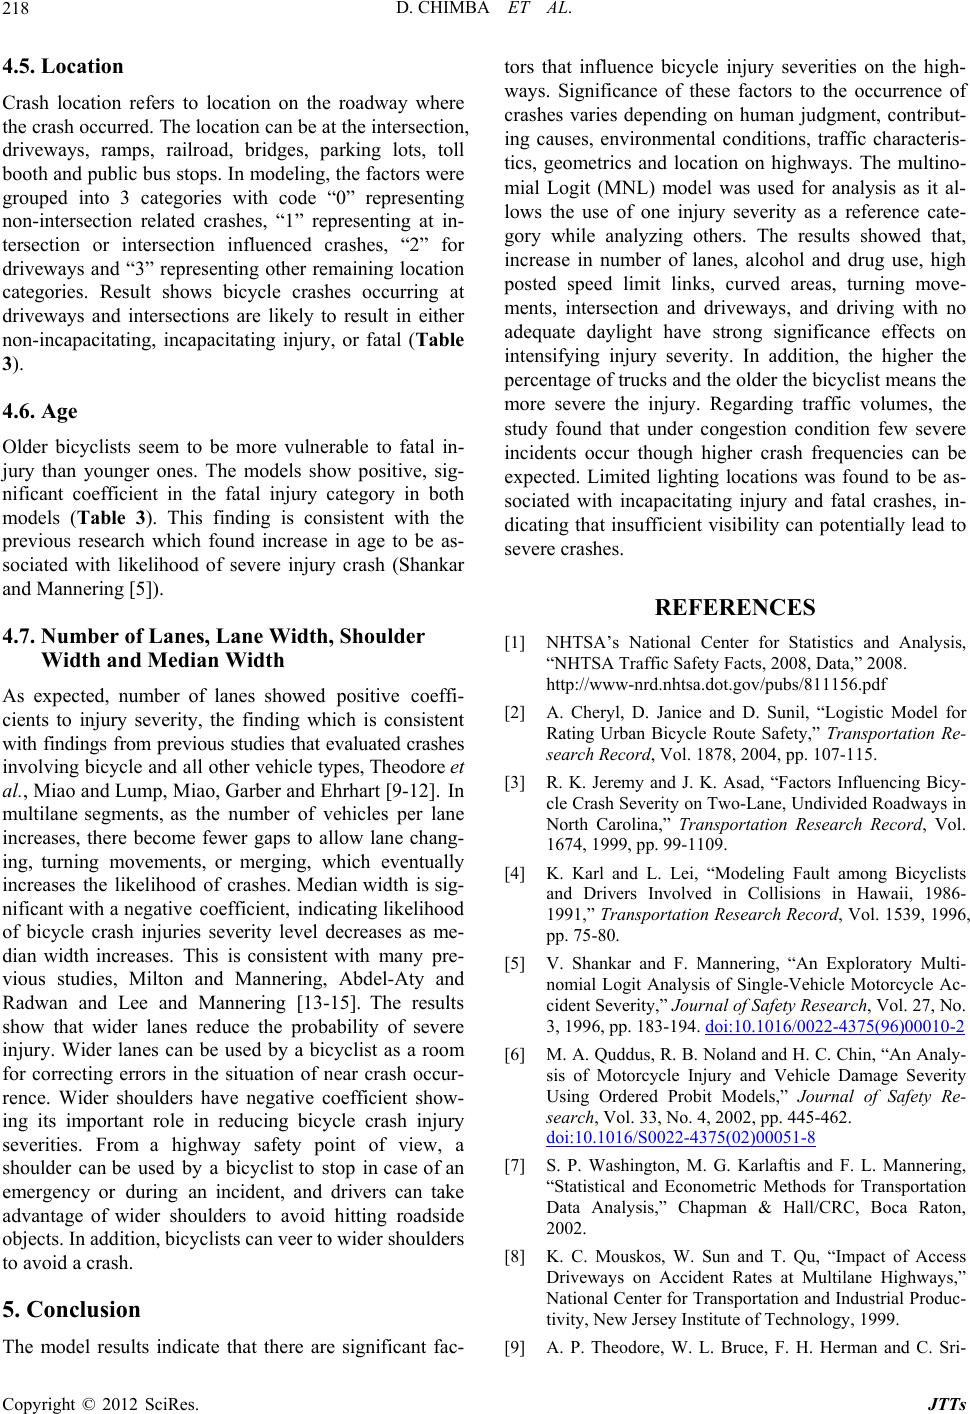 D. CHIMBA ET AL. 218 4.5. Location Crash location refers to location on the roadway where the crash occurred. The location can be at the intersection, driveways, ramps, railroad, bridges, parking lots, toll booth and public bus stops. In modeling, the factors were grouped into 3 categories with code “0” representing non-intersection related crashes, “1” representing at in- tersection or intersection influenced crashes, “2” for driveways and “3” representing other remaining location categories. Result shows bicycle crashes occurring at driveways and intersections are likely to result in either non-incapacitating, incapacitating injury, or fatal (Table 3). 4.6. Age Older bicyclists seem to be more vulnerable to fatal in- jury than younger ones. The models show positive, sig- nificant coefficient in the fatal injury category in both models (Table 3). This finding is consistent with the previous research which found increase in age to be as- sociated with likelihood of severe injury crash (Shankar and Mannering [5]). 4.7. Number of Lanes, Lane Width, Shoulder Width and Median Width As expected, number of lanes showed positive coeffi- cients to injury severity, the finding which is consistent with findings from previous studies that evaluated crashes involving bicycle and all other vehicle types, Theodore et al., Miao and Lump, Miao, Garber and Ehrhart [9-12]. In multilane segments, as the number of vehicles per lane increases, there become fewer gaps to allow lane chang- ing, turning movements, or merging, which eventually increases the likelihood of crashes. Median width is sig- nificant with a n egative co efficient, indicating likeliho od of bicycle crash injuries severity level decreases as me- dian width increases. This is consistent with many pre- vious studies, Milton and Mannering, Abdel-Aty and Radwan and Lee and Mannering [13-15]. The results show that wider lanes reduce the probability of severe injury. Wider lanes can be used by a bicyclist as a room for correcting errors in the situation of near crash occur- rence. Wider shoulders have negative coefficient show- ing its important role in reducing bicycle crash injury severities. From a highway safety point of view, a shoulder can be used by a bicyclist to stop in case of an emergency or during an incident, and drivers can take advantage of wider shoulders to avoid hitting roadside objects. In addi tion, bicycli sts can veer to w ider shoulders to avoid a crash. 5. Conclusion The model results indicate that there are significant fac- tors that influence bicycle injury severities on the high- ways. Significance of these factors to the occurrence of crashes varies depending on human judgment, contribut- ing causes, environmental conditions, traffic characteris- tics, geometrics and location on highways. The multino- mial Logit (MNL) model was used for analysis as it al- lows the use of one injury severity as a reference cate- gory while analyzing others. The results showed that, increase in number of lanes, alcohol and drug use, high posted speed limit links, curved areas, turning move- ments, intersection and driveways, and driving with no adequate daylight have strong significance effects on intensifying injury severity. In addition, the higher the percentage of trucks and the older the bicyclist means the more severe the injury. Regarding traffic volumes, the study found that under congestion condition few severe incidents occur though higher crash frequencies can be expected. Limited lighting locations was found to be as- sociated with incapacitating injury and fatal crashes, in- dicating that insufficient visibility can potentially lead to severe crashes. REFERENCES [1] NHTSA’s National Center for Statistics and Analysis, “NHTSA Traffic Safety Facts, 2008, Data,” 2008. http://www-nrd.nhtsa.dot.gov/pubs/811156.pdf [2] A. Cheryl, D. Janice and D. Sunil, “Logistic Model for Rating Urban Bicycle Route Safety,” Transportation Re- search Record, Vol. 1878, 2004, pp. 107-115. [3] R. K. Jeremy and J. K. Asad, “Factors Influencing Bicy- cle Crash Severity on Two-Lane, Undivided Roadways in North Carolina,” Transportation Research Record, Vol. 1674, 1999, pp. 99-1109. [4] K. Karl and L. Lei, “Modeling Fault among Bicyclists and Drivers Involved in Collisions in Hawaii, 1986- 1991,” Transportation Research Record, Vol. 1539, 1996, pp. 75-80. [5] V. Shankar and F. Mannering, “An Exploratory Multi- nomial Logit Analysis of Single-Vehicle Motorcycle Ac- cide nt Seve rity ,” Journal of Safety Research, Vol. 27, No. 3, 1996, pp. 183-194. doi:10.1016/0022-4375(96)00010-2 [6] M. A. Quddus, R. B. Noland and H. C. Chin, “An Analy- sis of Motorcycle Injury and Vehicle Damage Severity Using Ordered Probit Models,” Journal of Safety Re- search, Vol. 33, No. 4, 2002, pp. 445-462. doi:10.1016/S0022-4375(02)00051-8 [7] S. P. Washington, M. G. Karlaftis and F. L. Mannering, “Statistical and Econometric Methods for Transportation Data Analysis,” Chapman & Hall/CRC, Boca Raton, 2002. [8] K. C. Mouskos, W. Sun and T. Qu, “Impact of Access Driveways on Accident Rates at Multilane Highways,” National Center for Transportation and Industrial Produc- tivity, New Jersey Institute of Technology, 1999. [9] A. P. Theodore, W. L. Bruce, F. H. Herman and C. Sri- Copyright © 2012 SciRes. JTTs  D. CHIMBA ET AL. Copyright © 2012 SciRes. JTTs 219 kalyan, “Sidepath Safety Model Bicycle Sidepath Design Factors Affecting Crash Rates,” Journal of the Transpor- tation Research Board, Vol. 1982, 2006, pp. 194-201. [10] S. Miaou and H. Lump, “Modeling Vehicle Accidents and Highway Geometric Design Relationships,” Accident Analysis and Prevention, Vol. 25, No. 6, 1993, pp. 689- 709. doi:10.1016/0001-4575(93)90034-T [11] S. Miaou, “The Relationship between Truck Accidents and Geometric Design of Road Sections: Poisson versus Negative Binomial Regressions,” Accident Analysis and Prevention, Vol. 26, No. 4, 1994, pp. 471-482. doi:10.1016/0001-4575(94)90038-8 [12] N. J. Garber and A. A. Ehrhart, “The Effect of Speed, Flow, and Geometric Characteristics on Crash Rates for Different Types of Virginia Highways,” Virginia Trans- portation Council, 2000. [13] J. Milton and F. Mannering, “The Relationship among Highway Geometrics, Traffic-Related Elements and Mo- tor-Vehicle Accident Frequencies,” Transportation, Vol. 25, No. 4, 1998, pp. 395-413. doi:10.1023/A:1005095725001 [14] M. A. Abdel-Aty and A. E. Radwan, “Modeling Traffic Accident Occurrence and Involvement,” Accident Analy- sis and Prevention, Vol. 32, No. 5, 2000, pp. 633-642. doi:10.1016/S0001-4575(99)00094-9 [15] J. Lee and F. Mannering, “Impact of Roadside Features on the Frequency and Severity of Run-off-Roadway Ac- cidents: Empirical Analysis,” Accident Analysis and Pre- vention, Vol. 34, No. 2, 2002, pp. 149-161. doi:10.1016/S0001-4575(01)00009-4 |