

Paper Menu >>
Journal Menu >>
 Open Journal of Forestry 2012. Vol.2, No.3, 110-115 Published Online July 2012 in SciRes (http://www.SciRP.org/journal/ojf) http://dx.doi.org/10.4236/ojf.2012.23014 Copyright © 2012 SciRes. 110 Crown Ratio and Relative Spacing Relationships for Loblolly Pine Plantations Dehai Zhao, Michael Kane, Bruce E. Borders Warnell School of Forestry and Natural Resources, University of Georgia, Athens, USA Email: [email protected] Received April 13th, 2012; revised May 21st, 2012; accepted June 6th, 2012 Two loblolly pine (Pinus taeda L.) culture/density studies were established in 1995-1998 across the Lower Coastal Plain and Upper Coastal Plain/Piedmont regions of the southern USA. Each installation contains 12 plots of loblolly pine planted at six levels of density from 741 to 4448 trees/ha in combination with two levels of cultural intensity, operational and intensive. The data from 37 viable installations were used to evaluate the crown ratio and relative spacing relationship of loblolly pine plantations. The effects of planting density, site quality, and cultural intensity on the relationship were investigated with a nonlin- ear mixed-effects modeling approach. The crown ratio and relative spacing relationship is exceedingly predictable. When loblolly pine plantation stands reached the average live crown ratio of 0.40, a critical point representing a generally acceptable level of tree vigor, the corresponding relative spacing index ranged from 0.11 to 0.20, mainly depending on initial planting density. The information about the crown ratio and relative spacing relationship would be useful for selecting the best intensity and timing of thin- ning. Keywords: Loblolly Pine; Intensive Culture; Planting Density; Live Crown Ratio; Relative Spacing Index Introduction Thinning as a forest management practice is employed in pine plantations for various reasons. For examples, the appro- priate thinning regimes can reduce density-dependent mortality rates, increase individual tree growth rates, improve product assortme nt ratios, a nd enhance spatial and structural uniformity (Newton, 2009). Practically, there are several indicators of stand conditions that can aid in determining thinning regimes, such as live crown ratio (CR), relative spacing index (RS), and relative stand density (RD). CR is defined as the height of the live crown (the part of the tree with live branches) divided by the total height of the tree. CR is a common indicator of tree vigor (Smith, 1988) and used to determine the timing of and potential response of thinning (Bennett, 1955; Dyer & Burkhart, 1987; Long, 1985). Tree vigor and normal rate of diameter growth are maintained as long as CR is 0.40 or greater (Har- rington, 2000; Smith, 1988), and ideally a thinning treatment should be scheduled soon after average CR drops below 0.50 (Harrington, 2000). CR, also as an indirect measure of a tree’s photosynthetic capacity and a measure of stand density, is used as a predictor variable in many existing forest growth and yield models (Leites et al., 2009; Monserud & Sterba, 1996). RS is defined as the ratio of the average distance between trees to the average dominant height of stand. With square spacing the ratio is described as10000 R SHND, where N is the number of trees per hectare and HD is average dominant height (m). RS includes the number of trees and incorporates both site quality and age through dominant height; thus, it has been proposed as a useful measure of stand density for devel- oping thinning specifications for managed plantations (Wilson, 1946, 1979). Thinning schedules can be determined by setting proper upper and lower bounds of RS. The desired upper and lower RS bounds for loblolly pine (Pinus taeda L.) plantations were proposed at 0.3 and 0.2, respectively (Zhao et al., 2010). RD is the ratio between stand density index (SDI) and maxi- mum SDI. For loblolly pine the maximum SDI is 450. Stands begin to undergo density-related mortality (self-thinning) at 0.50 - 0.55 of maximum SDI (Dean & Baldwin, 1993; Drew & Flewelling, 1979). Therefore, thinning should be scheduled when RD reaches 0.45 (Dean & Baldwin, 1993; Harrington, 2000). Because these three criteria (CR, RS and RD) could be considered for selecting the best intensity and timing of thin- ning, there should be some predictable relationships among them. In general, both CR and RS decline over time, but they fol- low different patterns. CR follows an inverse sigmoidal curve. In early years, the CR remains very high, with live branches being retained over nearly 100 percent of stem. As the stand enters the period of total height rapid development the CR de- creases rapidly. Then as the stand grows older and the height rate is slowing down, the CR gradually levels at a minimum value. The change of RS over time follows a typical inverse-J trend, which is dependent on the relationship between height increment and mortality (Parker, 1978). In early years, the RS changes are due primarily to height growth. With crown closure the increasing mortality rate plays a more important role, and RS changes are slowing down. Then RS remains constant with a minimum value. For RD, it increases and approaches toward 1 as the stand develops, following a sigmoidal curve. There is a negative relationship between average CR and RD (Long, 1985). Dean (1999) found that average CR decreases linearly with increases in RD for loblolly pine plantations in the West Gulf. He developed a linear model for the CR and RD relationship and used to manage quality objectives. For the CR and RS, there is relatively little research on their relationship, except 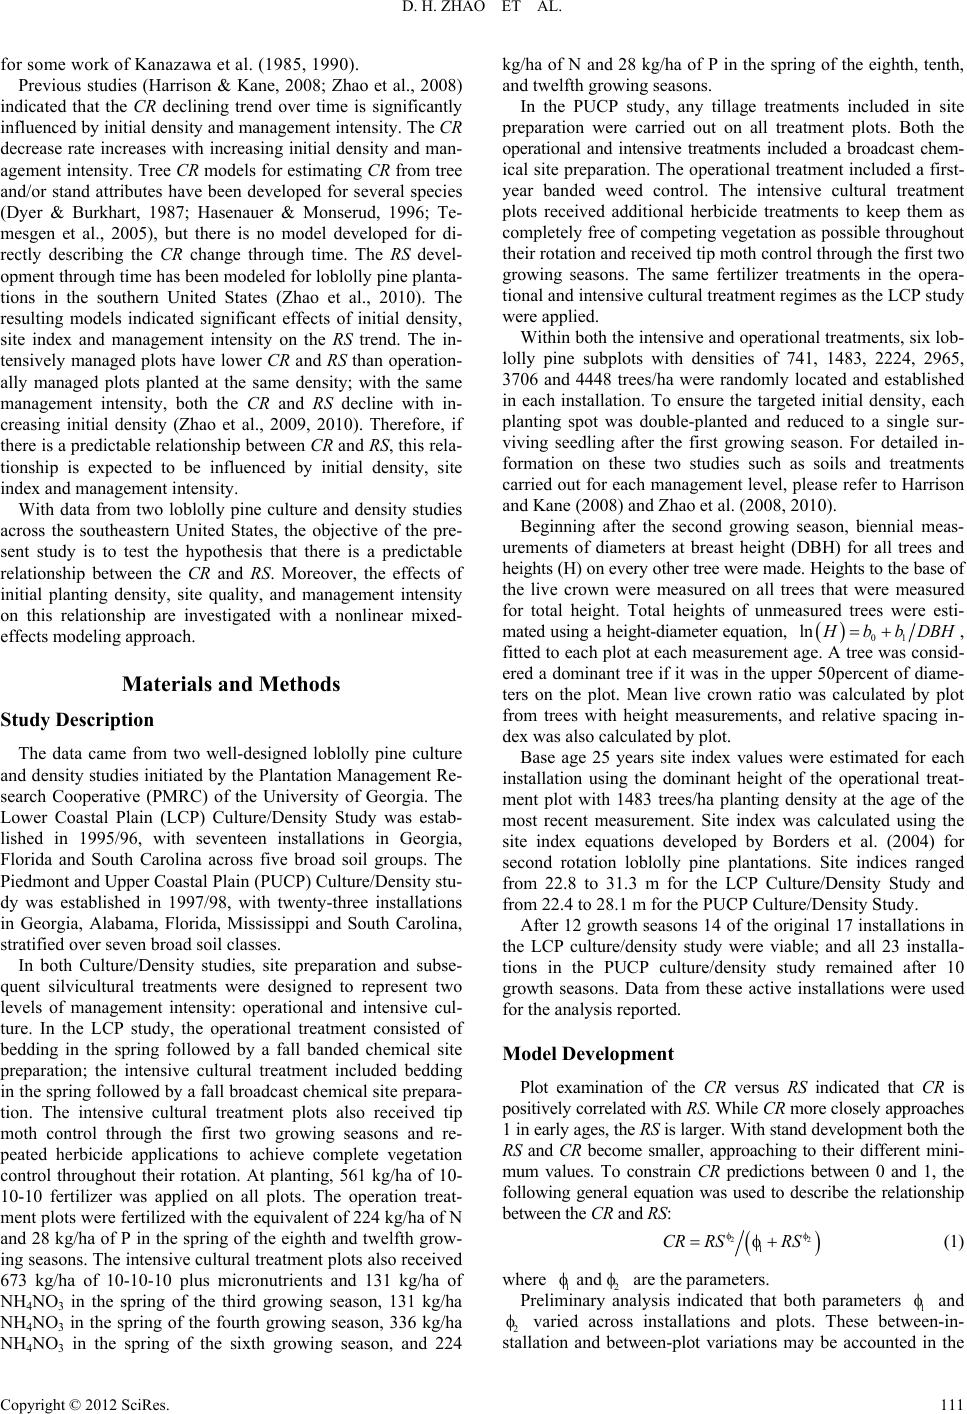 D. H. ZHAO ET AL. for some work of Kanazawa et al. (1985, 1990). Previous studies (Harrison & Kane, 2008; Zhao et al., 2008) indicated that the CR declining trend over time is significantly influenced by initial density and management intensity. The CR decrease rate increases with increasing initial density and man- agement intensity. Tree CR models for estimating CR from tree and/or stand attributes have been developed for several species (Dyer & Burkhart, 1987; Hasenauer & Monserud, 1996; Te- mesgen et al., 2005), but there is no model developed for di- rectly describing the CR change through time. The RS devel- opment through time has been modeled for loblolly pine planta- tions in the southern United States (Zhao et al., 2010). The resulting models indicated significant effects of initial density, site index and management intensity on the RS trend. The in- tensively managed plots have lower CR and RS than operation- ally managed plots planted at the same density; with the same management intensity, both the CR and RS decline with in- creasing initial density (Zhao et al., 2009, 2010). Therefore, if there is a predictable relationship between CR and RS, this rela- tionship is expected to be influenced by initial density, site index and management intensity. With data from two loblolly pine culture and density studies across the southeastern United States, the objective of the pre- sent study is to test the hypothesis that there is a predictable relationship between the CR and RS. Moreover, the effects of initial planting density, site quality, and management intensity on this relationship are investigated with a nonlinear mixed- effects modeling approach. Materials and Methods Study Description The data came from two well-designed loblolly pine culture and density studies initiated by the Plantation Management Re- search Cooperative (PMRC) of the University of Georgia. The Lower Coastal Plain (LCP) Culture/Density Study was estab- lished in 1995/96, with seventeen installations in Georgia, Florida and South Carolina across five broad soil groups. The Piedmont and Upper Coastal Plain (PUCP) Culture/Density stu- dy was established in 1997/98, with twenty-three installations in Georgia, Alabama, Florida, Mississippi and South Carolina, stratified over seven broad soil classes. In both Culture/Density studies, site preparation and subse- quent silvicultural treatments were designed to represent two levels of management intensity: operational and intensive cul- ture. In the LCP study, the operational treatment consisted of bedding in the spring followed by a fall banded chemical site preparation; the intensive cultural treatment included bedding in the spring followed by a fall broadcast chemical site prepara- tion. The intensive cultural treatment plots also received tip moth control through the first two growing seasons and re- peated herbicide applications to achieve complete vegetation control throughout their rotation. At planting, 561 kg/ha of 10- 10-10 fertilizer was applied on all plots. The operation treat- ment plots were fertilized with the equivalent of 224 kg/ha of N and 28 kg/ha of P in the spring of the eighth and twelfth grow- ing seasons. The intensive cultural treatment plots also received 673 kg/ha of 10-10-10 plus micronutrients and 131 kg/ha of NH4NO3 in the spring of the third growing season, 131 kg/ha NH4NO3 in the spring of the fourth growing season, 336 kg/ha NH4NO3 in the spring of the sixth growing season, and 224 kg/ha of N and 28 kg/ha of P in the spring of the eighth, tenth, and twelfth growing seasons. In the PUCP study, any tillage treatments included in site preparation were carried out on all treatment plots. Both the operational and intensive treatments included a broadcast chem- ical site preparation. The operational treatment included a first- year banded weed control. The intensive cultural treatment plots received additional herbicide treatments to keep them as completely free of competing vegetation as possible throughout their rotation and received tip moth control through the first two growing seasons. The same fertilizer treatments in the opera- tional and intensive cultural treatment regimes as the LCP study were applied. Within both the intensive and operational treatments, six lob- lolly pine subplots with densities of 741, 1483, 2224, 2965, 3706 and 4448 trees/ha were randomly located and established in each installation. To ensure the targeted initial density, each planting spot was double-planted and reduced to a single sur- viving seedling after the first growing season. For detailed in- formation on these two studies such as soils and treatments carried out for each management level, please refer to Harrison and Kane (2008) and Zhao et al. (2008, 2010). Beginning after the second growing season, biennial meas- urements of diameters at breast height (DBH) for all trees and heights (H) on every other tree were made. Heights to the base o f the live crown were measured on all trees that were measured for total height. Total heights of unmeasured trees were esti- mated using a height-diameter equation, 01 ln HbbDBH , fitted to each plot at each measurement age. A tree was consid- ered a dominant tree if it was in the upper 50percent of diame- ters on the plot. Mean live crown ratio was calculated by plot from trees with height measurements, and relative spacing in- dex was also calculated by plot. Base age 25 years site index values were estimated for each installation using the dominant height of the operational treat- ment plot with 1483 trees/ha planting density at the age of the most recent measurement. Site index was calculated using the site index equations developed by Borders et al. (2004) for second rotation loblolly pine plantations. Site indices ranged from 22.8 to 31.3 m for the LCP Culture/Density Study and from 22.4 to 28.1 m for the PUCP Culture/Density Study. After 12 growth seasons 14 of the original 17 installations in the LCP culture/density study were viable; and all 23 installa- tions in the PUCP culture/density study remained after 10 growth seasons. Data from these active installations were used for the analysis reported. Model Development Plot examination of the CR versus RS indicated that CR is positively correlated with RS. While CR more closely approaches 1 in early ages, the RS is larger. With stand development both the RS and CR become smaller, approaching to their different mini- mum values. To constrain CR predictions between 0 and 1, the following general equation was used to describe the relationship between the CR and RS: 2 1 CR RSRS 2 (1) where 12 and are the paramet ers. Preliminary analysis indicated that both parameters 1 and 2 varied across installations and plots. These between-in- stallation and between-plot variations may be accounted in the Copyright © 2012 SciRes. 111 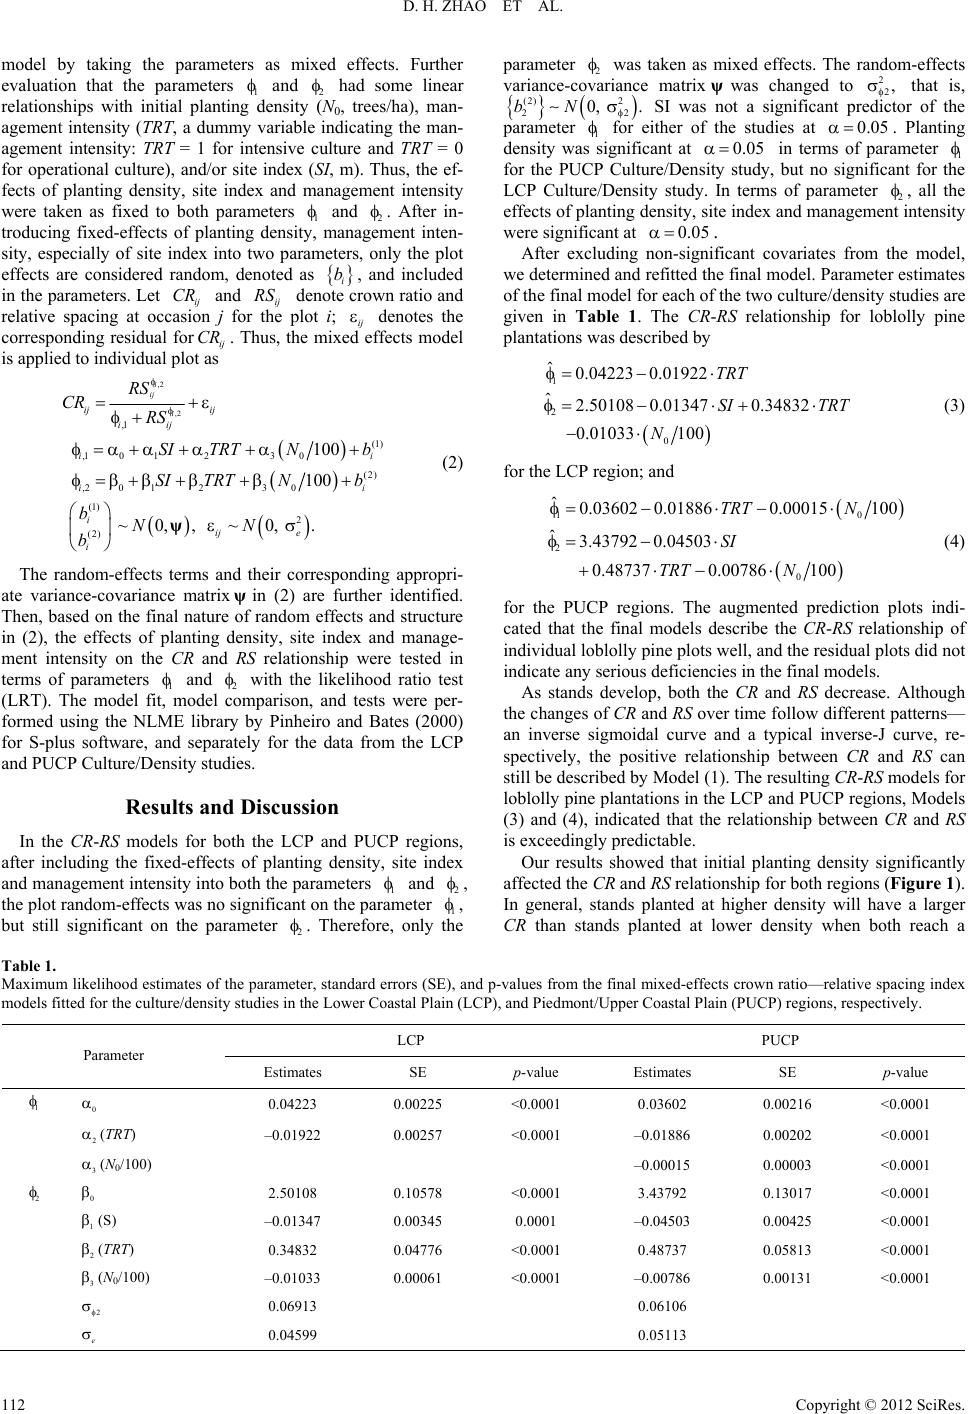 D. H. ZHAO ET AL. Copyright © 2012 SciRes. 112 model by taking the parameters as mixed effects. Further evaluation that the parameters 1 and 2 had some linear relationships with initial planting density (N0, trees/ha), man- agement intensity (TRT, a dummy variable indicating the man- agement intensity: TRT = 1 for intensive culture and TRT = 0 for operational culture), and/or site index (SI, m). Thus, the ef- fects of planting density, site index and management intensity were taken as fixed to both parameters 1 and 2. After in- troducing fixed-effects of planting density, management inten- sity, especially of site index into two parameters, only the plot effects are considered random, denoted as i b, and included in the parameters. Let ij and ij CR R S denote crown ratio and relative spacing at occasion j for the plot i; ij denotes the corresponding residual forij . Thus, the mixed effects model is applied to individual plot as CR parameter 2 was taken as mixed effects. The random-effects variance-covariance matrixwas changed to that is, ψ22, (2) 2 2 .bN 2 0, SI was not a significant predictor of the parameter 1 for either of the studies at . Planting density was significant at 0.05 0.05 in terms of parameter 1 for the PUCP Culture/Density study, but no significant for the LCP Culture/Density study. In terms of parameter 2 , all the effects of planting density, site index and management intensity were significant at 0.05 . After excluding non-significant covariates from the model, we determined and refitted the final model. Parameter estimates of the final model for each of the two culture/density studies are given in Table 1. The CR-RS relationship for loblolly pine plantations was described by 100 0 b ,2 2 2 , i ii j SI T ,2 ,1 ,10 10 ,20 10 (1) 2 (2) 10 ~ 0,. i ij ij ie i RS CR RS SI b b (1) (2) ii ii b 3 0, N N 3 NN ~ ij ij TRT RT 1 2 0 ˆ0.04223 0.01922 ˆ2.50108 0.013470.34832 0.01033 100 TRT SI TRT N (3) ψ (2) for the LCP region; and 10 2 0 ˆ0.03602 0.018860.00015100 ˆ3.43792 0.04503 0.487370.00786100 TRT N SI TRT N (4) The random-effects terms and their corresponding appropri- ate variance-covariance matrixψin (2) are further identified. Then, based on the final nature of random effects and structure in (2), the effects of planting density, site index and manage- ment intensity on the CR and RS relationship were tested in terms of parameters 1 and 2 with the likelihood ratio test (LRT). The model fit, model comparison, and tests were per- formed using the NLME library by Pinheiro and Bates (2000) for S-plus software, and separately for the data from the LCP and PUCP Culture/Density studies. for the PUCP regions. The augmented prediction plots indi- cated that the final models describe the CR-RS relationship of individual loblolly pine plots well, and the residual plots did not indicate any serious deficiencies in the final models. As stands develop, both the CR and RS decrease. Although the changes of CR and RS over time follow different patterns— an inverse sigmoidal curve and a typical inverse-J curve, re- spectively, the positive relationship between CR and RS can still be described by Model (1). The resulting CR-RS models for loblolly pine plantations in the LCP and PUCP regions, Models (3) and (4), indicated that the relationship between CR and RS is exceedingly predictable. Results and Discussion In the CR-RS models for both the LCP and PUCP regions, after including the fixed-effects of planting density, site index and management intensity into both the parameters 1 Our results showed that initial planting density significantly affected the CR and RS relationship for both regions (Figure 1). In general, stands planted at higher density will have a larger CR than stands planted at lower density when both reach a and 2 , the plot random-effects was no significant on the parameter 1 , but still significant on the parameter . Therefore, only the 2 Table 1. Maximum likelihood estimates of the parameter, standard errors (SE), and p-values from the final mixed-effects crown ratio—relative spacing index models fitted for the culture/ d e nsity studies in the Lower Coastal Plain (LCP), and Piedmont/Upper Coastal Plain (PUCP) r e g i o n s , respectively. LCP PUCP Parameter Estimates SE p-value Estimates SE p-value 0 0.04223 0.00225 <0.0001 0.03602 0.00216 <0.0001 2 (TRT) –0.01922 0.00257 <0.0001 –0.01886 0.00202 <0.0001 1 3 (N0/100) –0.00015 0.00003 <0.0001 2 0 2.50108 0.10578 <0.0001 3.43792 0.13017 <0.0001 1 (S) –0.01347 0.00345 0.0001 –0.04503 0.00425 <0.0001 2 (TRT) 0.34832 0.04776 <0.0001 0.48737 0.05813 <0.0001 3 (N0/100) –0.01033 0.00061 <0.0001 –0.00786 0.00131 <0.0001 2 0.06913 0.06106 e 0.04599 0.05113 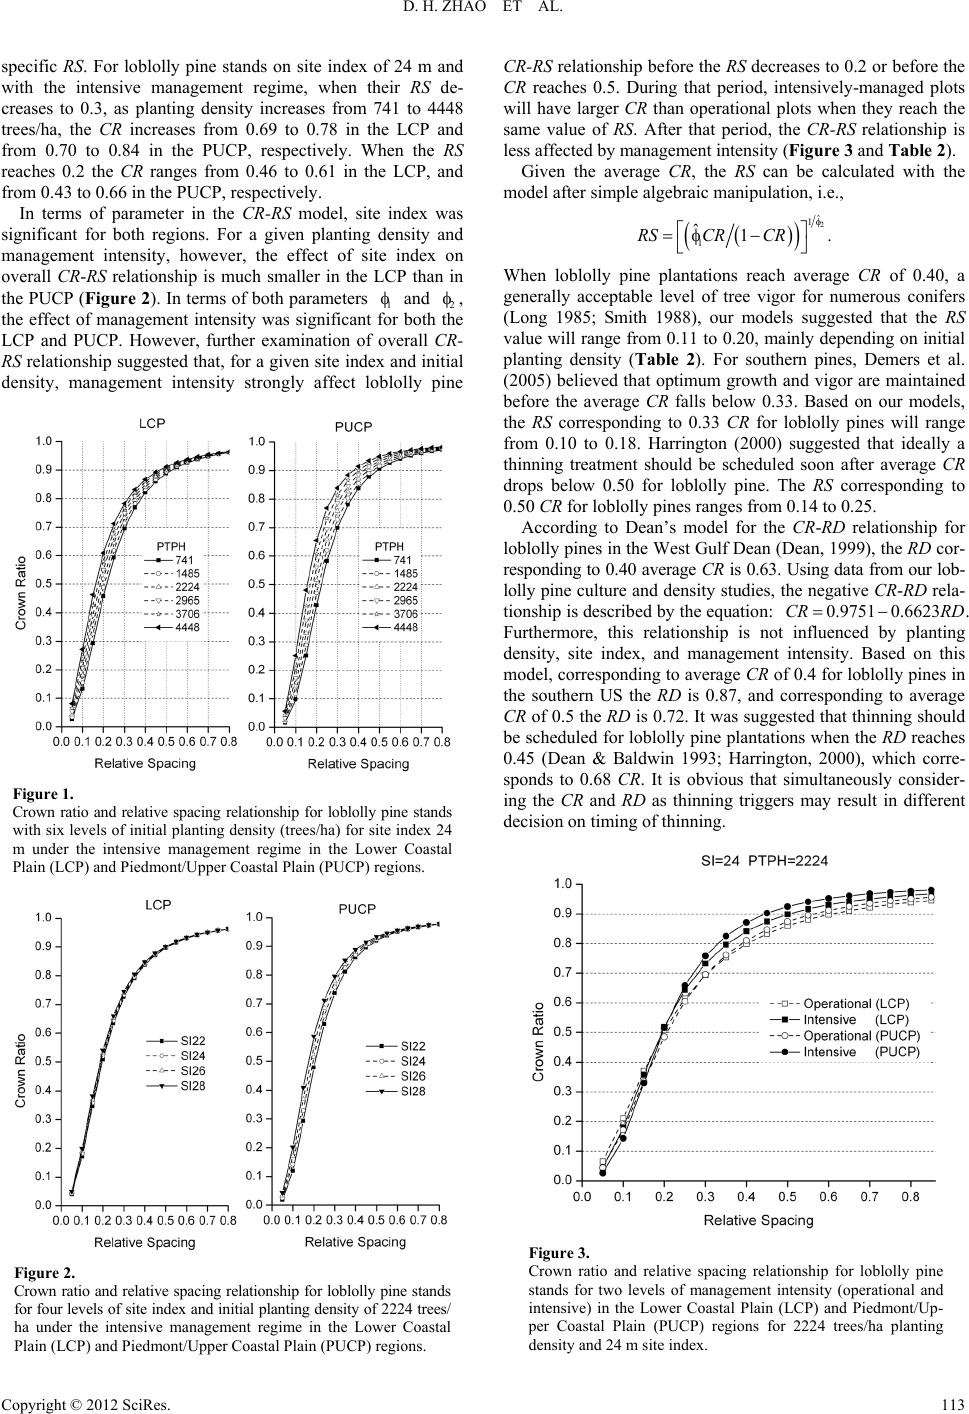 D. H. ZHAO ET AL. specific RS. For loblolly pine stands on site index of 24 m and with the intensive management regime, when their RS de- creases to 0.3, as planting density increases from 741 to 4448 trees/ha, the CR increases from 0.69 to 0.78 in the LCP and from 0.70 to 0.84 in the PUCP, respectively. When the RS reaches 0.2 the CR ranges from 0.46 to 0.61 in the LCP, and from 0.43 to 0.66 in the PUCP, respectively. In terms of parameter in the CR-RS model, site index was significant for both regions. For a given planting density and management intensity, however, the effect of site index on overall CR-RS relationship is much smaller in the LCP than in the PUCP (Figure 2). In terms of both parameters 1 and 2 , the effect of management intensity was significant for both the LCP and PUCP. However, further examination of overall CR- RS relationship suggested that, for a given site index and initial density, management intensity strongly affect loblolly pine Figure 1. Crown ratio and relative spacing relationship for loblolly pine stands with six levels of initial planting density (trees/ha) for site index 24 m under the intensive management regime in the Lower Coastal Plain (LCP) and Piedmont/Upper Coastal Plain ( PUCP) regions. Figure 2. Crown ratio and relative spacing relationship for loblolly pine stands for four levels of s ite index and in itial planting density of 2224 trees/ ha under the intensive management regime in the Lower Coastal Plain (LCP) and Piedmont/Upper Coastal Plain ( PUCP) regions. CR-RS relationship before the RS decreases to 0.2 or before the CR reaches 0.5. During that period, intensively-managed plots will have larger CR than operational plots when they reach the same value of RS. After that period, the CR-RS relationship is less affected by management intensity (Figure 3 and Table 2). Given the average CR, the RS can be calculated with the model after simple algebraic manipulation, i.e., 2 ˆ 1 1 ˆ1.RSCRCR When loblolly pine plantations reach average CR of 0.40, a generally acceptable level of tree vigor for numerous conifers (Long 1985; Smith 1988), our models suggested that the RS value will range from 0.11 to 0.20, mainly depending on initial planting density (Table 2). For southern pines, Demers et al. (2005) believed that optimum growth and vigor are maintained before the average CR falls below 0.33. Based on our models, the RS corresponding to 0.33 CR for loblolly pines will range from 0.10 to 0.18. Harrington (2000) suggested that ideally a thinning treatment should be scheduled soon after average CR drops below 0.50 for loblolly pine. The RS corresponding to 0.50 CR for loblolly pines ranges from 0.14 to 0.25. According to Dean’s model for the CR-RD relationship for loblolly pines in the West Gulf Dean (Dean, 1999), the RD cor- responding to 0.40 average CR is 0.63. Usi ng data from our lob- lolly pine culture and density studies, the negative CR-RD rela- tionship is described by the equation: . Furthermore, this relationship is not influenced by planting density, site index, and management intensity. Based on this model, corresponding to average CR of 0.4 for loblolly pines in the southern US the RD is 0.87, and corresponding to average CR of 0.5 the RD is 0.72. It was suggested that thinning should be scheduled for loblolly pine plantations when the RD reaches 0.45 (Dean & Baldwin 1993; Harrington, 2000), which corre- sponds to 0.68 CR. It is obvious that simultaneously consider- ing the CR and RD as thinning triggers may result in different decision on timing of thinning. 0.9751 0.6623CR RD Figure 3. Crown ratio and relative spacing relationship for loblolly pine stands for two levels of management intensity (operational and intensive) in the Lower Coastal Plain (LCP) and Piedmont/Up- per Coastal Plain (PUCP) regions for 2224 trees/ha planting density and 24 m site index. Copyright © 2012 SciRes. 113 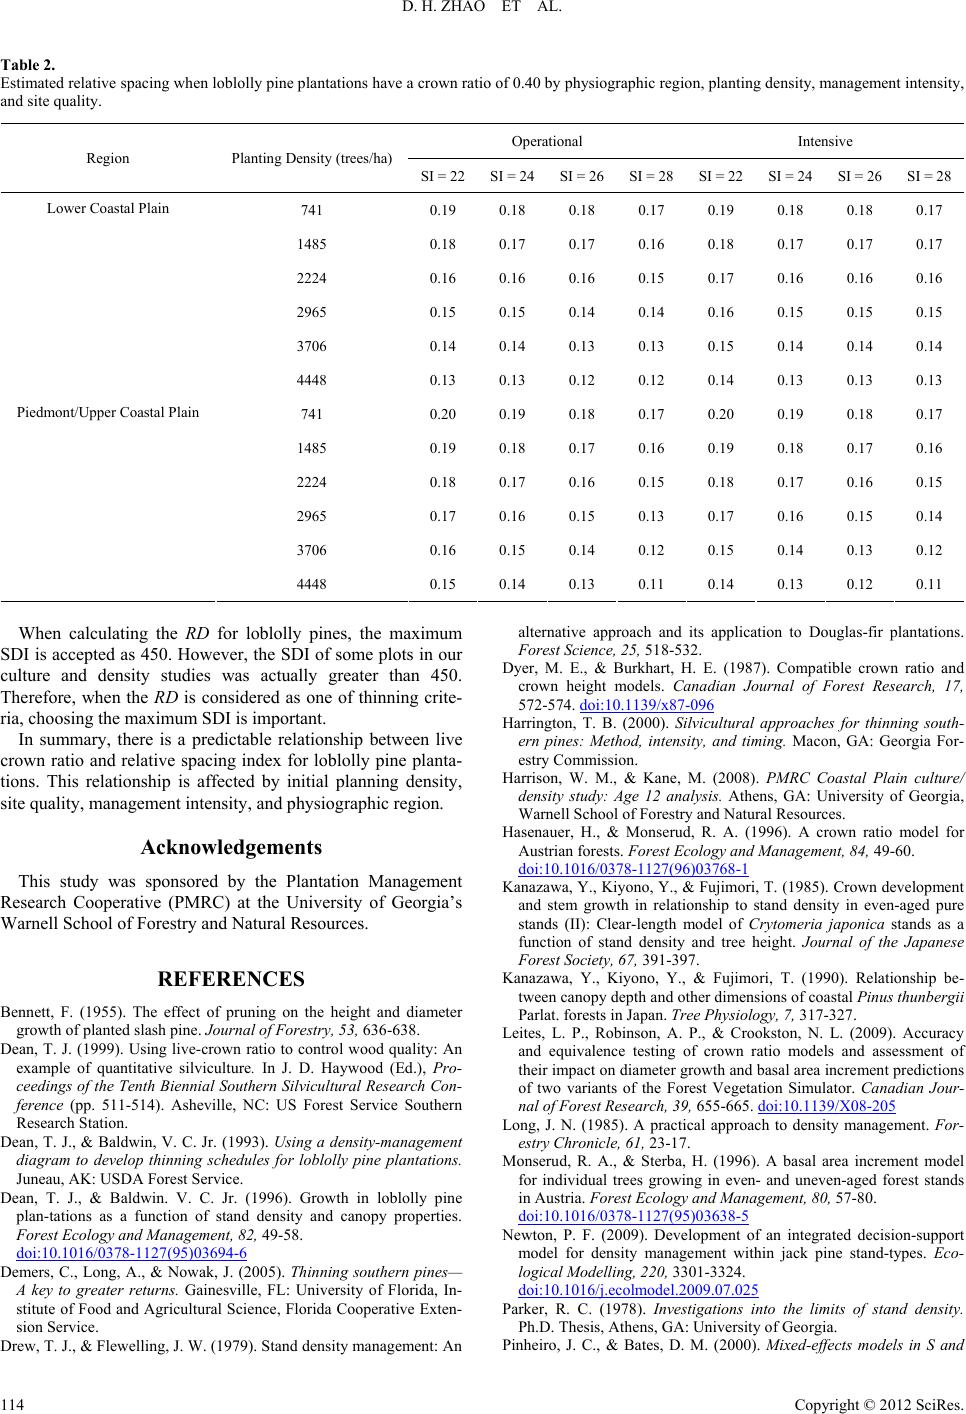 D. H. ZHAO ET AL. Table 2. Estimated relative spacing when loblolly pine plantations have a crown ratio of 0.40 by physiographic region, planting density, management intensity, ality. and site qu Operational Intensive Region Planting Density (trees/ha) SI = 22SI SI = 28SI = 22 SI = 26SI = 28= 24SI = 26 24 SI = 741 0.19 0.18 0.18 0.17 0.19 0.18 0.18 0.17 14 LowePlain 14 Piedmont/Upper Coastal Plain 85 0.18 0.17 0.17 0.16 0.18 0.17 0.17 0.17 2224 0.16 0.16 0.16 0.15 0.17 0.16 0.16 0.16 2965 0.15 0.15 0.14 0.14 0.16 0.15 0.15 0.15 3706 0.14 0.14 0.13 0.13 0.15 0.14 0.14 0.14 r Coastal 4448 0.13 0.13 0.12 0.12 0.14 0.13 0.13 0.13 741 0.20 0.19 0.18 0.17 0.20 0.19 0.18 0.17 85 0.19 0.18 0.17 0.16 0.19 0.18 0.17 0.16 2224 0.18 0.17 0.16 0.15 0.18 0.17 0.16 0.15 2965 0.17 0.16 0.15 0.13 0.17 0.16 0.15 0.14 3706 0.16 0.15 0.14 0.12 0.15 0.14 0.13 0.12 4448 0.15 0.14 0.13 0.11 0.14 0.13 0.12 0.11 When calculating the RD for loblolls, the maxi DI is accepted as 450. However, the SDI of some plots in our cu lolly pine planta- tio This study wastion Management Research Cooperasity of Georgia’s W Bennett, F. (1955). Thee height and diameter growth of planted slary, 53, 636-638. D y pinemum Slture and density studies was actually greater than 450. Therefore, when the RD is considered as one of thinning crite- ria, choosing the maximum SDI is important. In summary, there is a predictable relationship between live crown ratio and relative spacing index for lob ns. This relationship is affected by initial planning density, site quality, management intensity, and physiographic region. Acknowledgements sponsored by the Planta tive (PMRC) at the Univer arnell School of Forestry and Natural Resources. REFERENCES effect of pruning on th sh pine. Journal of Forest Dean, T. J. (1999). Using live-crown ratio to control wood quality: An example of quantitative silviculture. In J. D. Haywood (Ed.), Pro- ceedings of the Tenth Biennial Southern Silvicultural Research Con- ference (pp. 511-514). Asheville, NC: US Forest Service Southern Research Station. ean, T. J., & Baldwin, V. C. Jr. (1993). Using a density-management diagram to develop thinning schedules for loblolly pine plantations. Juneau, AK: USDA Forest Service. Dean, T. J., & Baldwin. V. C. Jr. (1996). Growth in loblolly pine plan-tations as a function of stand density and canopy properties. Forest Ecology and Management, 82, 49-58. doi:10.1016/0378-1127(95)03694-6 emers, C., Long, A., & Nowak, J. (2005). Thinning southern pines— A key to greater returns. Gainesville, FL: Univ Dersity of Florida, In- Dr ernative approach and its applicatiooug plantations. Forest Science, 25, 518-532. D stitute of Food and Agricultural Science, Florida Cooperative Exten- sion Service. ew, T. J., & Flewelling, J. W. (1979). Stand density management: An yer, M. E., & Burkhart, H. E. (1987). Compatible crown ratio and crown height models. Canadian Journal of Forest Research, 17, alt n to Dlas-fir 572-574. doi:10.1139/x87-096 Harrington, T. B. (2000). Silvicultural approaches for thinning south- ern pines: Method, intensity, and timing. Macon, GA: Georgia For- estry Commission. Harrison, W. M., & Kane, M. (2008). PMRC Coastal Plain culture/ density study: Age 12 analysis. Athens, GA: University of Georgia, Warnell School of Forestry and Natural Resources. Hasenauer, H., & Monserud, R. A. (1996). A crown ratio model for Austrian forests. Forest Ecology and Management, 84, 49-60. doi:10.1016/0378-1127(96)03768-1 Kanazawa, Y., Kiyono, Y., & Fujimori, T. (1985). Crown development and stem growth in relationship to stand density in even-aged pure stands (II): Clear-length model of Crytomeria japonica stands as a function of stand density and tree height. Journal of the Japanese Forest Society, 67, 391-397. Kanazawa, Y., Kiyono, Y., & Fujimori, T. (1990). Relationship be- tween canopy depth and other dimensions of coastal Pin us thunbergii Parlat. forests in Japan. Tree Physiology, 7, 317-327. eites, L. P., Robinson, A. P., & Crookston, N. L. (2009). Accuracy and equivalence testing of crown ratio models and assessment of L their impact on diameter growth and basal area increment predictions of two variants of the Forest Vegetation Simulator. Canadian Jour- nal of Forest Research, 39, 655-665. doi:10.1139/X08-205 Long, J. N. (1985). A practical approach to density management. For- estry Chronicle, 61, 23-17. onserud, R. A., & Sterba, H. (1996). A basal area increment model for individual trees growing in even- and uneven-aged forest stands in Austria. Forest Ec ology and Management, 80, 57-80. M doi:10.1016/0378-1127(95)03638-5 Newton, P. F. (2009). Development of an integrated decision-support model for density management within jack pine stand-types. Eco- logical Modelli ng, 220, 3301-3324. doi:10.1016/j.ecolmodel.2009.07.025 arker, R. C. (1978). Investigations into the limits of stanPd density. Ph.D. Thesis, Athens, GA: University of Georgia. Pinheiro, J. C., & Bates, D. M. (2000). Mixed-effects models in S and Copyright © 2012 SciRes. 114  D. H. ZHAO ET AL. S-PLUS. New York: Springer-Verlag. doi:10.1007/978-1-4419-0318-1 mith, D. M. (1988). The practice of si Slviculture. New York: John Tee crown ratio , 133-141. Wpression of stocking in term of W graphic spac- Z8). SAGS culture/density Wiley. emesgen, H., LeMay, V., & Mitchell, S. J. (2005). Tr models for multi-species and multi-layered stands of southeastern British Columbia. Forestry Chronicle, 81 ilson, F. G. (1946). Numerical ex height. Journal of Forestry, 44, 758-761. ilson, F.G. 1979. Thinning as an orderly discipline: A ing schedule for red pi ne . Journal of Forestry, 77, 483-486. hao, D., Kane, M., & Harrison, W. M. (200 study: Results through age 10. Athens, GA: University of Georgia, Warnell School of Forestry and Natural Resources. Zhao, D., Kane, M., & Borders, E. B. (2010). Development and appli- cations of the relative spacing model for loblolly pine plantations. Forest Ecology and Management, 259, 1922-1929. doi:10.1016/j.foreco.2010.02.003 Copyright © 2012 SciRes. 115 |